Alternative anodes for Na–O2 batteries: the case of the Sn4P3 alloy†
Juan Luis
Gómez-Cámer‡
a,
Idoia
Ruiz de Larramendi
 b,
Marina
Enterría
a,
Iñigo
Lozano
ab,
Begoña
Acebedo
a,
Domitille
Bordeau
 a and
Nagore
Ortiz-Vitoriano
*ac
aCenter for Cooperative Research on Alternative Energies (CIC energiGUNE), Basque Research and Technology Alliance (BRTA), Parque Tecnológico de Álava, Albert Einstein 48, 01510 Vitoria-Gasteiz, Spain. E-mail: nortiz@cicenergigune.com
bDepartamento de Química Orgánica e Inorgánica, Universidad del País Vasco (UPV/EHU), P. O. Box 664, 48080 Bilbao, Spain
cIkerbasque, Basque Foundation for Science, María Díaz de Haro 3, 48013 Bilbao, Spain
First published on 13th October 2021
Abstract
An alternative anodeto metallic sodium based on the high capacity of Sn4P3 alloy is investigated for the first time in Na–O2 batteries. This alloy is synthesised by an easy and scalable method based on ball milling which is further optimized in order to obtain the most suitable morphology while avoiding agglomeration of the material. First, the stability of Sn4P3/C composite within the battery environment is analysed and compared to that of metallic Na. Second, the electrochemical study reveals the formation of sodium superoxide on both the metallic anode and Sn4P3 alloy for the first time, which evidences the existence of O2/O2− crossover processes. Complementary impedance studies, at various voltages and as a function of cycle number, demonstrate a higher stability of the solid electrolyte interphase (SEI) throughout cycling in addition to presenting lower reactivity and greater stability than the metallic Na system. Regarding the cycling performance, although it is lower than that of metallic Na, it surpasses that exhibited by other alternative anodes under similar conditions. This work therefore demonstrates the viability of a new family of anodes, paving the way for the development of more stable and safer Na–O2 batteries. Moreover, the importance of oxygen crossover is highlighted which is a common problem regardless of the anode used.
1. Introduction
Metal–O2 (M–O2) batteries face new energy challenges that require a higher energy density than that provided by lithium-ion batteries, whose theoretical capacity is limited by the process of intercalation/deintercalation of lithium ions. Specifically, M–O2 batteries have the potential to play an important role in the development of electric vehicles, due to their high theoretical energy density compared to current systems.1 In addition, the extensive use of lithium-based batteries has revealed some issues related to the abundance and geographical distribution of this element.2 For this reason, in addition to their good performance and lower cost, in recent years, sodium-based batteries have experienced growing interest within the scientific community.3A sodium based battery which has attracted a great deal of attention is the Na–O2 battery, due to its lower charge overpotential (<200 mV) when compared with its lithium counterpart.4 This battery presents a low voltage hysteresis because it undergoes a one electron electrochemical reaction (in Li–air, the two electron reaction occurs leading to Li2O2) through the formation and decomposition of NaO2 as the main discharge product, apart from presenting less side reactions compared to Li–O2 cell analogues.4 However, the development of Na–O2 batteries is still in its infant stage. In recent years, there has been a great advancement in the understanding of the mechanisms involved during charge and discharge processes, which has allowed a more rational design of different components of the battery. Based on these discoveries, research has focused mainly on the design of new air electrodes with new morphologies or the modification of their surface with different molecules and compounds that facilitate the catalysis of the oxygen reduction and evolution reactions (ORR/OER).5–7 Carbon materials have been mostly studied as Na–O2 battery cathodes due to their low cost, high surface area, chemical stability, high conductivity, developed porosity and intrinsic catalytic activity towards the ORR/OER.5,7–10 Lately, the electrolyte has received considerable attention from the scientific community. Different formulations have been explored that allow a greater stabilization of the discharge products within the electrolyte in order to avoid the blockage of active sites in the air electrode with insulating products such as sodium superoxide (NaO2) and the occurrence of parasitic reactions.6,11–17
The least studied component of Na–O2 batteries is, without a doubt, the anode. The preferred negative electrode in this type of device is metallic sodium,18 due to its high abundance and high gravimetric capacity (1166 mA h g−1).8 Despite its great potential, the use of metallic sodium as the negative electrode presents some drawbacks:19 (1) inhomogeneous plating/stripping process during discharge (sodium ions are released)/charge (sodium ions are deposited on the surface of the anode), (2) the formation of dendrites, which leads to internal short-circuits and poor cycling,20,21 and (3) the reactivity between Na+ and the electrolyte which leads to the consumption of both, leading to the appearance of side products on the surface of the anode. Thus, these products increase the impedance of the anode/electrolyte interface and limit the cycling capability to tens of cycles.
Due to the above-mentioned limitations, the advancement of Na–O2 batteries based on the use of the metallic Na anode is highly complex and challenging. Most of the studies propose various strategies to prevent dendrite formation, such as the use of additives to control the decomposition of the electrolyte and thus protect the anode, and artificial SEI layers, or structural modifications of the current collector and the use of 3D host electrodes for metallic Na.22 It is therefore vital to explore other materials that can act as negative electrodes without the limitations associated with metallic Na. Zhao et al. discussed several potential anode materials for Na–O2 batteries; however the cited references are studies related to Na-ion anodes.23 So far, few studies have been published exploring alternative anodes such as sodiated carbon24 and antimony25 for Na–O2 batteries. First, Bender et al. replaced Na metal with a sodiated Freudenberg H2315 gas diffusion layer (a material composed by carbon fibers) where they observed that (1) the sum of overpotentials at 50% depth of discharge (DoD) and the cycle life was superior in the sodiated GDL.24 Later, Dilimon et al. studied a pre-sodiated antimony (Sb) anode in a Na–O2 cell with a DMSO-based electrolyte.25 Although their goal was to use the DMSO solvent, which cannot be used with Na metal, they showed some cyclability results performing 10 cycles with 86% coulombic efficiency averaged over these cycles. However, the capacity faded from 0.3 to 0.05 mA h cm−2 in the first and 10th cycle, respectively. Additionally, sodium–vanadium phosphate, with a redox potential of around 3.35 V, was proposed as the counter/reference electrode, although it could not be considered as an anode.26
Regarding alternative anodes for Na-ion batteries, various types of materials have been proposed: hard carbon,27 Sn- and Sb-based alloys,21 transition metal oxides, sulfides and selenides,28,29 P and phosphide-based compounds and organic materials.30,31 Among them, tin phosphide Sn4P3 exhibits a high theoretical volumetric specific charge of 6650 mA h cm−3, even higher than that of P, and high electronic conductivity.30 This compound has already been studied in Na-ion batteries, emerging as a promising anode with a high practical gravimetric and volumetric specific charge. Moreover, our recent studies of the tin phosphide anode for Na-ion batteries, synthesized by a simple and scalable ball milling procedure and cycled in a glyme-based electrolyte, have demonstrated improved electrochemical performance compared to carbonate-based electrolytes.31 As described in recent studies of the group of Prof. Knibbe, it is important to control its morphology to minimize the large expansion volume that occurs during cycling,32,33 which causes agglomeration of tin particles, phase segregation and poor capacity retention.
In this work, we have therefore optimized the easy and scalable synthesis method already reported by our group31 by controlling parameters such as the powder to ball ratio, ball size, milling conditions, and milling time in order to minimize both the agglomeration and the volume expansion during cycling. This improved Sn4P3 alloy, which provided such excellent performance in Na-ion batteries as the negative electrode, is implemented and evaluated in Na–O2 batteries. The impact of this alternative anode material on Na–O2 battery cycle life, dendrite suppression and oxygen crossover is exhaustively analyzed.
2. Experimental
2.1. Synthesis and physicochemical characterization of the Sn4P3 alloy
Tin (ABCR, 99.5%) and red phosphorus (Sigma-Aldrich, >97%) were used as received. Sn4P3/C composites were prepared via a two-step mechanical milling process (Fritsch, Pulverisette 5) with ZrO2 balls in a container (80 mL). In the first step, Sn4P3 powder was prepared by using Sn and amorphous red phosphorus in the corresponding stoichiometric amounts. The milling process was conducted under an Ar atmosphere at 350 rpm varying the milling time, the step time and the powder-to-ball ratio, as detailed in Table 1. In the second step, Sn4P3 powder was milled with 7 wt% of carbon Super C65 (Imerys Graphite & Carbon) under an Ar atmosphere at 300 rpm for 20 h with a powder-to-ball ratio of 30![[thin space (1/6-em)]](https://www.rsc.org/images/entities/char_2009.gif) :
:![[thin space (1/6-em)]](https://www.rsc.org/images/entities/char_2009.gif) 1.
1.
| Experiment number | Powder to ball ratio | Ball size (mm) | Milling conditions (min milling/resting) | Effective milling time (h) |
|---|---|---|---|---|
| A | 1![[thin space (1/6-em)]](https://www.rsc.org/images/entities/char_2009.gif) : :![[thin space (1/6-em)]](https://www.rsc.org/images/entities/char_2009.gif) 20 20 |
10 | 30′/5′ | 6 |
| B | 1![[thin space (1/6-em)]](https://www.rsc.org/images/entities/char_2009.gif) : :![[thin space (1/6-em)]](https://www.rsc.org/images/entities/char_2009.gif) 20 20 |
10 | 30′/5′ | 8 |
| C | 1![[thin space (1/6-em)]](https://www.rsc.org/images/entities/char_2009.gif) : :![[thin space (1/6-em)]](https://www.rsc.org/images/entities/char_2009.gif) 30 30 |
10 | 30′/5′ | 6 |
| D | 1![[thin space (1/6-em)]](https://www.rsc.org/images/entities/char_2009.gif) : :![[thin space (1/6-em)]](https://www.rsc.org/images/entities/char_2009.gif) 30 30 |
10 | 30′/5′ | 8 |
| E | 1![[thin space (1/6-em)]](https://www.rsc.org/images/entities/char_2009.gif) : :![[thin space (1/6-em)]](https://www.rsc.org/images/entities/char_2009.gif) 20 20 |
5 | 30′/5′ | 6 |
| F | 1![[thin space (1/6-em)]](https://www.rsc.org/images/entities/char_2009.gif) : :![[thin space (1/6-em)]](https://www.rsc.org/images/entities/char_2009.gif) 20 20 |
5 | 30′/5′ | 8 |
| G | 1![[thin space (1/6-em)]](https://www.rsc.org/images/entities/char_2009.gif) : :![[thin space (1/6-em)]](https://www.rsc.org/images/entities/char_2009.gif) 30 30 |
5 | 30′/5′ | 6 |
| H | 1![[thin space (1/6-em)]](https://www.rsc.org/images/entities/char_2009.gif) : :![[thin space (1/6-em)]](https://www.rsc.org/images/entities/char_2009.gif) 20 20 |
5 | 15′/5′ | 6 |
| I | 1![[thin space (1/6-em)]](https://www.rsc.org/images/entities/char_2009.gif) : :![[thin space (1/6-em)]](https://www.rsc.org/images/entities/char_2009.gif) 20 20 |
5 | 15′/5′ | 8 |
Several synthesis conditions such as the powder-to-ball ratio, effective milling time, milling step time and ball diameter were tested as shown in Table 1. Synthesis A, from now on original synthesis, corresponds to the initial preparation procedure as described in our previous work.31
The crystalline structure of the samples was examined by using an X-ray diffractometer (Bruker Discover D8) with a Cu Kα radiation source (λ = 1.5406 Å) at 40 kV and 30 mA. Morphological analysis was carried out using a FEI Quanta 200 FEG scanning electron microscope (SEM) and a FEI Tecnai F-20 (200 kV) transmission electron microscope (TEM). The particle size distribution was analyzed using a Malvern Mastersizer 3000. Finally, the carbon content was measured by elemental analysis using a ThermoFisher Scientific Flash 2000 analyzer.
2.2. Preparation of the Sn4P3 negative electrodes and Na-ion cell performance
In order to assess the stability of the anode material and explore its electrochemical response, Sn4P3 electrodes were analyzed in Na-ion half-cells. Electrodes were prepared by mixing Sn4P3/C powder (active material) with Super C65 and the sodium carboxymethyl cellulose (NaCMC) binder with a mass ratio of 80![[thin space (1/6-em)]](https://www.rsc.org/images/entities/char_2009.gif) :
:![[thin space (1/6-em)]](https://www.rsc.org/images/entities/char_2009.gif) 10
10![[thin space (1/6-em)]](https://www.rsc.org/images/entities/char_2009.gif) :
:![[thin space (1/6-em)]](https://www.rsc.org/images/entities/char_2009.gif) 10 in a mixture of water
10 in a mixture of water![[thin space (1/6-em)]](https://www.rsc.org/images/entities/char_2009.gif) :
:![[thin space (1/6-em)]](https://www.rsc.org/images/entities/char_2009.gif) ethanol 70
ethanol 70![[thin space (1/6-em)]](https://www.rsc.org/images/entities/char_2009.gif) :
:![[thin space (1/6-em)]](https://www.rsc.org/images/entities/char_2009.gif) 30 to form a homogeneous slurry. The slurry was then coated on Al foil using the Doctor Blade technique and dried overnight at room temperature. The typical mass loading of the electrodes is ca. 1.5–1.7 mg cm−2. Discs of 12 mm diameter were cut and further dried under vacuum at 80 °C overnight prior to cell assembly. A glass fiber (Whatman® glass microfiber filters, Grade A, ∅ 13 mm) was used as the separator soaked in 1 M NaPF6 in diethyleneglycol dimethyl ether (DEGDME) and Na foil was used as the counter electrode. The solvent was chosen due to two factors: (1) enhanced performance observed in Na-ion batteries31 and (2) glyme-based solvents are commonly used in Na–O2 batteries.6
30 to form a homogeneous slurry. The slurry was then coated on Al foil using the Doctor Blade technique and dried overnight at room temperature. The typical mass loading of the electrodes is ca. 1.5–1.7 mg cm−2. Discs of 12 mm diameter were cut and further dried under vacuum at 80 °C overnight prior to cell assembly. A glass fiber (Whatman® glass microfiber filters, Grade A, ∅ 13 mm) was used as the separator soaked in 1 M NaPF6 in diethyleneglycol dimethyl ether (DEGDME) and Na foil was used as the counter electrode. The solvent was chosen due to two factors: (1) enhanced performance observed in Na-ion batteries31 and (2) glyme-based solvents are commonly used in Na–O2 batteries.6
Na-ion half-cell electrochemical performance was studied by galvanostatic charge/discharge in two voltage windows, 1.5–0.005 V and 1.5–0.05 V at 100 mA h g−1 with a BioLogic VMP3 multichannel potentiostat.
2.3. Presodiation of a Na-ion half-cell, Na–O2 cell fabrication and electrochemical tests
Prior to Na–O2 cell assembly, Sn4P3/C electrodes were presodiated in Na-ion half-cells by galvanostatic charging in a potential range of 1.5–0.005 V vs. Na+/Na at a current density of 100 mA g−1 using a VMP-3 potentiostat. Na–O2 cells were constructed using this presodiated anode and a commercial gas diffusion layer (GDL, Freudenberg H23C6 type from Quintech) as the positive electrode. GDL electrodes were punched into 12 mm discs (1.13 cm2), dried overnight under vacuum at 100 °C and stored in an Ar-filled glove box without exposure to air.As the negative electrode, either Na foil or the above described Sn4P3/C electrodes were combined to GDL positive electrodes. The glass fiber (Whatman® glass microfiber filters, Grade A, ∅ 13 mm) was used in the Na–O2 full cells as the separator soaked in 1 M NaPF6 in DEGDME. Sodium hexafluorophosphate (NaPF6, 98%, Sigma-Aldrich) was dried under vacuum at 120 °C for 24 h. DEGDME (anhydrous, 99.5% Sigma-Aldrich) was dried over molecular sieves (3 Å) for 1 week. The electrolyte solution was prepared by mixing the NaPF6 salt with DEGDME in the Ar-filled glove box (H2O < 0.1 ppm, O2 < 0.1 ppm, Jacomex, France). The final water content of the electrolyte was determined by using a C20 Karl Fischer coulometer (Mettler Toledo) and was below 20 ppm. The assembled cells were pressurized with pure oxygen (99.9999% (Nippon gases) containing less than 0.5 ppm water) to ≈1 atm with a resting period of 8 h at open circuit voltage (≈2.2–2.3 V vs. Na+/Na).
The Na–O2 battery performance was assessed by galvanostatic charge/discharge tests on a BioLogic VMP-3 potentiostat, in a 1.5–3.2 V vs. Na+/Na potential range at a current of 65 μA and charge limitation of 0.25 mA h cm−2. Electrochemical impedance spectroscopy (EIS) was conducted on the same potentiostat at room temperature on 3-electrode cells with a piece of metallic sodium as the reference electrode. Six EIS spectra were recorded during each charge and discharge test of the Na–O2 full cells at intervals of 3 h, equivalent to 0.174 mA h cm−2, in a frequency range from 0.1 MHz to 50 mHz with an AC signal amplitude of 10 mV. Impedance spectra were analyzed using Scribner Associates' Zview software.
2.4. Post-mortem characterization of electrodes
Immediately after the electrochemical tests, the electrodes were extracted from the cell and washed with dry DME to remove the salt deposits. X-ray diffraction measurements on discharged electrodes were performed using a Bruker D8 Discover diffractometer with a θ/2θ Bragg–Brentano geometry (monochromatic Cu radiation: Kα1 = 1.54056 Å) within the 2θ range of 30–60° with an air-tight sample holder (in-house made). Raman spectra of the anodes after stability tests were recorded with a Renishaw spectrometer (Nanonics Multiview 2000) by focusing with a 50× long working distance objective and operating at a laser excitation wavelength of 532 nm. The spectra were obtained by performing 10 acquisitions with 10 seconds of dwell time using a power beam of 1%. A silicon wafer was used for calibration of the equipment.Morphological characterization of the discharged and cycled electrodes was conducted by Scanning Electron Microscopy (SEM) using a FEI Quanta 250 microscope operated at 20 kV. The electrodes were transferred from the Ar-filled glove box to the SEM using an air-tight holder to avoid air exposure.
3. Results and discussion
3.1. Synthesis and physicochemical characterization of the alloy negative electrode material
After each synthesis, the crystalline structure of the powders was analyzed by X-ray diffraction (Fig. 1). The crystalline structure observed in all cases corresponds to the hexagonal R![[3 with combining macron]](https://www.rsc.org/images/entities/char_0033_0304.gif) m structure reported31 for Sn4P3 (see an example using synthesis A on Fig. S1†). Le Bail refinement confirmed the absence of detectable impurities in all samples. Cell parameters, together with the figures of merit of performed refinements are shown in Table S1.†
m structure reported31 for Sn4P3 (see an example using synthesis A on Fig. S1†). Le Bail refinement confirmed the absence of detectable impurities in all samples. Cell parameters, together with the figures of merit of performed refinements are shown in Table S1.†
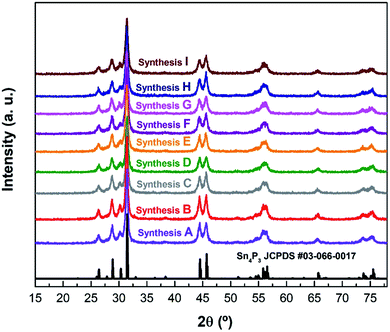 | ||
| Fig. 1 The XRD patterns of the different syntheses of Sn4P3/C samples listed in Table 1 along with the reference pattern of Sn4P3 (JCPDS #03-066-0017). | ||
The powder morphology of all samples was examined by scanning electron microscopy. Fig. S2–S10† show images at different magnifications of the powders obtained from syntheses A to I, respectively, with most representative characteristics observed. Compared to the original synthesis method (synthesis A), samples C, D and G exhibited larger particles. These syntheses had a ball to powder ratio of 1![[thin space (1/6-em)]](https://www.rsc.org/images/entities/char_2009.gif) :
:![[thin space (1/6-em)]](https://www.rsc.org/images/entities/char_2009.gif) 30 in common, which seems to be unfavorable. Samples B, E and F consisted of a mixture of large and small aggregated particles. The morphology of sample B is very similar to the original sample A, only with an increased milling time of 8 h. However, in the case of samples E and F, with the same powder to ball ratio but a smaller ball size, the powder consisted of smaller particles than the original synthesis but packed in large agglomerates.
30 in common, which seems to be unfavorable. Samples B, E and F consisted of a mixture of large and small aggregated particles. The morphology of sample B is very similar to the original sample A, only with an increased milling time of 8 h. However, in the case of samples E and F, with the same powder to ball ratio but a smaller ball size, the powder consisted of smaller particles than the original synthesis but packed in large agglomerates.
Only syntheses H and I exhibited less aggregates and primary particles of a similar or smaller size compared to the original synthesis. In addition, synthesis H was performed in a total milling time of 6 h, and 8 h in the case of synthesis I. Comparing syntheses E and H, the main difference is the milling step time, which is reduced from 30 minutes in synthesis E to 15 minutes for synthesis H. In this regard, sample H was selected to be compared to the original sample A in this study as (1) the apparent size and the agglomeration of the particles are the lowest34–36 and (2) it was obtained under the most effective synthesis conditions (optimum ball to powder ratio, milling step time and total milling time).
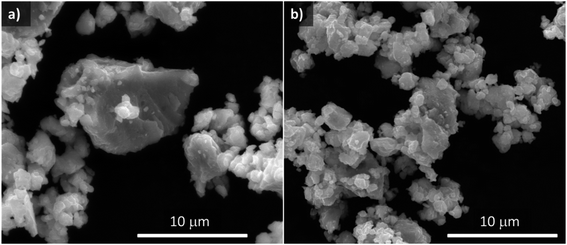
Fig. 2 shows SEM images comparing morphologies of the original sample (synthesis A) and the material selected in this work to be used as the negative electrode for Na–O2 batteries (synthesis H) after the carbon coating process (Sn4P3/C). Sn4P3/C powder obtained from carbon coated synthesis H consists of a homogeneous mixture consisting of particles of around 1 μm, slightly agglomerated in secondary particles of a few micrometers. The particle size distribution of the two carbon coated materials was analyzed, resulting in a D90 of 12.0 ± 0.8 and 10.3 ± 0.9 μm for samples A and H, respectively. From here on, samples A and H will refer to the carbon-coated materials.
Fig. S11† shows a representative TEM image of the carbon coating resulting from the second milling step with Super C65, which had a variable thickness of up to a few tenths of nanometers. Elemental analysis measurements confirmed that the samples contained around 6 wt% C.
3.2. Electrochemical characterization of Sn4P3/C alloy in a Na-ion battery
Before their use as negative electrodes in Na–O2 batteries, the cycling properties of Sn4P3/C were explored in Na half-cells using Na metal in order to study the capacity and voltage limitations to be applied in Na–O2 batteries. The performance of sample H as the negative electrode in Na-ion batteries was compared with that of the original material A in order to select the best material as the Na–O2 battery anode. Fig. 3a shows a comparison of the specific charge obtained from cycling of the alloy negative electrode at a current density of 100 mA g−1 in the 1.5 V to 5 mV vs. Na+/Na voltage window. The original sample A delivers an initial specific charge of 1000 mA h g−1 during sodiation and 900 mA h g−1 reversible charge during first desodiation. As expected according to the lower agglomeration, sample H obtained from the improved synthesis delivers higher specific charge, reaching almost 980 mA h g−1 reversible charge in the first cycle.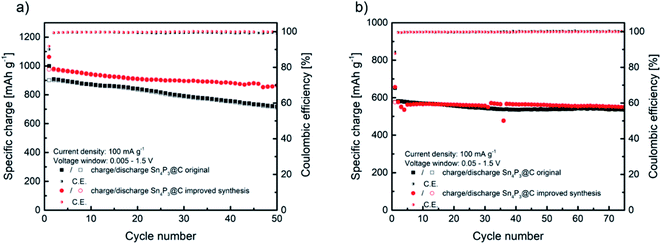 | ||
| Fig. 3 Comparison of cycling behaviors of Sn4P3/C samples A and H at 100 mA g−1 at two different voltage windows of 1.5–0.005 V (a) and 1.5–0.05 V (b). | ||
Recently, Adelhelm and coworkers have proposed the reaction mechanism of this alloy, explaining its complex electrochemical behavior.37 By means of in situ XRD measurements, the first irreversible conversion reaction occurring throughout the first sodiation stage is observed as the following:
| Sn4P3 + 24Na+ + 24e− → Na15Sn4 + 3Na3P | (1) |
Subsequently, during the sodiation/desodiation cycles, the following reversible processes are suggested:
| Na3P ↔ P + 3Na+ + 3e− | (2) |
| Na15Sn4 ↔ 4Sn + 15Na+ + 15e− | (3) |
The recent papers published by Knibbe and coworkers agree with this reaction mechanism of 24e− and a theoretical specific charge of 1132 mA h g−1.32,33 As observed in Fig. 3a, the improved synthesis H reached a high specific charge in the first cycles, closer to the theoretical value. Moreover, the improved sample H maintained 88.6% of the initial charge after 50 cycles, whilst the original material A maintained 78.9%. Coulombic efficiency was similar, reaching 90.1% initial efficiency and 99.3% average in the following cycles for sample A and, in the case of sample H, 92% in the first cycle and 99.5% afterwards. The high coulombic efficiency observed, especially in the first cycle, is favored by the use of glyme based electrolytes.31,38 The better electrochemical performance could be ascribed to the slightly lower particle size and the less agglomeration observed in sample H. Compared to the recently reported results in the literature, the electrochemical performance described in this work is very similar in terms of the specific charge and retention after 50 cycles to that reported by Zhang et al. for a micron-sized Sn4P3/C anode prepared by ball milling, and also using diglyme as the electrolyte solvent, whilst our material exhibits higher first cycle coulombic efficiency.39 Palaniselvam et al. prepared Sn4P3 material by ball milling which delivered a similar specific charge in the first cycle at lower current density.37 Other studies concluded that the use of carbonate-based electrolytes underperformed in terms of the specific charge, first cycle coulombic efficiency and capacity retention after 50 cycles compared to our work.40,41
As will be described later, in order to enhance Na–O2 cell rechargeability, the operation of Na–O2 batteries is generally limited by areal or mass capacity. When using Sn4P3/C negative electrode, limiting their specific charge might suppose working in a reduced voltage window, especially at a low capacity cut-off. Therefore, these anodes were cycled in a reduced voltage window (1.5 V to 50 mV vs. Na+/Na) to further study their performance. Fig. 3b shows the cycling properties of both Sn4P3 based electrodes, samples A and H, which exhibit a similar specific charge of over 70 cycles, around 580 mA h g−1 initially and maintaining 535 and 550 mA h g−1, respectively. In both cases the coulombic efficiency was 89% in the first cycle and higher than 99.5% in the following cycles. It is obvious that limiting the voltage window results in partial loss of the large specific charge as observed in Fig. 3a, however cycling stability is greatly improved. Fig. S12† displays the galvanostatic curves of the five initial cycles of sample A as an example, cycled with 5 mV cut-off, which shows the typical first cycle irreversible charge loss and very reproducible voltage profile from the second cycle. As observed from the curves, limiting the voltage to 50 mV eliminates the lower plateau of ca. 300 mA h g−1 by suppressing the sodiation of Sn completely. The higher sodium content tin alloys, such as Na9Sn4 or Na15Sn4, are responsible for most of the volume changes, therefore limiting their formation would lead to improved cyclability.42,43 It is clear from Fig. 3b that there is still a synergistic effect between any sodium–tin alloy formed with lower sodium content than Na15Sn4 and Na3P, leading to the stable cycling behavior as observed. According to Y. Zhu et al.,44 cycling Sn containing alloy-type anodes below 0.62 V vs. Na+/Na avoids the high-strain transition between Na3Sn and Sn, which, as seen in Section 3.6 (Fig. 7), also applies in our case where the alloy is used as the anode in Na–O2 batteries. In summary, according to its overall better electrochemical performance and, especially, its higher coulombic efficiency regardless of the voltage window, Sn4P3 obtained by H synthesis was selected to prepare negative electrodes for the Na–O2 full cell studies.
3.3. Chemical stability of metallic Na and Sn4P3 alloy as negative electrodes in Na–O2 cells
A critical factor in the development of a novel negative electrode is its stability along with the electrolyte. The chemical stability of sodiated Sn4P3, and metallic sodium for comparison, was tested through a straightforward experiment. Na–O2 cells were assembled in a three-electrode setup using either metallic sodium or the pre-sodiated alloy anode and a standard GDL cathode, following the procedures described in the Experimental section, and left to rest for 24 h. The open circuit voltage (OCV) of the metallic sodium counter electrode remained stable at around 0 V vs. Na+/Na during the experiment. In contrast, OCV of the freshly sodiated alloy showed an initial potential of ca. 50–60 mV vs. Na+/Na and after 24 h were relaxed to about 100–150 mV.This behavior has also been observed in Na ion half-cells, without the presence of oxygen, and it could be ascribed to the mixed potential of sodiated products of Sn4P3/C, Na3P and the Na–Sn alloys.42,45,46
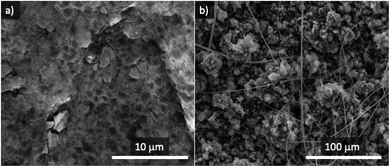
After the resting period, both anodes were recovered and observed under the SEM microscope. Fig. 4a shows a SEM image of the surface of the metallic Na anode after the stability experiment, revealing the presence of an incipient SEI surface film from electrolyte decomposition, even though no electrochemical reaction took place. The combination of metallic sodium and 1 M NaPF6 in the DEGDME electrolyte is known to result in a thin and dense SEI film, much more homogeneous than in the case of other electrolytes based in mixtures of other sodium salts and organic carbonates.47
No cubic-shaped products (evidence of the formation of NaO2) were found on the surface of metallic Na after 24 h resting in an oxygen atmosphere. The rough morphology of Sn4P3/C alloy makes it challenging to discern if a SEI was formed in contact with the electrolyte but, similar to metallic sodium, the surface of sodiated tin phosphide (Fig. 4b) does not show any evidence of NaO2 cubes formed by the chemical reaction with oxygen without electrical current.
A similar study on the chemical stability of the NaxC anode in Na–O2 cells was reported by Bender et al., where the evolution of the OCV in the presence of oxygen after 75 h was recorded, followed by ex situ XRD.24 They provided evidence of NaO2 formation on the sodiated carbon anode, not only indicating that the sodium ions stored at very low potentials are chemically unstable but also, and most important, that dissolved oxygen is able to chemically react directly at the anode surface without the need of an electrochemical reaction. Contrary to Bender's work, here we demonstrate that both metallic sodium and the sodiated alloy are chemically stable against oxygen dissolved in the electrolyte at OCV. Fig. S13† shows the Raman spectra for the positive and negative electrodes after the stability tests, which show no formation of the NaO2 discharge product. Such discrepancies might be ascribed to the different physicochemical properties of the studied anodes, which can modify the interaction of Na+ ions with their surface. Thus, Na+ ions will interact by (i) alloying processes with Sn4P3 alloy, (ii) insertion in the case of turbostratic carbon materials – such as carbon nanofibers in the GDL or the C65 carbon coating on the alloy – and (iii) electrostatic forces in the case of metallic sodium.
Among all the mentioned interactions, alloying is the strongest and, consequently, the Na+ ions stored in the alloy will be more stable than those stored in carbon based or metallic anodes against the chemical reaction with O2. It is worth mentioning that Sn4P3 alloy is coated with C65 carbon but, Na+ ions are known to insert better in low structural order carbons such as the bare carbon nanofibers used in Bender's study on the GDL (Freudenberg H2315). It can be therefore concluded that the formation of NaO2 by the chemical reaction (not electrochemical) on the surface of a given anode is subordinated to a highly disordered surface which might interact weakly with Na+ ions.48
3.4. Discharge behavior of metallic Na and Sn4P3 alloy as negative electrodes in Na–O2 cells
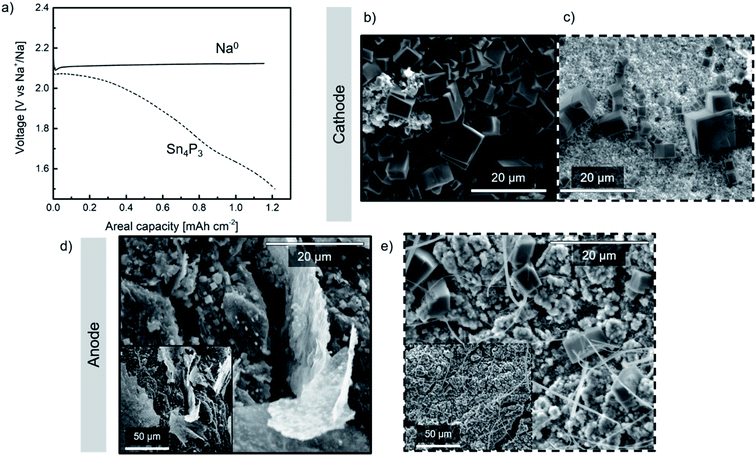
Na–O2 cells were assembled using a commercial GDL cathode and either metallic Na or Sn4P3/C alloy anode (hereinafter denoted as Na//GDL and Sn4P3/C//GDL, respectively). Galvanostatic discharge tests at a fixed capacity (20 h; ∼1.2 mA h cm−2) were conducted for each cell at 65 μA current density (Fig. 5a) in order to evaluate the discharge capacity and the stability of the anodes against oxygen or radical species formed during Na–O2 cell operation. The capacity limit was set for both types of cells considering the anode with lowest theoretical capacity, i.e., the alloy. Taking into account the active mass of the alloy, its maximum practical capacity values correspond to areal capacities between 1.4 and 1.5 mA h cm−2. In addition, these values are much higher than the capacity limit set in the cycling performance study of the Na–O2 full cells (0.25 mA h cm−2) as will be discussed later in Section 3.5.A single flat plateau of ∼ 2.1 V is observed for the Na//GDL cell which is in good agreement with those observed in glyme-based electrolytes.6 The voltage profile observed in Sn4P3/C//GDL cell, however, is not as flat as that typically described in the literature due to the contribution of the negative electrode (whose voltage profile can be observed in Fig. S12†) to the total cell voltage. Once discharged, the cells were opened in the Ar-filled glove box and the electrodes were carefully washed with DME, dried for 24 h and transferred in sealed sample holders for SEM and XRD analyses.
SEM images of the GDL cathodes after discharge are shown in Fig. 5b and c. Both cathodes show the formation of NaO2 in the form of several micrometer sized cubes covering the GDL surface which is in good agreement with those reported for these systems.6 The presence of NaO2 was confirmed by the XRD peaks at ca. 32.5° and 47°, corresponding to the (200) and (220) planes, respectively (marked with asterisks as shown in Fig. S14a†).
Regarding the anode, Fig. 5d shows the surface of the discharged metallic sodium negative electrode. In addition to thick deposits which most likely originated from electrolyte decomposition, a large number of cubes (∼1 μm size) were found. Oxygen crossover has been previously reported in the literature,18,49–51 however, to the best of our knowledge no evidence of NaO2 formation on the Na0 anode surface has been previously reported. The smaller size of the NaO2 cubes observed on the surface of both anodes, compared to those found on the cathodes, could be due to the low O2 concentration obtained at the surface of the anode which might lead to limited growth of the NaO2 cubes.52 Post-mortem SEM and XRD analyses performed on the alloy (Fig. 5e and S14b,† respectively) revealed the presence of NaO2 cubes of different sizes, being larger and fewer than those found in the metallic Na anode. Compared to metallic sodium, the alloy anode would present more inhomogeneous distribution of Na+ reservoirs, together with a relatively lower electrical conductivity (30.7 S cm−1vs. 2.1 × 10⁵ S cm−1). Therefore, in the scenario of oxygen crossover, cells containing the alloy anode could develop a chemical reaction between oxygen and active sites or Na+ reservoirs, inducing nucleation of few NaO2 cubes, their migration to the surface and consequent growth. In the case of metallic Na, nucleation points would be more homogeneously distributed which, together with faster kinetics, lead to a higher number of NaO2 cubes on the surface but smaller in size.
In the light of these findings, the conclusion is that whilst most of Na+ ions coming from the anode, reactions (4) or (5) for Na//GDL and Sn4P3/C//GDL, are used in the electrochemical reaction (6), some of them are consumed in a chemical reaction at the very surface of the anode, reaction (7), withdrawing Na+ from cell's inventory.
| (Na15Sn4 + 3Na3P)sodiated anode → am-Sn4P3 + 24Na+ + 24e− | (4) |
| Na → Na+ + e− | (5) |
| O2− + Na+ (at the cathode surface) → NaO2 | (6) |
| O2− + Na+ (at sodiated anode) → NaO2 | (7) |
In the case of Na//GDL cells, the source of Na ions is almost infinite, however, the amount of Na ions in Sn4P3/C//GDL cells is limited. The presence of side reactions would probably lead to lower coulombic efficiency, causing progressive sodium depletion and the consequent capacity fading. In order to test the potential effects of Na+ inventory loss on long term operation, the studied Na//GDL and Sn4P3/C//GDL cells were cycled until cell failure.
3.5. Cycling behavior of the alloy anode vs. metallic Na anode in Na–O2 full cells
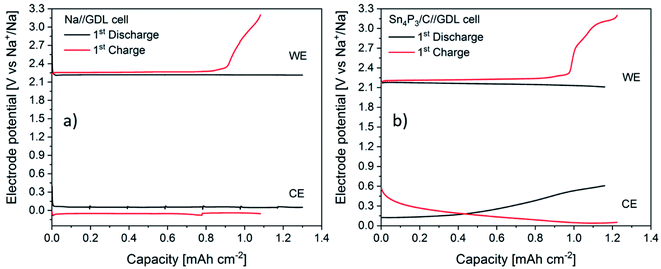
The cycling performance of Na//GDL and Sn4P3/C//GDL full cells was examined by galvanostatic charge/discharge in the 1.5 to 3.2 V (vs. Na+/Na) voltage window, with a discharge capacity limited to 0.25 mA h cm−2 (Fig. 6). The Na//GDL cell (Fig. 6a) maintained the maximum discharge capacity for 75 cycles, showing a coulombic efficiency of around 90% during the whole cycle life. Concerning the Sn4P3/C//GDL full cell, it delivered 24 cycles (with no capacity fading) with a coulombic efficiency close to 85% for the initial cycles and 90% before cell failure (Fig. 6b).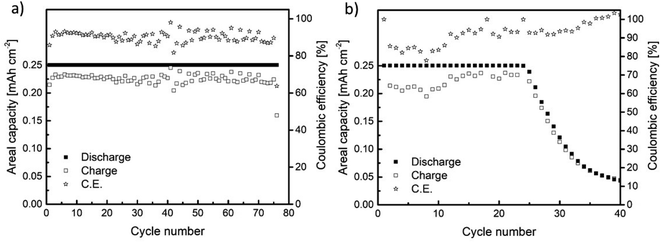 | ||
| Fig. 6 Galvanostatic charge/discharge results for the cells assembled using (a) metallic Na (Na//GDL) and (b) Sn4P3 (Sn4P3/C//GDL) negative electrodes. | ||
Even though the cycling performance of Sn4P3/C//GDL full cell is lower than that of the Na//GDL cell based on the Na-metal anode, this work reports the feasibility of using Sn4P3 alloys as an alternative to metallic sodium anodes as (i) the state-of-art alternatives to metallic anodes in Na–O2 batteries can be scarcely found and (ii) the cyclability and efficiency values reported here outperforms those in the existing few studies. For instance, Dilimon et al.25 tested sodiated Sb as the anode, cycling to deep discharge mode at 264 μm cm−2 and using different electrolytes. The use of 0.1 M NaSO3CF3 DMSO as compared to other electrolyte formulations delivered the best cycling performance (10 cycles). Nevertheless, the capacity retention presented a serious decay, decreasing readily from 0.19 to 0.12 mA h cm−2 from the first cycle to the second and eventually to 0.03 mA h cm−2 at the 10th cycle. In addition, the cell overpotential reached values as high as 1.5 V at 50% depth of discharge. The use of 0.1 M NaPF6 DMSO and 0.1 M NaSO3CF3 DMSO electrolyte led to poorer cycling performance, particularly for the NaPF6 salt.
As discussed previously, Bender et al.24 tested a sodiated commercial carbon fiber (Freudenberg H2315) as the anode by cycling in 0.5 M NaSO3CF3 DEGDME to deep discharge. The full cell released 40 cycles at 200 mA cm−2 with an average overpotential of 150 mV and a discharge capacity of 1.15 mA h cm−2 in the first cycle. As the sodiated Sn full cell in Dilimon's work, the capacity decreases substantially to 0.22 mA h cm−2 at the 25th cycle. One possible explanation for the short life observed in Sn4P3/C//GDL full cell is that the amount of sodium ions available in the cell is limited, as anticipated in the discharge experiments where the discharge plateau of Sn4P3/C//GDL cell is very sloppy as compared with that of Na//GDL (Fig. 5a). This limited availability of ions is even more critical as the oxygen crossover is verified (Fig. 5e). Hence, the consumption of Na+ in the alloy by O2 (or reactive oxygen species such as superoxide radical or peroxide) for the formation of oxide-like side products may cause Na depletion and premature cell failure when using the sodiated Sn4P3 alloy as the anode. In fact, Dilimon et al. attributed the better cycling performance of the NaSO3CF3/DMSO mixture to the high donor number of DMSO which stabilizes O2− anions avoiding the crossover to the anode.25 This hypothesis is supported when comparing the performance of Sn4P3/C anode in the absence (Na-ion cell, Fig. 3) and in the presence (Na–O2 cell, Fig. 6b) of O2. Besides oxygen crossover, it is also important to note that the sodiation/desodiation of an alloy is kinetically less favorable than the plating–stripping in a metal. According to Nichols et al.,52 dissolved oxygen concentration at the separator side of the cathode is low for moderate O2 pressures, as in the present case (1 atm). The low oxygen concentration near the anode surface is expected to decrease due to the chemical formation of NaO2 on the anode during the initial cycles. Upon cycling, oxygen molecules that may diffuse through the electrolyte to the anode are liable to react chemically, consuming more Na+. Thus, being the most probable cause of capacity fading for Sn4P3/C//GDL cells, side reactions due to oxygen crossover should remove Na ions from the inventory mainly during, but not limited to, the initial cycles.
3.6. Electrochemical impedance spectroscopy (EIS)
In order to shed light into the different behaviors observed, EIS studies during the first cycle of Na–O2 batteries using both Sn4P3/C alloy and metallic Na were performed. The experiments, carried out in three electrode cells, consisted of 1 full cycle (discharge + charge) at a constant current and were performed by measuring impedance at different depths of discharge/charge. Galvanostatic curves for both positive and negative electrodes of Na//GDL and Sn4P3/C//GDL cells are shown in Fig. 7. The discharge time of the Na//GDL cell was limited to match the discharge time of Sn4P3/C//GDL cell to compare the behaviors of both cells and perform EIS measurements after the same time and capacity.The Na//GDL cell (Fig. 7a) shows the characteristic flat discharge and charge curves of the cathode (air electrode), whilst the Na anode stays in a potential close to 0 V against the reference electrode, which is also metallic sodium. In the case of Sn4P3/C//GDL cell, the positive electrode exhibits a similar behavior as in the Na//GDL cell, only with a slight potential decrease at the end of the discharge, probably due to the consumption of Na ion reservoir in the alloy anode. Regarding the anode, Sn4P3/C electrode shows a starting potential of ca. 140 mV as a result of the mixed potential of sodiated products discussed in Section 3.3. Potential limits and charge/discharge profiles are as expected for this material, similar to those observed when used as the negative electrode in Na-ion cells and are shown in Fig. S12.†
There are two facts worth mentioning, both related to the shape and potential of sodium anode curves. First, metallic sodium (Fig. 7a) shows potential jumps after each EIS measurement, from ca. 0.05 V down to 0.02 and then up to 0.07 V, whilst neither Sn4P3/C anode (Fig. 7b) nor the positive electrodes show such potential variations or shifts after EIS. This is indicative of the unstable surface chemistry of the metallic sodium anode. Second, metallic Na potential during charge stays around 40 to 70 mV negative. Any increase of current density or resistance due to surface reactions could cause further shifts to negative potentials and increase the risk of sodium dendrite formation. EIS spectra of metallic Na and Sn4P3/C in Na–O2 cells measured vs. Na reference electrode were recorded before the measurement at open circuit voltage (OCV), at six points every 3 hours and at the end of discharge and charge steps (Fig. 8a–d). Spectra were recorded at each voltage without relaxation time. The total step time was ca. 21 h and the areal capacity at which each EIS spectrum was recorded can be calculated using eqn (8):
| Qareal = I × t/A | (8) |
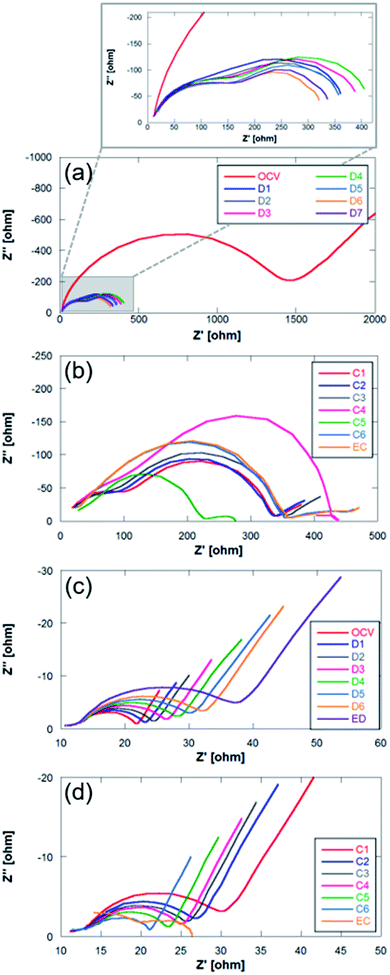 | ||
| Fig. 8 Nyquist plots for (a and b) Na metal and (c and d) Sn4P3/C negative electrodes. C: charge; EC: end of charge; D: discharge; ED: end of discharge. | ||
The impedance diagrams of these types of batteries usually present two semicircles with different degrees of overlap that are associated with two contributions: (1) at high frequencies due to the solid electrolyte interphase (SEI), and (2) at high–medium frequencies usually assigned to charge transfer processes.33,53,54 The two negative electrodes studied in this work confirm this interpretation. The comparison of Nyquist plots in both systems (Na metal and Sn4P3/C) presents clear differences. The main one is ascribed to the difference in the magnitude of the resistances associated with each of the electrodes. In the case of Na metal, these total resistances are even more than one order of magnitude greater (101 vs. 102 ohm). Unlike the alloy negative electrode, the OCV spectrum of the metallic Na anode (Fig. 8b) shows a very large charge transfer resistance (around ∼1500 vs. ∼22 ohm), a large semicircle which is ascribed to the charge transfer at the interface, and a diffusion tail at low frequencies. The following spectrum, recorded during the electrochemical operation of the cell, shows two semicircles where no-diffusion tail is observed at low frequencies. This behavior together with the high resistances has already been described for sodium systems.55 The high frequency semicircle is associated to interfacial phenomena, whilst the lower frequency semicircle can be due to charge transfer. During discharge, the impedance of the metallic Na anode shows very little variation in the interfacial resistance. However, the charge transfer resistance shows different behavior. It increases slightly during the first steps of the discharge, and decreases at the end. It also exhibits a similar behavior during the charge process. This behavior was previously observed and is shown in Fig. 7a where sodium metal shows noticeable potential variation, in contrast to the alloy anode (Fig. 7b). Such unstable potential together with the erratic charge transference behavior verified and shown in Fig. 8a indicates the occurrence of uncontrollable reactions on the surface of highly reactive alkali metals. This fact therefore highlights the importance of replacing sodium metal by alternative anodes in order to manufacture reproducible and stable Na–O2 battery devices.
In the analysis of Nyquist plots of Sn4P3/C electrode, at the high frequency region, a small depressed semicircle ascribed to SEI formation can be observed. A larger semicircle corresponding to charge transfer phenomena appears at high–medium frequencies and a diffusion tail can be clearly observed at the low frequency region. The high frequency semicircle shows very little variation during discharge and charge processes, indicating good SEI stability. In addition, the SEI contribution is very small compared to that of the high–medium frequency region processes. The charge transfer semicircle, in contrast, evolves according to the Na ion content in the anode. At the beginning, the OCV spectrum shows a charge transfer resistance of 8.36 ohm, increasing up to 24.48 ohm as discharge evolves and Na content and conductivity decrease. During the charge process, the charge transfer resistance decreases as the Na content increases again. Throughout the charging process the sodium cations return to the anode where they are alloyed with P (and occasionally with Sn). The transformation of P into Na3P causes an expansion in the volume that can facilitate the transfer of charge due to a better contact between the electrode particles.46 The diffusion tail, although it does not show the typical −45° slope of Warburg diffusion, remains at a constant angle during discharge and charge processes, indicating that Na+ diffusion is not hindered during the first cycle even if NaO2 is deposited on the anode surface. The deviation from the ideal behavior of the diffusion tail is usually related to changes in the solid-state reaction barrier or changes in the porosity of the electrode.56
From the analysis of the impedance spectra, it is possible to conclude that Sn4P3/C alloy has lower resistances both at the interface (SEI) and during the charge transfer process, so the alloy might be a better candidate as a negative electrode. In any case, this first cycle usually presents a different behavior from the rest of the cycles, since the formation and stabilization of the SEI occurs during the first discharge/charge reactions. For this reason, it is necessary to investigate how these resistances evolve throughout cycling. The first ten discharge/charge cycles in Sn4P3/C//GDL system were analyzed in a 3-electrode cell, recording impedance data every 3 hours and at the end of the charge and discharge processes. The galvanostatic profile of the cycling is presented in Fig. S15.†
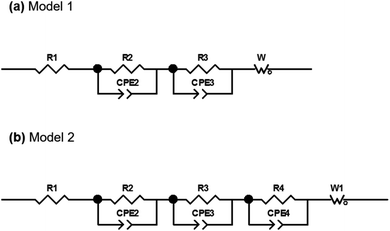
The EIS plots consist of two overlapping semicircles in the high and medium frequency regions followed by a straight line with an angle slightly higher than 45° at lower frequencies. This angle deviation is typical in alloy electrodes due to structural changes that take place during discharge and charge processes.56 The spectra obtained were then fitted with the proposed equivalent circuit models presented in Fig. 9 based on the Randles circuit.
In both models, first, there is an element (R1) that refers to the ohmic resistance and bulk resistance of the cell, including losses due to contacts, electrolyte, separator, etc. Second, in order to unravel the first contribution at high frequencies, a set of parallel R2-CPE2 elements (CPE: constant phase element) is proposed to simulate the resistance and capacitance of the SEI layer, respectively. The contribution to high-to-medium frequencies is also modeled by means of parallel R3-CPE3 elements, which in this case are assigned to the resistance due to the transfer of charge at the electrode and the double layer capacitance at the electrode–electrolyte interface, respectively. Both semicircles have been simulated by including CPE elements instead of C (capacitors). Normally, the charge accumulated at the solid/liquid interfaces is modeled using capacitors, but when the system deviates and presents non-idealities such as inhomogeneities or surface roughness, the capacitance is no longer ideal, being necessary to use CPE elements to fit the spectra.56 Finally, the processes at low frequencies have been modeled with Warburg elements that represent the diffusion processes of mobile charges in the electrode. The elements described are the components of model 1 that was used to mainly simulate the first spectra obtained within the first cycle. At the end of the charge process of the first cycle, it was deemed necessary to include a third R4-CPE4 combination in parallel due to the appearance of a small shoulder in the semicircle of the medium-frequency region.
Fig. 10 shows the Nyquist and Bode diagrams obtained at two different points of the cycle, together with their fittings using the two proposed models. Based on the accuracy of the fitted impedance spectra, the most suitable equivalent circuit model was determined (the value of χ2 in all fittings has been kept below 2 × 10⁻⁴). As can be seen, the inclusion of the R4-CPE4 combination improves the fit. The presence of this new resistance has already been observed by other authors.57–60 It is associated with the bulk impedance of the electrode, which is related to the resistance due to the flux inside the active particles, the resistance to the flux of ions through the pores due to the electrolyte trapped in the pores of the composite electrode and even due to the appearance of a non-homogeneous coating. The time constants of this new process and those of the charge transfer are similar,61 so they have a large overlap, and this shoulder is not always observable or separable. Due to this large overlap, it is very difficult to establish exactly the resistances associated with each contribution. Therefore, in the analysis of the evolution of the resistances in the processes, both resistances (R3 and R4) have been analyzed together.
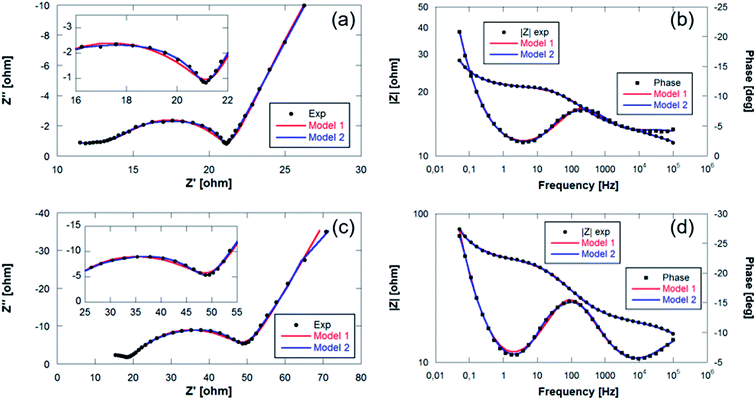 | ||
| Fig. 10 Bode and Nyquist plots with fitting values collected at (a and b) final charge step of the 1st cycle and (c and d) start of the discharge of the 6th cycle of Sn4P3/C//GDL cell. | ||
Fig. 11 shows the results obtained from the fitting of the evolution of the different resistances throughout the first 10 cycles. The ohmic resistance (R1) is maintained as practically constant throughout the experiment with resistances of around 10 ohm, which confirms the stability of the measurement. The following observable process at high frequencies (R2) assigned to the SEI is observable when the resistance of this film at the electrode/electrolyte interface is significant. In this sense, it can be observed that in the first cycle this contribution has lower resistances of about 4–5 ohm. At the beginning of the second cycle, this resistance increases to 14 ohms and then stabilizes at around 10 ohms in the last 4 cycles. The formation of the SEI involves the deposition at the electrode/electrolyte interface of Na-byproducts that are generated along the cycling due to the decomposition of the organic electrolyte on the surface of the negative electrode. This SEI presents electronic insulating properties although it is ionic conductive, allowing the flow of sodium cations. The stability of the R2 resistance throughout the cycling confirms the absence of dendrites that are generally observed when Na metal is used as a negative electrode. In addition, this stability may be associated with the absence of cracks in the SEI. The resistances due to charge transfer (R3) and electrode bulk (R4) are the most important contributions in the analyzed processes. The evolution of these resistances presents different behaviors during the discharge and charge processes. These contributions increase throughout discharge and decrease during charge. This behavior may be related to the deposition of NaO2 in the form of cubes throughout discharge. The passivation of metal anodes due to O2/O2− crossover from the air electrode has already been described, which eventually limits the discharge capacity of the cell.22,62 The O2/O2− species generated in the air electrode can migrate through the separator to the negative electrode due to concentration gradients in the electrolyte. The NaO2 nuclei formed in the electrolyte are deposited on the surface of the air electrode during discharge, coating its surface as shown in Fig. 5. Due to the crossover process, it is also possible that a certain number of cubes form on the surface of the negative electrode. As mentioned above, this work presents for the first time the evidence that the crossover process results in the deposition of NaO2 cubes on the surface of the negative electrode. This compound, which mainly has an insulating character, is capable of blocking the flow of charge at the electrode/electrolyte interface. Therefore, an increase in the resistance of the contributions R3 and R4 is observed throughout discharge. In the charging process, these cubes decompose electrochemically, which results in a significant decrease in resistance (R3 + R4). In any case, these cubes can be covered with a film of other carbonate-based secondary products due to the NaO2 degradation.63–65 Once the cubes decompose, the passivating film does not disappear, so these products accumulate throughout cycling. For this reason, the resistances are increasing practically constantly from cycle to cycle.
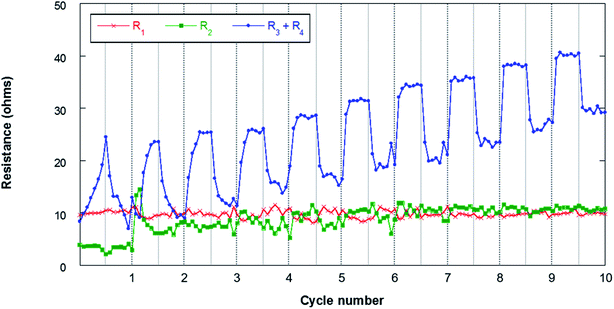 | ||
| Fig. 11 Evolution of the resistances during cycling for the Sn4P3/C//GDL cell. The lines connecting the data points are only a guide to the eye. | ||
The EIS analysis of the negative electrode, therefore, demonstrates that Na–O2 battery performance is not only affected by the air electrode, but also is dependent on the negative electrode that can alter the lifetime and stability of these promising batteries. According to the results obtained in this work, Sn4P3 alloy may emerge as a promising anode for Na–O2 batteries, providing greater stability and less surface reactivity than metallic Na, leading to the formation of more stable devices. Even so, it is important to study in depth O2/O2− crossover, in order to mitigate its effects on the electrochemical performance of the system.
4. Conclusions
Sn4P3/C composite material has been synthesized by a simple and scalable method, and evaluated as an anode material in sodium-based technologies with improved electrochemical performance in terms of specific charge and cycling stability. First, its suitability as the anode has been validated in Na-ion batteries where a capacity retention of 88.6% after 50 cycles, with a coulombic efficiency as high as 99.5% has been observed. Such good values of capacity retention and coulombic efficiency make this anode material a possible alternative to metallic sodium in Na–O2 batteries.Before validating its suitability in Na–O2 batteries, the compatibility of this alloy material against oxygen was tested and compared with that of metallic Na. No chemical reactivity was observed at OCV, demonstrating its compatibility with both the electrolyte and the oxygen environment. During Na–O2 cell operation, however, evidence of NaO2 deposition on both Na and Sn4P3/C negative electrodes have been observed due to oxygen crossover from the cathode side. In terms of cycle life, Sn4P3/C alloy anode did not overperform metallic Na due to the limited amount of sodium ion reservoir in the cell; however, EIS experiments have demonstrated better and more reliable behavior in the case of the alloy. In this sense, future experiments will be carried out to address the lack of Na+ inventory in the cell and continue improving the electrochemical response of Sn4P3/C alternative anode for Na–O2 cells. Moreover, this work points out the need to develop oxygen blocking membranes to avoid the oxygen crossover to the anode and hence increase the cyclability of Na–O2 cells by avoiding the parasitic reactions.
Conflicts of interest
There are no conflicts to declare.Acknowledgements
This work was financially supported by the Basque Government (Elkartek CICe2020, KK-2020/00078), “Ministerio de Economía y Competitividad” of Spain (under project PID2019-107468RB-C21), the “Fondo Europeo de Desarrollo Regional” (FEDER) and the Eusko Jaurlaritza/Gobierno Vasco (under project IT1226-19).References
- I. Landa-Medrano, C. Li, N. Ortiz-Vitoriano, I. Ruiz De Larramendi, J. Carrasco and T. Rojo, J. Phys. Chem. Lett., 2016, 7, 1161–1166 CrossRef CAS PubMed.
- N. Yabuuchi, K. Kubota, M. Dahbi and S. Komaba, Chem. Rev., 2014, 114, 11636–11682 CrossRef CAS.
- E. Goikolea, V. Palomares, S. Wang, I. R. de Larramendi, X. Guo, G. Wang and T. Rojo, Adv. Energy Mater., 2020, 10, 2002055 CrossRef CAS.
- B. D. McCloskey, J. M. Garcia and A. C. Luntz, J. Phys. Chem. Lett., 2014, 5, 1230–1235 CrossRef CAS.
- M. Enterría, J. L. Gómez-Urbano, J. M. Munuera, S. Villar-Rodil, D. Carriazo, J. I. Paredes and N. Ortiz-Vitoriano, Small, 2021, 17, 2005034 CrossRef PubMed.
- N. Ortiz Vitoriano, I. Ruiz de Larramendi, R. L. Sacci, I. Lozano, C. A. Bridges, O. Arcelus, M. Enterría, J. Carrasco, T. Rojo and G. M. Veith, Energy Storage Mater., 2020, 29, 235–245 CrossRef.
- M. Enterría, C. Botas, J. L. Gómez-Urbano, B. Acebedo, J. M. L. del Amo, D. Carriazo, T. Rojo and N. Ortiz-Vitoriano, J. Mater. Chem. A, 2018, 6, 20778–20787 RSC.
- J. L. G. Urbano, M. Enterría, I. Monterrubio, I. R. de Larramendi, D. Carriazo, N. O. Vitoriano and T. Rojo, ChemSusChem, 2020, 13, 1203–1225 CrossRef.
- N. Yang, S. R. Waldvogel and X. Jiang, ACS Appl. Mater. Interfaces, 2016, 8, 28357–28371 CrossRef CAS PubMed.
- P. Lou, C. Li, Z. Cui and X. Guo, J. Mater. Chem. A, 2015, 4, 241–249 RSC.
- J. Frith, I. Landa Medrano, I. Ruiz de Larramendi, T. Rojo, J. R. Owen and N. Garcia-Araez, Chem. Commun., 2017, 53, 12008–12011 RSC.
- I. Landa-Medrano, I. Ruiz de Larramendi and T. Rojo, Electrochim. Acta, 2018, 263, 102–109 CrossRef CAS.
- Z. Zhu, X. Shi, D. Zhu, L. Wang, K. Lei and F. Li, Research, 2019, 2019, 1–9 CrossRef.
- S. Zhao, C. Wang, D. Du, L. Li, S. Chou, F. Li and J. Chen, Angew. Chem., 2021, 133, 3242–3248 CrossRef.
- I. Lozano, D. Córdoba, H. B. Rodríguez, I. Landa-Medrano, N. Ortiz-Vitoriano, T. Rojo, I. R. de Larramendi and E. J. Calvo, J. Electroanal. Chem., 2020, 872, 114265 CrossRef CAS.
- I. Ruiz de Larramendi and N. Ortiz-Vitoriano, Front. Chem., 2020, 8, 605 CrossRef PubMed.
- N. Ortiz-Vitoriano, I. Monterrubio, L. Garcia-Quintana, J. M. Lopez del Amo, F. Chen, T. Rojo, P. Howlett, M. Forsyth and C. Pozo-Gonzalo, ACS Energy Lett., 2020, 5, 903–909 CrossRef CAS.
- X. Lin, Q. Sun, H. Yadegari, X. Yang, Y. Zhao, C. Wang, J. Liang, A. Koo, R. Li and X. Sun, Adv. Funct. Mater., 2018, 28, 1801904 CrossRef.
- J. J. A. Kreissl, D. Langsdorf, B. A. Tkachenko, P. R. Schreiner, J. Janek and D. Schröder, ChemSusChem, 2020, 13, 2661–2670 CrossRef CAS PubMed.
- X. Liu, X. Lei, Y. G. Wang and Y. Ding, ACS Cent. Sci., 2021, 7, 335–344 CrossRef CAS PubMed.
- L. F. Zhao, Z. Hu, W. H. Lai, Y. Tao, J. Peng, Z. C. Miao, Y. X. Wang, S. L. Chou, H. K. Liu and S. X. Dou, Adv. Energy Mater., 2021, 11, 2002704 CrossRef CAS.
- H. Yadegari and X. Sun, Trends Chem., 2020, 2, 241–253 CrossRef CAS.
- S. Zhao, B. Qin, K.-Y. Chan, C.-Y. V. Li and F. Li, Batteries Supercaps, 2019, 2, 725–742 CrossRef.
- C. L. Bender, B. Jache, P. Adelhelm and J. Janek, J. Mater. Chem. A, 2015, 3, 20633–20641 RSC.
- V. S. Dilimon, C. Hwang, Y.-G. Cho, J. Yang, H.-D. Lim, K. Kang, S. J. Kang and H.-K. Song, Sci. Rep., 2017, 7, 1–10 CrossRef CAS PubMed.
- Y. Zhang, L. Ma, L. Zhang and Z. Peng, J. Electrochem. Soc., 2016, 163, A1270–A1274 CrossRef CAS.
- S. Komaba, Chem. Lett., 2020, 49, 1507–1516 CrossRef CAS.
- J. M. Lee, G. Singh, W. Cha, S. Kim, J. Yi, S.-J. Hwang and A. Vinu, ACS Energy Lett., 2020, 5, 1939–1966 CrossRef CAS.
- Y. M. Chang, H. W. Lin, L. J. Li and H. Y. Chen, Mater. Today Adv., 2020, 6, 100054 CrossRef.
- G. Chang, Y. Zhao, L. Dong, D. P. Wilkinson, L. Zhang, Q. Shao, W. Yan, X. A. Sun and J. Zhang, J. Mater. Chem. A, 2020, 8, 4996–5048 RSC.
- J. L. Gómez-Cámer, B. Acebedo, N. Ortiz-Vitoriano, I. Monterrubio, M. Galcerán and T. Rojo, J. Mater. Chem. A, 2019, 7, 18434–18441 RSC.
- L. Ran, I. Gentle, T. Lin, B. Luo, N. Mo, M. Rana, M. Li, L. Wang and R. Knibbe, J. Power Sources, 2020, 461, 228116 CrossRef CAS.
- L. Ran, B. Luo, I. R. Gentle, T. Lin, Q. Sun, M. Li, M. M. Rana, L. Wang and R. Knibbe, ACS Nano, 2020, 14, 8826–8837 CrossRef CAS.
- J. Zhang, W. Wang and B. Li, J. Alloys Compd., 2019, 771, 204–208 CrossRef CAS.
- R. Mogensen, J. Maibach, A. J. Naylor and R. Younesi, Dalton Trans., 2018, 47, 10752–10758 RSC.
- W. Wang, J. Zhang, D. Y. W. Yu and Q. Li, J. Power Sources, 2017, 364, 420–425 CrossRef CAS.
- T. Palaniselvam, C. Mukundan, I. Hasa, A. L. Santhosha, M. Goktas, H. Moon, M. Ruttert, R. Schmuch, K. Pollok, F. Langenhorst, M. Winter, S. Passerini and P. Adelhelm, Adv. Funct. Mater., 2020, 30, 2004798 CrossRef CAS.
- X. Fan, T. Gao, C. Luo, F. Wang, J. Hu and C. Wang, Nano Energy, 2017, 38, 350–357 CrossRef CAS.
- J. Zhang, W. Wang and B. Li, Chem. Eng. J., 2020, 392, 123810 CrossRef CAS.
- T. Zeng, D. Feng, Y. Xie and X. Jiao, J. Alloys Compd., 2021, 874, 159944 CrossRef CAS.
- J. Saddique, X. Zhang, T. Wu, H. Su, S. Liu, D. Zhang, Y. Zhang and H. Yu, J. Mater. Sci. Technol., 2020, 55, 73–80 CrossRef.
- M. K. Datta, R. Epur, P. Saha, K. Kadakia, S. K. Park and P. N. Kumta, J. Power Sources, 2013, 225, 316–322 CrossRef CAS.
- J. Wei Wang, X. Hua Liu, S. X. Mao and J. Yu Huang, Nano Lett., 2012, 12, 5897–5902 CrossRef PubMed.
- Y. Zhu, Z. Qian, J. Song, W. Du, J. Pan, D. Wang and J. Yang, Nano Lett., 2021, 21, 3588–3595 CrossRef CAS PubMed.
- Y. Kim, Y. Kim, A. Choi, S. Woo, D. Mok, N.-S. Choi, Y. S. Jung, J. H. Ryu, S. M. Oh and K. T. Lee, Adv. Mater., 2014, 26, 4139–4144 CrossRef CAS PubMed.
- H. Usui, Y. Domi, R. Yamagami and H. Sakaguchi, Green Energy Environ., 2019, 4, 121–126 CrossRef.
- Z. W. Seh, J. Sun, Y. Sun and Y. Cui, ACS Cent. Sci., 2015, 1, 449–455 CrossRef CAS PubMed.
- H. Moon, M. Zarrabeitia, E. Frank, O. Böse, M. Enterría, D. Saurel, I. Hasa and S. Passerini, Batteries Supercaps, 2021, 4, 960–977 CrossRef CAS.
- K. Hu, L. Qin, S. Zhang, J. Zheng, J. Sun, Y. Ito and Y. Wu, ACS Energy Lett., 2020, 5, 1788–1793 CrossRef CAS.
- V. Esfahanian, M. T. Dalakeh and N. Aghamirzaie, Appl. Energy, 2019, 250, 1356–1365 CrossRef CAS.
- X. Lin, F. Sun, Q. Sun, S. Wang, J. Luo, C. Zhao, X. Yang, Y. Zhao, C. Wang, R. Li and X. Sun, Chem. Mater., 2019, 31, 9024–9031 CrossRef CAS.
- J. E. Nichols and B. D. McCloskey, J. Phys. Chem. C, 2017, 121, 85–96 CrossRef CAS.
- Z. Liu, J. Chen, X. Fan, Y. Pan, Y. Li, L. Ma, H. Zhai and L. Xu, J. Alloys Compd., 2021, 871, 159531 CrossRef CAS.
- W. Liu, X. Yuan and X. Yu, ACS Appl. Mater. Interfaces, 2021, 13, 12016–12024 CrossRef CAS PubMed.
- M. Hess, J. Electrochem. Soc., 2018, 165, A323 CrossRef CAS.
- G. A. Williamson, V. W. Hu, T. B. Yoo, M. Affandy, C. Opie, E. K. Paradis and V. C. Holmberg, ACS Appl. Energy Mater., 2019, 2, 6741–6750 CrossRef CAS.
- M. V. Reddy, A. G. V. Subba Rao and B. V. R. Chowdari, J. Phys. Chem. C, 2007, 111, 11712–11720 CrossRef CAS.
- M. V. Reddy, G. V. S. Rao and B. V. R. Chowdari, J. Mater. Chem., 2011, 21, 10003–10011 RSC.
- M. V. Reddy, B. L. W. Wen, K. P. Loh and B. V. R. Chowdari, ACS Appl. Mater. Interfaces, 2013, 5, 7777–7785 CrossRef CAS.
- M. V. Reddy, Y. Xu, V. Rajarajan, T. Ouyang and B. V. R. Chowdari, ACS Sustainable Chem. Eng., 2015, 3, 3035–3042 CrossRef CAS.
- Y. Fernández Pulido, C. Blanco, D. Anseán, V. M. García, F. Ferrero and M. Valledor, Measurement, 2017, 106, 1–11 CrossRef.
- X. Lin, Q. Sun, H. Yadegari, X. Yang, Y. Zhao, C. Wang, J. Liang, A. Koo, R. Li and X. Sun, Adv. Funct. Mater., 2018, 28, 1801904 CrossRef.
- I. Landa-Medrano, J. T. Frith, I. Ruiz de Larramendi, I. Lozano, N. Ortiz-Vitoriano, N. Garcia-Araez and T. Rojo, J. Power Sources, 2017, 345, 237–246 CrossRef CAS.
- I. Landa-Medrano, R. Pinedo, X. Bi, I. R. de Larramendi, L. Lezama, J. Janek, K. Amine, J. Lu and T. Rojo, ACS Appl. Mater. Interfaces, 2016, 8, 20120–20127 CrossRef CAS.
- I. Landa-Medrano, A. Sorrentino, L. Stievano, I. Ruiz de Larramendi, E. Pereiro, L. Lezama, T. Rojo and D. Tonti, Nano Energy, 2017, 37, 224–231 CrossRef CAS.
Footnotes |
| † Electronic supplementary information (ESI) available. See DOI: 10.1039/d1ta07096g |
| ‡ Present address: Dpto. Química Inorgánica e Ingeniería Química, Instituto de Química Fina y Nanoquímica IUNAN, Universidad de Córdoba, Campus Universitario de Rabanales, Edificio Marie Curie, 14071 Córdoba, Spain. |
| This journal is © The Royal Society of Chemistry 2022 |

