Molecular dynamics study of oxygen-ion diffusion in yttria-stabilized zirconia grain boundaries†
Jose Carlos
Madrid Madrid
 a,
Junko
Matsuda
b,
Kwati
Leonard
 b,
Hiroshige
Matsumoto
b and
Kulbir Kaur
Ghuman
 *a
*a
aInstitut National de la Recherche Scientifique, Centre Énergie Matériaux Télécommunications, 1650 Boul. Lionel-Boulet, Varennes J3X 1S2, Quebec, Canada. E-mail: Kulbir.Ghuman@inrs.ca
bInternational Institute for Carbon-Neutral Energy Research (I2CNER-WPI), Kyushu University, 744 Motooka, Nishi-ku, Fukuoka 819-0395, Japan
First published on 19th January 2022
Abstract
This work focuses on understanding the oxygen-ion transport through the mixed Grain Boundaries (GBs) present in yttria-stabilized zirconia (YSZ), a common solid oxide fuel cells (SOFCs) electrolyte. The mixed GBs, having a disordered arrangement of atoms due to the merging of crystalline facets of the two adjacent grains, were found to be the most prominent in experimentally prepared samples. In this work, all GBs were constructed using the amorphization and recrystallization technique implemented via molecular dynamics. An in-depth study was conducted for a mixed GB present in our 8YSZ sample, formed by the planes (−511) and (21−1). Oxygen-ion self-diffusion was studied for a range of temperatures between 700 K and 2300 K and for samples having Y2O3 concentration between 4–14 mol%. The oxygen-ion diffusion in the prepared mixed GBs was then compared with the well-investigated high symmetry GBs, i.e., Σ = 5(310)/[001], Σ = 11(311)/[110], Σ = 13(510)/[001], another mixed GB formed by (20−1) and (100) planes and the single-crystal. In agreement with the previous studies, the optimum Y2O3 content for maximum oxygen self-diffusion in mixed GB was found to be 8 mol%. Furthermore, it was found that oxygen self-diffusion is hindered not only at the GB core but also inside grains having specific orientations. This is attributed to the formation of oxygen vacancy (VO) clusters indicated by Y3+ segregation and the subsequent lack of O−2 ions at the GB core. The collective analysis of this study indicates that at optimum Y2O3 concentration, specific grain orientations concerning the GB plane reduce the oxygen vacancy clustering at the grain interior regions close to GB, thereby resulting in the overall higher oxygen-ion diffusivity of the mixed GBs.
1 Introduction
Electrolyte samples are generally polycrystalline with different grain sizes, grain orientations, dopant segregation, and defect distribution. In addition, they are typically characterized by a high density of Grain Boundaries (GBs). All these features can substantially affect ionic conductivity. When two grains meet and create a boundary at a certain angle, the atoms that meet and belong to two different lattice orientations rearrange to obtain the lowest energy structure between the two grains. The rearranging of atoms results in a disordered region of a few atomic layers that separates both grain lattices, the width of which depends on the angle between the two lattices. Consequently, the formation of GBs translates into disorder and in other microstructural defects, such as vacancies or dislocations, in the region of the grain near the GB, due to the stress created by the lattice mismatch of the two grains at their interface. Therefore, it is expected that any phenomenon (such as ion transport), which depends upon the degree of disorder between the two grains, would change based on their coincidence angle. In contrast with other fluorite like materials, in UO2 doped structures oxygen diffusion at GBs have been reported to not change in comparison to bulk.1,2 In addition, several computational studies explained how GBs provide fast-channels for oxygen conductivity between different grains in UO2.1–6Experimentally, the atomistic structure of GBs can be analysed and observed via transmission electron microscopy (TEM).7 However, atomistic and electronic level simulations are usually adopted to fully understand the transport mechanism of oxygen-ions across the grains and GBs. Specifically, Molecular Dynamics (MD) simulation has been the most frequently used approach to study the GBs structure at a larger scale.8 Over the past 40 years, MD techniques have been mainly applied to simulate the oxygen-ion transport in high symmetry tilt or twist grain boundaries of commonly used solid oxide fuel cells (SOFCs) electrolytes.9–21 However, since the majority of boundaries found in polycrystalline samples are a mix of twisted and tilted denominations-commonly named as “mixed,” “general,” or “random” GBs,22–25 identifying pathways to enhance ion transport through mixed GBs is essential to improve oxygen-ion conductors' performance substantially. Therefore, in this study, an in-depth MD analysis was conducted to investigate the role of mixed GBs in well-known yttria-stabilized zirconia (YSZ) electrolytes. For comparison, we have also studied symmetric or Coincidence Site Lattice (CSL) GBs. CSL GBs are considered to be special within polycrystalline materials. They are believed to be low-energy and high symmetry, and they are observed to be resistant to intergranular fracture in contrast to mixed or general GBs.26,27 Further, we chose to investigate YSZ as it is not only a benchmark material used in SOFCs since the 1980s due to its excellent mechanical stability and durability, but also because it is a pure ionic conductor with no electronic conductivity, making it a perfect material for conducting this systematic study.
Literature shows extensive and detailed studies on CSL tilted or twisted YSZ GBs, either by computational,9–21 or experimental7,16,28–30 approaches. However, to our best knowledge, no work focused on understanding ion transport through mixed GBs in YSZ, despite their dominating presence in the samples. Herein, we present an experimental and theoretical study to identify the mixed GB distribution and analyse their oxygen-ion conductivity. First, polycrystalline YSZ samples were fabricated in the form of sintered ceramic pellets. Then, we use TEM to identify the type of GBs present in the sample. Finally, the structure and transport properties of the mixed GB at several Y2O3 concentrations and temperatures were modelled computationally, and the results were compared with the high symmetry Σ5 (Σ5 = (310)/[001]) GB, Σ11 (Σ = 11(311)/[110]), Σ13 (Σ = 13(510)/[001]), another mixed GB formed by (20−1) and (100) planes and the single crystal models. Finally, the underlying reason for the obtained conductivities of different GB samples was discussed by coordination number analysis.
2 Methodology
2.1 Sample preparation
Commercial 8 mol% YSZ powder—TZ-8Y, was purchased from Tosoh (Japan). The powder was compacted to a disc-shaped pellet by uniaxial hydraulic pressing with a pressure of 19.68 MPa and subsequently via cold isostatic pressing at a pressure of 250 MPa for 10 min. The diameter of the pellet die was ∼18 mm. The green pellets were then sintered at 1400 °C for 5 h.2.2 Scanning electron microscope (SEM) characterization
2D Electron backscatter diffraction (EBSD) maps were acquired on an SEM using TSL OIM backscatter diffraction camera. An accelerating voltage of the electron beam was set to 15 kV. Orientation maps were acquired from 100 by 100 μm regions with square grid pattern and 150 nm step size.2.3 Transmission electron microscopy characterization
TEM thin foil samples were prepared by ion milling after slicing, and mechanical thinning of the YSZ sintered material. The GB was observed using Titan ETEM, FEI, with aberration collection operated at an accelerating voltage of 300 kV.2.4 Simulation details
LAMMPS (Large-scale Atomic/Molecular Massively Parallel Simulator),31 an MD simulations package, is used to generate the mixed GB's atomic model via amorphization and recrystallization (A&R) strategy.32,33 The interatomic potentials used for MD calculations are described by a rigid-ion Buckingham type potential. The short-range Buckingham potential was combined with a long-range coulombic term to model ionic interactions properly.Thus, the potential for the interaction between two ions i and j at a distance r is defined by the following equation:
 | (1) |
The oxygen-ions diffusion was determined by the mean squared displacement, MSD(t), given by:
 | (2) |
 | (3) |
3 Results and discussion
3.1 Statistical distribution of GBs in YSZ sample
The XRD pattern (Fig. S1†) confirms that the 8YSZ bulk part is polycrystalline, the peaks are indexed to the YSZ crystal planes, indicating cubic phase with low or non-existent impurities. The lattice parameter calculated from the XRD pattern is 0.514 nm, which is in good agreement with our computationally obtained value of 0.514 nm for 8YSZ.This lattice parameter also agrees closely with the ones reported in literature.13,17,44In order to identify the prominent GBs in the prepared sample, first, we conducted an EBSD-SEM analysis. Fig. 1 represents the statistical overview of the grains in the sample coupled with the grain map illustrating the individual grains. The grains were identified by defining a critical misorientation angle within the polycrystalline YSZ pellet.
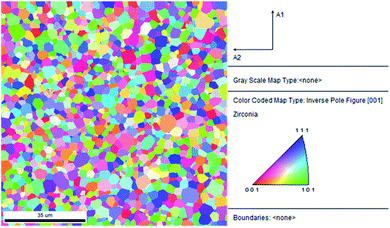 | ||
| Fig. 1 2D inverse pole figure (IPF) EBSD map of YSZ polycrystalline pellet. The reference triangle is placed at the right. | ||
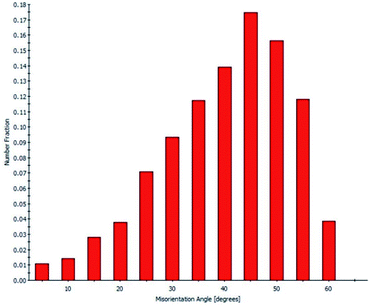
The ‘misorientation angle’ is the most common and valuable descriptor used to provide the rotation angle between the grain orientation planes. For our sample, the distribution of misorientation angles of GBs is represented in Fig. 2. It was found that most of the misorientation angles at GBs were larger than 15°. Therefore, most of the GBs present in our pellet were high-angle GBs. Two local maxima were identified in the misorientation angle distribution of our sample: first in the range of 42–47°, and the second in the range of 47–52°. In other words, most of the GBs in the sample have a misorientation angle between 42–52°, and, therefore, their behaviour will be critical in determining the overall transport properties of the samples.
Furthermore, the EBSD-SEM analysis allow to plot the individual CSL GBs fraction contained in the pellet according to the overall GB population (Fig. S2†). The CSL GBs fraction is 17% of the sample, with the largest fraction being type Σ3 followed by Σ5, Σ9 and Σ11 GBs. The fraction of CSL GBs agrees with the value previously reported by Vonlanthen and Grobety (17.8%).45
3.2 Computational model preparation of mixed GB
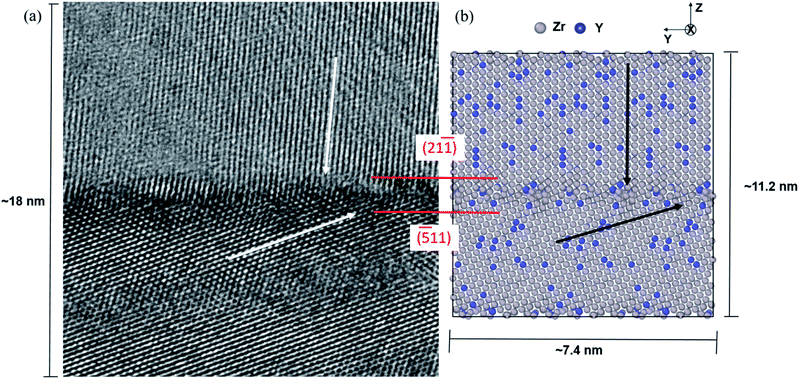
Dopant segregation and oxygen diffusion has been widely studied for fluorite based materials. Previous studies confirmed that defect segregation towards GBs in different polycrystalline doped-oxides is thermodynamically favoured process, leading to degradation of the material and a reduction in oxygen conductivity.15,18,46–48 However, different materials and different GB structures have different behaviour as suggested by several studies.18,49–51 In order to investigate the effect of mixed GBs on oxygen-ion transport in the YSZ sample, we chose to model the mixed GB formed with (−511) and (21−1) surfaces and misorientation angle of 52°. This GB was identified by TEM (as illustrated in Fig. 3(a)) and selected as an example among several other similar GBs observed in the sample. We used the A&R technique to design the realistic model of the mixed GB, as shown in Fig. 3(b). In Fig. 3, the original model was visually repeated along the Y-axis and the oxygen atoms were removed for better comparison with the TEM image.To prepare the mixed GB model, we used the starting periodic supercell structure having low built-in strain and a reasonable number of atoms. The initial structure was achieved by VNL (Virtual NanoLab),52 which allows an efficient and systematic search for common supercells between two crystalline surfaces by varying the interface strain and the rotation between them. This search resulted in a model having both surfaces aligned parallel at an optimized distance of about 7 Å, with zero angles of orientation, a total strain of 0.98% between them, and the lowest possible number of atoms (648). This model was then repeated ten times along the X-axis and two times along the Y-axis to obtain the desired initial model having thick enough grains with 6240 atoms each (2080 Zr4+ and 4160 O2−), so the effect of yttrium substitutional defects (YZr′) can be adequately observed. In total, both surfaces were constructed with 54 layers along Z (the grain boundary axis) to maintain the same initial thickness for both grains. In order to obtain the 8% Y2O3 doped ZrO2 models, Zr4+ atoms were substituted randomly by Y3+ in the structure, and for every two atoms substituted, one VO was created. It should be noted that the TEM image showed a deviation of 1.7° concerning the grain orientation (21−1) with respect to the GB plane. However, no deviation between the two surfaces was considered in our starting model. They were allowed to rotate freely during the A&R process.
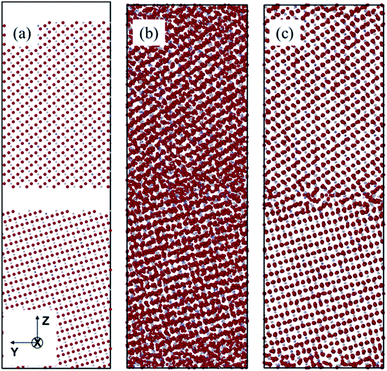
To conduct the A&R process, we used the NPT (constant number (N), pressure (P), and temperature (T)) ensemble for amorphization as well as recrystallization steps. For amorphization, the optimum melting temperature for our model was found at 5200 K for 690 ps (Fig. 4(b)). Experimental samples are synthesized with short annealing times which leads to the kinetically favourable atomic arrangement, with an appropriate randomized dopant distribution. To simulate this process via molecular dynamics, we require higher operating temperature since the simulation time will be a very small fraction of the experimental annealing time.53–56 Therefore, the two surfaces have been put close together and then temperature was raised until we achieve complete amorphization of the structure without losing the short range order of each grain. The RDF was checked after every few steps to make sure our sample is getting to the amorphous state. When the system is relaxed, the initial gap between the two grains disappears completely and during the heating process, it starts to form the highly disordered GB with comparatively less disordered grains. Further, since oxygen has lower atomic mass (∼16 u) as compared to cations (Y (∼88.90 u) or Zr (∼91.22 u)), we see more disorder in O atoms compared to cations as illustrated by RDF of O–O, Zr–Y and Zr–Zr (Fig. 5). Beyond this temperature (i.e. 5200 K) our system makes solid solution and could not be recrystallized. It's important to mention that according to Dillon and Harmer's GB complexion theory, different sintering or simulation conditions during the model preparation may lead to different GB phases or complexions with different properties and behaviour.57–59 Therefore, it is possible that we might have obtained the microstructural features in our GB models that are not present in the experimental samples. After randomization, recrystallization was induced by reducing the system's temperature from 5200 K to 20 K in 500 ps using an NPT ensemble, which recrystallized the system (Fig. 4(c)). After recrystallization, the system was equilibrated for 100 ps, followed by final potential energy minimization in order to remove any internal stress in the material caused during the recrystallization.60 Minimization is performed using a built-in function in LAMMPS that iteratively adjusts the atomic coordinates to minimize the potential energy using a conjugate gradient optimization algorithm. For a more straightforward 3D interpretation of the arrays of atoms, cations' radius was reduced visually in Fig. 4.
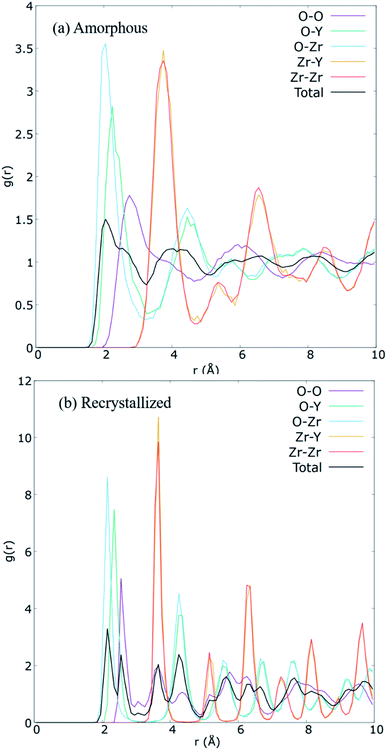 | ||
| Fig. 5 Calculated partial radial distribution functions for each ionic pairs in the (a) amorphized, and (b) the recrystallized 8YSZ GB systems. | ||
Further, 4YSZ, 11YSZ, and 14YSZ mixed GB models were prepared to investigate the effect of Y-doping. The mixed GB models were also compared with the high symmetry Σ5 GB. All the models were prepared via the same A&R strategy. The final structures of 4YSZ, 11YSZ, 14YSZ, and Σ5 are represented by Fig. S3 in ESI .†
3.3 Structural properties of mixed GB
The A&R process was verified via partial radial distribution function (RDF), g(r). RDF outlines the average spatial organization of atoms in the cell lattice. Partial RDFs are distinct between ionic pairs. Consequently, Fig. 5 plot the contrasting RDFs of the amorphous and recrystallized YSZ GB models. For the recrystallized structure (Fig. 5(b)), well-defined pronounced peaks are observed. These peaks' location corresponds to the distance of the average closest neighbouring atoms between pairs, a sign of long-range order preservation. Hence, when ZrO2 is doped with Y2O3, it is expected that the creation of VO distorts the peaks for the O–O pair, as also observed for our prepared sample. After A&R, the local position of O2− surrounding VO changes toward or away from it,13,61 resulting in broader peaks for the O–O pair (Fig. 5(b)). Further, at 20 K the average closest-neighbour O–O, O–Zr, O–Y, and Zr–Y distances are estimated as ∼2.55, 2.15, 2.35, and 3.65 Å, respectively, which agree with the experimental and computational crystallographic data reported in the literature.62,63In contrast to the RDF of the recrystallized model, RDF for the amorphous model (Fig. 5(a)) shows a left shift in the short-range peaks of O–Zr, and O–Y at 2.05, and 2.25 Å, respectively, and a right shift in the peaks of O–O and Zr–Y at 2.75 and 3.75 Å, respectively. Further total RDF after 4 Å as well as partial RDF of O–O, O–Zr, O–Y showed no significant long range structure, as reported in other theoretical studies of amorphous YSZ.63–65 However, in this work we did not achieve the solid solution as expected for amorphous structures, instead we have a short range disordered structure after amorphization step, needed to recrystallize the system.64,65 The broader peaks observed along r (Å) for the amorphous structure and the sharp peaks observed for the recrystallized structure clearly show the success of the A&R process.
Furthermore, it was found that the system's volume substantially increases during the heating process, resulting in the 38.3 × 38.7 × 116.9 Å cell dimensions and decreases during the cooling process, resulting in the 36.5 × 36.9 × 112.1 Å cell dimensions for the recrystallized structure. In addition, an excess volume of 1.93% was calculated in comparison with the single-crystal model. The observed increase in volume is due to the 0.98% tensile strain on both grains in the initial model.
The A&R process enabled both the grains to grow a realistic GB between them. It should be noted that Y3+ substitutional defects and oxygen vacancies (VO) are introduced before the A&R process so that the GB model can achieve a low energy configuration while inducing possible segregation of Y3+ and VO. In this work, following the previous methodology,66 the use of the NPT ensemble successfully allowed our system to design GB properly without being influenced by the initial void chosen between the grains contrary to the simulations conducted with the NVE ensemble.67 This was confirmed by performing A&R on a starting supercell having shorter (5 Å) and larger (10 Å) void between the two grains. All the starting supercells with voids of 5, 7, and 10 Å resulted in similar final structures (For more details, refer to Fig. S4†).
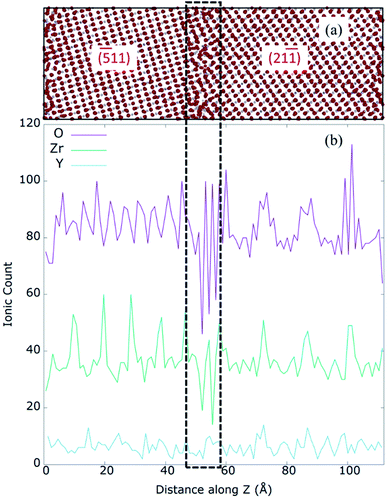
To further understand the mixed GB structure, we calculated the O, Y and Zr ion densities in the prepared model. Fig. 6 represents the one-dimensional (1D) ionic count of O2−, Zr4+, and Y3+ along the z-axis (perpendicular to the GB plane) of 8YSZ. The disorder at the GB core corresponds to an approximate thickness of 1.2 nm, five atomic layers, represented by dotted lines in Fig. 6. It also reveals that the thickness of left (−511) and right (21−1) grains are 4.7 nm and 5.3 nm approximately, resulting in the mixed GB periodic model of 11.2 nm. Several local minimum peaks exist in the 1.2 nm GB core, indicating the GB core's low ion density. Further, O2− density is minimum at the GB core while its maxima can be seen at the ends of the GB core, denoted as ‘edges’ of the GB core (represented by the dashed black line). The average anion/cation stoichiometry for 8YSZ is 1.93; at the GB core, the measured stoichiometry is 1.88, proving the deficiency of O2− and consequently, segregation of VO at the GB core. These results agree with previous works,19,68 and are likely responsible for the predicted space-charge regions due to VO and possibly Y3+ segregation at the GB core and their depletion in the adjacent bulk regions.69,70
3.4 Yttrium distribution in mixed vs. symmetric GBs
First, we investigated Y3+, O2− and Zr4+ concentrations in our prepared mixed GB model. As shown in Fig. 6, the Zr4+ and O2− ion density significantly varied at grain interior and GB core. In contrast, our mixed GB model showed no drastic change in Y3+ concentration along the z-axis between GB core and grain regions. The Fig. S5† shows the normalized ionic count with respect the total number of ions of each specie. There, a higher fraction of Y3+ can be observed at the GB core and its surroundings, especially if it's compared with the O2− and Zr4+ fractions. However, taking into account the distribution of Y3+ through the whole model, it cannot be considered that the segregated quantity of Y3+ is as significant as has been reported previously by other studies in the literature.7,14,21,71,72 This apparent discrepancy can be explained considering that our MD production run is only conducted for 500 ps, which is very small to see any significant Y3+ segregation. Practically, Y3+ segregation at GB is a time-dependent process and happens over long operation time of SOFCs.15,18,20Shibata et al. experimentally investigate thoroughly the effect of Y3+ segregation and its effect on blocking oxygen diffusion on Σ3 and Σ5 bicrystal.7,51,73–75 Gonzalez-Romero et al. reported several MD studies where they had added extra energy to Y3+ cations to overcome the difficulties of classical methods to yield segregation naturally by itself.15,18 However, it should be mentioned that irrespective of the technique used, previous MD studies suggest that Y3+ segregation does not seem to affect the oxygen-ion conductivity at the GB significantly.11,15,17,18,20 However, it has a major impact on the overall conductivity since VO tends to be the second nearest neighbours of Y3+ cations.13,14 Furthermore, it is unclear how Y3+ distribution in the samples is affected by grain orientations. As mentioned previously, 500 ps is not enough to see Y3+ segregation, but by analysing the ionic density of Y3+ before and after the A&R process, for both mixed GB and the high symmetry Σ5 GB (Fig. 7), we can understand if grain orientation influences the distribution of Y3+ or not. In both GBs, Y3+ moves away from the GB core to the edge of the GB core after relaxation. In the mixed GB, along with the two new peaks at the edge of the GB core (shown by black arrows in Fig. 7(a)), Y3+ gets accumulated in the (21−1) grain interior (shown by red arrows in Fig. 7(a)). Such behaviour was not found for Σ5, where fewer structural differences exist between the two grains forming the GB in agreement with the literature.13 The predominant effect seen in the Σ5 GB is the segregation of Y3+ ions at the edge of the GB core (indicated by the black arrows in Fig. 7(b)).
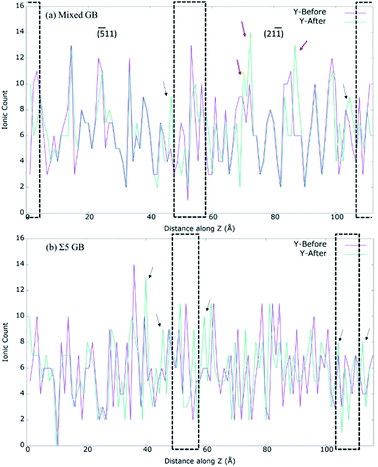 | ||
| Fig. 7 Calculated Y-ion count along z direction for (a) 8YSZ mixed GB system. (b) 8YSZ Σ5 GB system. The dotted box in (a) and (b) represent the GB cores. | ||
To confirm if this behaviour is characteristic of mixed GBs, three more 8YSZ GBs were modelled: (a) another mixed GB observed by TEM in the sample and formed by planes (20−1) and (100) with a misorientation angle of 26.6° (Fig. S6†); (b) Σ13 (510)/[001] GB; and Σ11 (311)/[110] GB. The recrystallized structures are shown in Fig. S7.† The yttria content of the mixed GB within the (100) and (20−1) grains didn't change during the A&R. In (100) grain the content of Y3+ seems well ordered and uniformly distributed, and only small signs of segregation can be observed close to the GB edges (Fig. S8†). On the other hand, Σ13 presents a more significant rearrangement of Y3+, with yttria segregation close to the GB core as well as inside the bulk. Lastly, Σ11 the most symmetric GB showed accumulation of Y3+ in one of the grains and towards the GB. Clearly, this analysis shows that segregation of Y3+ is dependent on grain orientation.
3.5 Oxygen diffusion in mixed GB at different temperatures
The oxygen self-diffusion (Do) was analysed through the mixed GB at various operating temperatures. First, to better understand the influence of the GB with respect to bulk, the Mean Squared Displacement (MSD) was calculated from the total squared displacement of oxygen-ions in all three (X, Y, Z) directions i.e. (dx*dx + dy*dy + dz*dz), where dx, dy, dz corresponds to change in position of the ion in X, Y, and Z directions, respectively. Considering the Z-axis as a reference, three regions of 2 nm each were selected for representing core GB, (−511) grain, and (21−1) grain. The grain regions were selected as farther as possible from the GB core, as represented by red boxes in Fig. 8. The left part of the figure shows the MSD results for all three regions at 2300 K. Here, the real blocking effect of the GB in the oxygen-ion conductivity can be noticed. Calculating the oxygen self-diffusion coefficient (Do) from the total MSD allows us to compare the differences in oxygen migration between regions; the results are summarized in Table 1. The GB core shows a Do, 4.85 × 10⁻¹⁰ m2 s−1, much lower than both grains, as expected. However, to our surprise, we found a significant difference in diffusivity between the two grains. The (21−1) grain (Do = 1.24 × 10⁻⁹ m2 s−1) showed diffusivity almost double than (−511) grain (Do = 8.69 × 10⁻¹⁰ m2 s−1). Interestingly this gap between the diffusivity of both grains indicates that during the formation of GBs, the grain orientation toward the GB plane plays an important role in oxygen diffusion inside the grain. Such effect is not noticeable when modelling highly symmetric GBs.13,15,17,18,20 To verify these findings, the MSD at 2300 K was calculated (Fig. S9†) for the oxygen atoms contained in two single-crystal structures modelled with the orientation planes of the mixed GB structure: (21−1) and (−511). The almost identical MSD results for (2−11) and (−511) single crystals confirm that GB is critical in determining oxygen diffusion inside the constituent grains.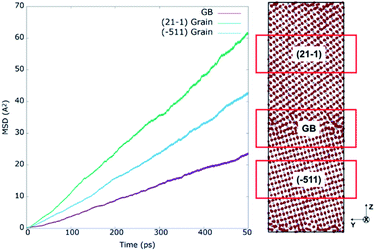 | ||
| Fig. 8 Mean square displacements at 2300 K for regions of 20 Å along z axis containing the GB core, (21−1) and (−511) grain interior regions of 8YSZ mixed GB system. | ||
| Model | Total | GB core | Grain 1 (−511) | Grain 2 (21−1) |
|---|---|---|---|---|
| 4YSZ | 9.39 × 10⁻¹⁰ | 3.35 × 10⁻¹⁰ | 8.21 × 10⁻¹⁰ | 1.09 × 10⁻⁹ |
| 8YSZ | 1.07 × 10⁻⁹ | 4.85 × 10⁻¹⁰ | 8.69 × 10⁻¹⁰ | 1.24 × 10⁻⁹ |
| 11YSZ | 1.05 × 10⁻⁹ | 6.10 × 10⁻¹⁰ | 9.04 × 10⁻¹⁰ | 1.14 × 10⁻⁹ |
| 14YSZ | 9.06 × 10⁻¹⁰ | 3.85 × 10⁻¹⁰ | 6.44 × 10⁻¹⁰ | 9.17 × 10⁻¹⁰ |
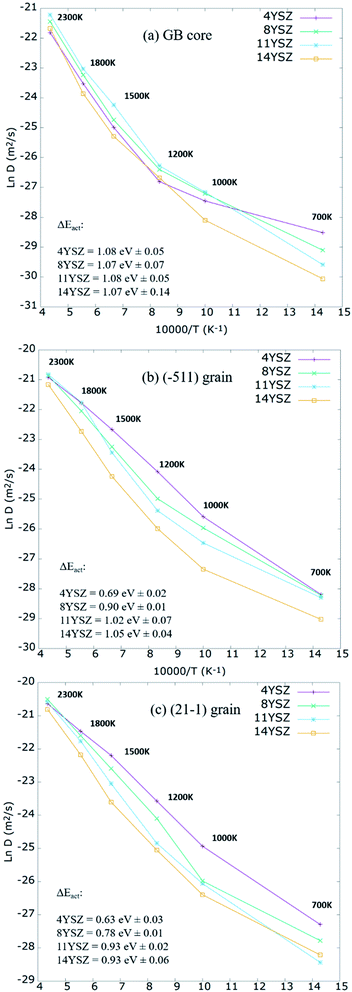
To better understand the effect of grain orientation on the overall performance of the mixed GB system, further investigations of the oxygen self-diffusion were carried out. Models with 4%, 11%, and 14% Y2O3 dopant concentrations were prepared using the same parameters and technique described above and were investigated under a range of temperatures between 700–2300 K. Fig. 9 plots the Arrhenius relationship between Ln of Do and the inverse of temperature. At the GB core (Fig. 9a), 8 and 11YSZ seem to have the optimum Y2O3 content, enabling best ionic diffusivity for operating temperatures between 1000-1200 K. Above 1200 K, the highest Do for the GB core is found for 11YSZ. At lower temperatures (<1000 K), empirical potentials have difficulties describing oxygen migration, which is why 4YSZ shows the highest Do at 700 K. The same effect is observed at the grain interior (Fig. 9b and c) where the maximum diffusivity is observed for 4YSZ for the range of temperatures between 700 K and 1500 K. In this low-temperature range, MD calculations do not accurately represent the energy given to the oxygen-ions to diffuse through the vacancies in a short production time (0.5 ns). Consequently, the activation energies (EAct), represented in Fig. 9, have been calculated through the Arrhenius plot considering only values from 1200 K to 2300 K. The GB core presents higher EAct than grains as expected. Within the GB core region, the values don't vary significantly with the increasing amount of yttria. On the other hand, we can see a larger contrast between different Y2O3 within the grains regions, specially between 4YSZ and 8YSZ. However, this difference seems to be reaching its maximum around 14YSZ, in agreement with previous studies.13,15,63
Furthermore, even though it is well known that experimentally, 8YSZ presents the highest oxygen diffusivity for a wide range of temperatures, in MD, the highest diffusivity under 2000 K is often found for Y2O3 content below 8 mol%.17,63,76–78 In contrast, at higher temperatures (1800−2300 K), 8 and 11 mol% are the optimum concentrations for O2− mobility. Furthermore, it should be noted that according to our calculations, oxygen diffusion should be more impeded for concentrations ≥ 14 mol% at temperatures between 700–2300 K.
These results agree with the optimum concentration reported for YSZ single crystal,17,63,79 symmetric GB,9 and amorphous phase.63 Lastly, it should be noted that the diffusivity of both grains follows the same trend for different Y2O3 doping concentrations and temperatures despite their structural differences.
3.6 Conductivity of mixed GB vs. Σ5 vs. SC
To identify the role of grain orientation on O2− ion diffusion, next we investigated Do in Σ5 GB and single crystal (SC) and compared it with that of mixed GB at 2300 K. The reason for choosing this temperature instead of the average operating temperature of SOFC (∼1000−1200 K) is the difficulties reported previously to correctly describe the diffusion coefficient at temperatures below 2000 K17,63,76–78 MSD calculations were performed for the prepared 4−14 mol% YSZ mixed and Σ5 GBs and compared with the SC system. Fig. 10 shows the calculated Do for the three complete systems as a function of the Y2O3 content at 2300 K. The optimum Y2O3 content was found for 8 mol% for all three systems. However, Do is quite different between GBs and SC systems. The low Do of GB systems indicates how the presence of GBs obstructs the oxygen-ion migration. Further, this effect is higher for the mixed GB than for Σ5. In SC, the optimum concentration is clearly 8YSZ. However, in GB-containing systems, the optimum concentration may be higher than 8YSZ, as the difference between 8 and 11YSZ is not as pronounced as in SC. These results are in good agreement with the reported literature for Σ5 and SC.13,20,63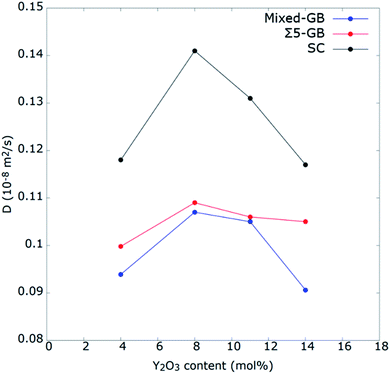 | ||
| Fig. 10 Self-diffusion coefficients of oxygen ions as a function of doping concentration for YSZ mixed GB system, Σ5 GB, and SC at 2300 K. | ||
Furthermore, the presence of GB causes a decrease of the interior diffusion in grain as compared to that in SC model that show a Do of about 1.41 × 10⁻⁹ m2 s−1 at 2300 K (Table 2). It can be explained as an aftereffect caused by the low diffusivity in the GB core that extends over the grains, as explained by Huang et al.17 On the other hand, it also might be caused by the segregation of Y3+ toward the GB's core as suggested by Gonzalez-Romero et al.,15 who induced Y3+ segregation externally. Nonetheless, they noticed that the effect did not appear at the GB core, where oxygen-ions rearranged themselves during the diffusion. Instead, the effect of Y3+ segregation appeared in the grain interior, where the number of oxygen-ions as second neighbours for YZr′ defects dropped drastically. In this work, as explained earlier, segregation of Y3+ was found to be favoured by (−511) grain which also showed low Do. In contrast, (21−1) grain showed diffusivity close to that of SC. Interestingly this behaviour was also observed for the (20−1) (100) mixed GB, where the oxygen self-diffusion in grain (100) was almost twice as high as in grain (20−1). This is due to the reason that (100) grain has well distributed Vo along the Z direction (Fig. S8†), allowing an easy oxygen ion diffusion. On the other hand, for the CSL GB systems, Y3+ segregates towards the GBs core due to the symmetry of both grains,28 and interestingly our calculation shows that the oxygen self-diffusion of their grain interior are lower than that calculated for the (21−1) or (100) grains (Table 2). This demonstrates that grain orientations have a massive impact on the oxygen conductivity of the system, and all GBs should not be treated the same. From these results, we can conclude that grain orientations favouring Y3+ segregation will present lower Do at the grain-interior region close to the GB than those preventing it. That being said, this effect is probably negligible in polycrystalline samples with grain sizes equal of greater than micrometre scale because the bulk part affected by the segregation of Y3+ would be a small percentage of the whole grain interior size. However, it should be noted that the creation of space-charge regions takes place inside the grains, close to the GBs, and they extend several nanometres towards the bulk.47,80,81 Therefore, the space-charge regions would seriously impact YSZ samples having the nanoscale grain sizes, decreasing their conductivity significantly.69,81
| Model | Total | GB core | Bottom grain | Top grain |
|---|---|---|---|---|
| Mx GB (−511) (21−1) | 1.07 × 10⁻⁹ | 4.85 × 10⁻¹⁰ | 8.69 × 10⁻¹⁰ | 1.24 × 10⁻⁹ |
| Mx GB (20−1) (100) | 1.19 × 10⁻⁹ | 4.60 × 10⁻¹⁰ | 7.23 × 10⁻¹⁰ | 1.51 × 10⁻⁹ |
| Σ5 (310) GB | 1.09 × 10⁻⁹ | 5.21 × 10⁻¹⁰ | 1.14 × 10⁻⁹ | 1.14 × 10⁻⁹ |
| Σ11 (311) GB | 1.20 × 10⁻⁹ | 7.93 × 10⁻¹⁰ | 1.17 × 10⁻⁹ | 1.17 × 10⁻⁹ |
| Σ13 (510) GB | 1.07 × 10⁻⁹ | 5.12 × 10⁻¹⁰ | 1.09 × 10⁻⁹ | 1.09 × 10⁻⁹ |
| SC | 1.41 × 10⁻⁹ | — | — | — |
3.7 Coordination number analysis in mixed GB
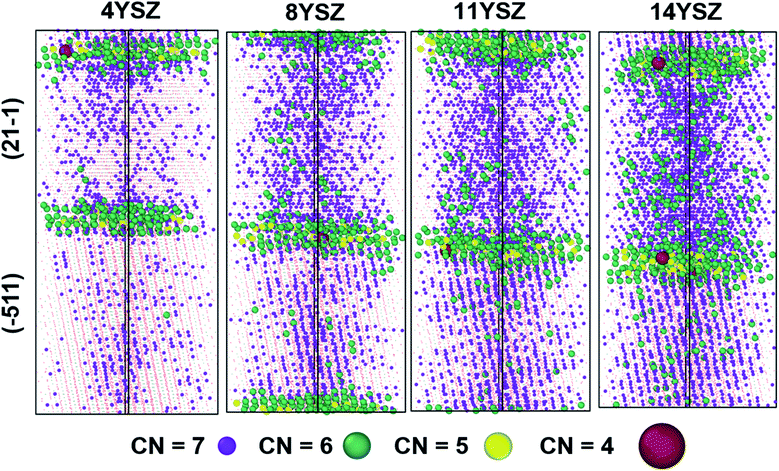
The oxygen-ion diffusion is different for different regions of the prepared mixed GB sample. Table 2 summarizes this difference in the oxygen self-diffusion coefficient for every region of the GB model at 2300 K. It is crucial to understand the origin of this difference in diffusivities to improve the overall conductivity of YSZ samples via GB engineering. Therefore, we further analysed the oxygen vacancies distribution via cation coordination number analysis. Fig. 11 represents the distribution of cations with coordination number < 8 for the first nearest-neighbour shell, therefore the cutoff radius was set at 3 Å. The average coordination number for cations decrease from 7.6 for 4YSZ to 7.14 for 14YSZ. The decrease in coordination is caused by increasing yttria's doping concentration, increasing the number of oxygen vacancies.It should be noted that the 7-coordinated cations are more uniformly distributed for grain (21−1) than for (−511) orientation for all the samples with different yttria doping content. In addition, at the edge of grain (21−1), they are more uniformly distributed than in (−511) grain. For each composition, the average coordination is lower at GB than at grain, indicating that cations at GB core attract oxygen vacancies as also reported by González-Romero et al.13 However, in our system, the accumulation of Y3+ inside (21−1) grain allows a uniform distribution of VO along the grain interior favouring the easy oxygen-ion diffusion in this region. On the other hand, the grain orientation (−511) seems to have many areas with only 8-coordinated cations (plotted as dots in the figure for more straightforward visualization). Consequently, because of the lack of VO, oxygen-ion migration become harder in these areas. Furthermore, Table S2† shows the percentage of cations with different coordination at the different cell regions for each doping concentration. As expected, most of the low coordinated cations (6 and below) are found at the GB cores due to the accumulation of VO and the lack of crystallinity.
Furthermore, the two grains behave differently. The 7-coordinated cations predominate in (21−1) grain irrespective of the doping concentration in the sample. 8YSZ seems to have the best distribution of oxygen vacancies, facilitating the oxygen diffusion. Higher concentrations of Y2O3 lead to a higher number of YZr–YZr defects clustering, increasing the probabilities of having trapped oxygen vacancies, hindering the oxygen mobility, as observed in the 14YSZ system.18,82,83 On the other hand, 11YSZ shows the highest 7-coordinated cation concentration and consequently the lowest oxygen vacancy clustering, which leads to the highest Do at the GB core among all the samples.
4 Conclusions
GBs with a misorientation angle between 47° and 52° are found to be the most common GBs in our YSZ sintered ceramic pellets. A mixed GB with 52° angle was identified among others using TEM and analysed in this work via classical MD. First, a realistic model of the mixed GB was prepared via the A&R technique. Then, its structural and transport properties were computationally investigated in detail. The results were compared with the high symmetry Σ5 Σ11 Σ13 GBs, another mixed GB formed by (20−1) and (100) planes and SC systems. In agreement with other computational and experimental studies, at 2300 K, the optimum Y2O3 content for maximum oxygen self-diffusion was found to be between 8–11 mol%. Further, it was found that the grain orientations play an essential role in oxygen-ion diffusion. Not only the GB core but also grain interior regions behave differently for different orientations. In contrast to (−511) grain orientations, (21−1) grain has the optimal Y3+ distribution, which resulted in (21−1) grain performing even better than the high symmetry GBs. Same behaviour was found for (100) plane for the other mixed GB investigated in this work. Conclusively, ion conductivity through GBs is highly dependent on grain orientations, operating temperature, and Y2O3 concentration. Therefore, GBs should be optimized with respect to these parameters in order to design high-efficiency YSZ electrolytes. The GB effect is specifically critical for nanocrystalline samples where the space-charge regions control the ionic conductivity.Conflicts of interest
There are no conflicts to declare.Acknowledgements
This research was enabled in part by support provided by Calcul Québec (https://www.calculquebec.ca) and Compute Canada (www.computecanada.ca). The authors acknowledge the Natural Sciences and Engineering Research Council of Canada (NSERC) Discovery grant program, [Funding Reference number RGPIN-2020-05924], Canada Research Chair (CRC) program, and the Canada Foundation for Innovation (CFI) for infrastructure and operating funds. Authors acknowledge the fruitful discussions with Dr Daniele Pergolesi.References
- J. F. Marin and P. Contamin, Uranium and oxygen self-diffusion in UO2, J. Nucl. Mater., 1969, 30, 16–25 CrossRef CAS
.
- A. C. S. Sabioni, W. B. Ferraz and F. Millot, Effect of grain-boundaries on uranium and oxygen diffusion in polycrystalline UO2, J. Nucl. Mater., 2000, 278, 364–369 CrossRef CAS
.
- E. Vincent-Aublant, J. M. Delaye and L. Van Brutzel, Self-diffusion near symmetrical tilt grain boundaries in UO2 matrix: a molecular dynamics simulation study, J. Nucl. Mater., 2009, 392, 114–120 CrossRef CAS
.
- K. Govers and M. Verwerft, Classical molecular dynamics investigation of microstructure evolution and grain boundary diffusion in nano-polycrystalline UO2 Classical molecular dynamics investigation of microstructure evolution and grain boundary diffusion in nano-polycrystalline UO2, J. Nucl. Mater., 2013, 438, 134–143 CrossRef CAS
.
- N. R. Williams, M. Molinari, S. C. Parker and M. T. Storr, Atomistic investigation of the structure and transport properties of tilt grain boundaries of UO2, J. Nucl. Mater., 2015, 458, 45–55 CrossRef CAS
.
- A. R. Symington, M. Molinari, N. A. Brincat, N. R. Williams and S. C. Parker, Defect segregation facilitates oxygen transport at fluorite UO2 grain boundaries, Philos. Trans. R. Soc. A, 2019, 377(2152), 20190026 CrossRef CAS PubMed
.
- B. Feng, N. R. Lugg, A. Kumamoto, Y. Ikuhara and N. Shibata, Direct Observation of Oxygen Vacancy Distribution across Yttria-Stabilized Zirconia Grain Boundaries, ACS Nano, 2017, 11, 11376–11382 CrossRef CAS PubMed
.
- A. L. S. Chua, N. A. Benedek, L. Chen, M. W. Finnis and A. P. Sutton, A genetic algorithm for predicting the structures of interfaces in multicomponent systems, Nat. Mater., 2010, 9, 418–422 CrossRef CAS PubMed
.
- K. S. Chang, Y. F. Lin and K. L. Tung, Insight into the grain boundary effect on the ionic transport of yttria-stabilized zirconia at elevated temperatures from a molecular modeling perspective, J. Power Sources, 2011, 196, 9322–9330 CrossRef CAS
.
- C. A. J. Fisher and H. Matsubara, Oxide ion diffusion along grain boundaries in zirconia: a molecular dynamics study, Solid State Ionics, 1998, 113–115, 311–318 CrossRef CAS
.
- C. A. J. Fisher and H. Matsubara, Molecular dynamics investigations of grain boundary phenomena in cubic zirconia, Comput. Mater. Sci., 1999, 14, 177–184 CrossRef CAS
.
- C. A. J. Fisher and H. Matsubara, The influence of grain boundary misorientation on ionic conductivity in YSZ, J. Eur. Ceram. Soc., 1999, 19, 703–707 CrossRef CAS
.
- R. L. González-Romero, J. J. Meléndez, D. Gómez-García, F. L. Cumbrera and A. Domínguez-Rodríguez, A Molecular Dynamics study of grain boundaries in YSZ: structure, energetics and diffusion of oxygen, Solid State Ionics, 2012, 219, 1–10 CrossRef
.
- H. B. Lee, F. B. Prinz and W. Cai, Atomistic simulations of grain boundary segregation in nanocrystalline yttria-stabilized zirconia and gadolinia-doped ceria solid oxide electrolytes, Acta Mater, 2013, 61, 3872–3887 CrossRef CAS
.
- R. L. González-Romero, J. J. Meléndez, D. Gómez-García, F. L. Cumbrera and A. Domínguez-Rodríguez, Segregation to the grain boundaries in YSZ bicrystals: a Molecular Dynamics study, Solid State Ionics, 2013, 237, 8–15 CrossRef
.
- J. An,
et al., Atomic scale verification of oxide-ion vacancy distribution near a single grain boundary in YSZ, Sci. Rep., 2013, 3, 1–6 Search PubMed
.
- H. C. Huang, P. C. Su, S. K. Kwak, R. Pornprasertsuk and Y. J. Yoon, Molecular dynamics simulation of oxygen ion diffusion in yttria stabilized zirconia single crystals and bicrystals, Fuel Cells, 2014, 14, 574–580 CrossRef CAS
.
- R. L. González-Romero and J. J. Meléndez, Yttrium segregation and oxygen diffusion along high-symmetry grain boundaries in YSZ, J. Alloys Compd., 2015, 622, 708–713 CrossRef
.
- S. Zhang, H. Sha, R. H. R. Castro and R. Faller, Atomistic modeling of La3+ doping segregation effect on nanocrystalline yttria-stabilized zirconia, Phys. Chem. Chem. Phys., 2018, 20, 13215–13223 RSC
.
- M. Jaipal and A. Chatterjee, Effect of the Σ5(310)/[001] tilt grain boundary on oxygen-ion movement in yttria-stabilized zirconia: Insights from molecular dynamics, Acta Mater, 2019, 165, 307–314 CrossRef CAS
.
- W. Xu, A. Maksymenko, S. Hasan, J. J. Meléndez and E. Olevsky, Effect of external electric field on diffusivity and flash sintering of 8YSZ: a molecular dynamics study, Acta Mater, 2020, 206, 116596 CrossRef
.
- T. Watanabe, Grain boundary engineering: Historical perspective and future prospects, J. Mater. Sci., 2011, 46, 4095–4115 CrossRef CAS
.
- A. Morawiec and K. Glowinski, On ‘macroscopic’ characterization of mixed grain boundaries, Acta Mater, 2013, 61, 5756–5767 CrossRef CAS
.
- Z. Yu,
et al., Segregation-induced ordered superstructures at general grain boundaries in a nickel–bismuth alloy, Science, 2017, 358, 97–101 CrossRef CAS PubMed
.
- Z. Luo,
et al., A highly asymmetric interfacial superstructure in WC: Expanding the classic grain boundary segregation and new complexion theories, Mater. Horizons, 2020, 7, 173–180 RSC
.
- P. V. Nerikar,
et al., Grain Boundaries in Uranium Dioxide: Scanning Electron Microscopy Experiments and Atomistic Simulations, J. Am. Ceram. Soc., 2011, 94, 1893–1900 CrossRef CAS
.
- Y. Pant and B. L. Adams, On the CSL grain boundary distributions in polycrystals, Scr. Metall. Mater., 1994, 30, 1055–1060 CrossRef
.
- T. Nakagawa,
et al., Oxygen diffusion blocking of single grain boundary in yttria-doped zirconia bicrystals, J. Mater. Sci., 2005, 40(12), 3185–3190 CrossRef CAS
.
- A. Nakamura,
et al., Direct Evidence of Dopant-Enhanced Grain-Boundary Sliding in Yttria-Stabilized Zirconia Bicrystals, J. Am. Ceram. Soc., 2005, 88, 938–942 CrossRef CAS
.
- G. Sánchez-Santolino,
et al., Localization of Yttrium Segregation within YSZ Grain Boundary Dislocation Cores, Phys. status solidi, 2018, 215, 1800349 CrossRef
.
- S. Plimpton, Fast Parallel Algorithms for Short-Range Molecular Dynamics, J. Comput. Phys., 1995, 117, 1–19 CrossRef CAS
.
- D. C. Sayle, S. A. Maicaneanu, B. Slater and C. R. A. Catlow, Exercising control over the influence of the lattice misfit on the structure of oxide–oxide thin film interfaces, J. Mater. Chem., 1999, 9, 2779–2787 RSC
.
- T. X. T. Sayle, C. R. A. Catlow, R. R. Maphanga, P. E. Ngoepe and D. C. Sayle, Generating MnO2 nanoparticles using simulated amorphization and recrystallization, J. Am. Chem. Soc., 2005, 127, 12828–12837 CrossRef CAS PubMed
.
- L. Minervini, M. O. Zacate and R. W. Grimes, Defect cluster formation in M2O3-doped CeO2, Solid State Ionics, 1999, 116, 339–349 CrossRef CAS
.
- L. Minervini, R. W. Grimes and K. E. Sickafus, Disorder in pyrochlore oxides, J. Am. Ceram. Soc., 2000, 83, 1873–1878 CrossRef CAS
.
- A. Chroneos, D. Parfitt, J. A. Kilner and R. W. Grimes, Anisotropic oxygen diffusion in tetragonal La2NiO4+δ: Molecular dynamics calculations, J. Mater. Chem., 2010, 20, 266–270 RSC
.
- D. Parfitt, A. Chroneos, J. A. Kilner and R. W. Grimes, Molecular dynamics study of oxygen diffusion in Pr2NiO4+δ, Phys. Chem. Chem. Phys., 2010, 12, 6834–6836 RSC
.
- J. Vaari, Molecular dynamics simulations of vacancy diffusion in chromium(III) oxide, hematite, magnetite and chromite, Solid State Ionics, 2015, 270, 10–17 CrossRef CAS
.
- M. O. Zacate, L. Minervini, D. J. Bradfield, R. W. Grimes and K. E. Sickafus, Defect cluster formation in M2O3-doped cubic ZrO2, Solid State Ionics, 2000, 128, 243–254 CrossRef CAS
.
- P. K. Schelling, S. R. Phillpot and D. Wolf, Mechanism of the Cubic-to-Tetragonal Phase Transition in Zirconia and Yttria-Stabilized Zirconia by Molecular-Dynamics Simulation, J. Am. Ceram. Soc., 2001, 84, 1609–1619 CrossRef CAS
.
- T. Oyama, M. Yoshiya, H. Matsubara and K. Matsunaga, Numerical analysis of solute segregation at Σ5 (310) [001] symmetric tilt grain boundaries in Y2O3-doped ZrO2, Phys. Rev. B:
![[thin space (1/6-em)]](https://www.rsc.org/images/entities/char_2009.gif) Condens. Matter
Condens. Matter![[thin space (1/6-em)]](https://www.rsc.org/images/entities/char_2009.gif) Mater. Phys., 2005, 71, 224105 CrossRef
Mater. Phys., 2005, 71, 224105 CrossRef .
- P. P. Ewald, Die Berechnung optischer und elektrostatischer Gitterpotentiale, Ann. Phys., 1921, 369, 253–287 CrossRef
.
- K. K. Ghuman, E. Gilardi, D. Pergolesi, J. Kilner and T. Lippert, Microstructural and Electronic Properties of the YSZ/CeO2 Interface via Multiscale Modeling, J. Phys. Chem. C, 2020, 124, 15680–15687 CrossRef CAS
.
-
M. Chiang, D. P. Birnie and W. D. Kingery, Physical Ceramics: Principles for Ceramic Science and Engineering. John Wiley and Sons, Inc., 1996 Search PubMed
.
- P. Vonlanthen and B. Grobety, CSL grain boundary distribution in alumina and zirconia ceramics, Ceram. Int., 2008, 34, 1459–1472 CrossRef CAS
.
- Z. P. Li, T. Mori, G. J. Auchterlonie, J. Zou and J. Drennan, Direct evidence of dopant segregation in Gd-doped ceria, Appl. Phys. Lett., 2011, 98, 093104 CrossRef
.
- X. Guo and R. Waser, Electrical properties of the grain boundaries of oxygen ion conductors: acceptor-doped zirconia and ceria, Prog. Mater. Sci., 2006, 51, 151–210 CrossRef CAS
.
- A. R. Symington, M. Molinari, J. Statham, J. Wu and S. C. Parker, The role of dopant segregation on the oxygen vacancy distribution and oxygen diffusion in CeO2 grain boundaries, J. Phys. Energy, 2019, 1, 042005 CrossRef CAS
.
- P. P. Dholabhai,
et al., Structure and segregation of dopant–defect complexes at grain boundaries in nanocrystalline doped ceria, Phys. Chem. Chem. Phys., 2015, 17, 15375–15385 RSC
.
- B. Feng,
et al., Atomic structures and oxygen dynamics of CeO2 grain boundaries, Sci. Reports, 2016, 6(1), 1–7 Search PubMed
.
- B. Feng,
et al., Atomically ordered solute segregation behaviour in an oxide grain boundary, Nat. Commun., 2016, 7(1), 1–6 Search PubMed
.
- D. Stradi, L. Jelver, S. Smidstrup and K. Stokbro, Method for determining optimal supercell representation of interfaces, J. Phys. Condens. Matter, 2017, 29, 185901 CrossRef PubMed
.
- M. Coduri, M. Scavini, M. Allieta, M. Brunelli and C. Ferrero, Defect structure of Y-doped ceria on different length scales, Chem. Mater., 2013, 25, 4278–4289 CrossRef CAS
.
- S. Grieshammer, B. O. H. Grope, J. Koettgen and M. Martin, A combined DFT + U and Monte Carlo study on rare earth doped ceria, Phys. Chem. Chem. Phys., 2014, 16, 9974–9986 RSC
.
- J. A. Purton, A. Archer, N. L. Allan and D. S. D. Gunn, Growth of nano-domains in Gd–CeO2 mixtures: hybrid Monte Carlo simulations, J. Mater. Chem. A, 2016, 4, 4592–4602 RSC
.
- J. A. Purton, N. L. Allan and D. S. D. Gunn, Simulations of doped CeO2 at finite dopant concentrations, Solid State Ionics, 2017, 299, 32–37 CrossRef CAS
.
- S. J. Dillon, M. P. Harmer and J. Luo, Grain boundary complexions in ceramics and metals: An overview, JOM, 2009, 61, 38–44 CrossRef
.
- P. R. Cantwell,
et al., Grain boundary complexions, Acta Mater, 2014, 62, 1–48 CrossRef CAS
.
- A. R. Krause,
et al., Review of grain boundary complexion engineering: know your boundaries, J. Am. Ceram. Soc., 2019, 102, 778–800 CAS
.
- A. A. Valladares, Generating amorphous and liquid aluminum: A new approach, J. Non. Cryst. Solids, 2007, 353, 3540–3544 CrossRef CAS
.
- A. N. Cormack, Mass Transport in Anion Deficient Fluorite Oxides, Mater. Sci. Forum, 1986, 7, 177–186 CAS
.
- C. Suciu, E. Dorolti and A. C. Hoffmann, Physico-chemical properties of nanocrystalline YSZ powders as a function of doping level and electrical properties after sintering, Mater. Sci. Energy Technol., 2018, 1, 136–145 Search PubMed
.
- K. C. Lau and B. I. Dunlap, Molecular dynamics simulation of yttria-stabilized zirconia (YSZ) crystalline and amorphous solids, J. Phys. Condens. Matter, 2011, 23, 035401 CrossRef PubMed
.
- M. W. Owen,
et al., Diffusion in doped and undoped amorphous zirconia, J. Nucl. Mater., 2021, 555, 153108 CrossRef CAS
.
- M. J. D. Rushton, I. Ipatova, L. J. Evitts, W. E. Lee and S. C. Middleburgh, Stoichiometry deviation in amorphous zirconium dioxide, RSC Adv, 2019, 9, 16320–16327 RSC
.
- K. K. Ghuman, E. Gilardi, D. Pergolesi, J. A. Kilner and T. K. Lippert, Microstructural and Electronic Properties of YSZ/CeO2 Interface via Multiscale Modelling, J. Phys. Chem. C, 2020, 124(29), 15680–15687 CrossRef CAS
.
- T. X. T. Sayle, S. C. Parker and D. C. Sayle, Ionic conductivity in nano-scale CeO2/YSZ heterolayers, J. Mater. Chem., 2006, 16, 1067–1081 RSC
.
- J. An,
et al., Atomic Scale Verification of Oxide-Ion Vacancy Distribution near a Single Grain Boundary in YSZ, Sci. Reports, 2013, 3(1), 1–6 Search PubMed
.
- R. A. D. Souza,
et al., Oxygen diffusion in nanocrystalline yttria-stabilized zirconia : the effect of grain boundaries, Phys. Chem. Chem. Phys., 2008, 10, 2067–2072 RSC
.
- R. A. De Souza, The formation of equilibrium space-charge zones at grain boundaries in the perovskite oxide SrTiO3, Phys. Chem. Chem. Phys., 2009, 11, 9939–9969 RSC
.
- M. De Ridder,
et al., Subsurface segregation of yttria in yttria stabilized zirconia, J. Appl. Phys., 2002, 92, 3056–3064 CrossRef CAS
.
- B. Arndt,
et al., Structure and stability of Gd-doped CeO2 thin films on yttria-stabilized zirconia, Thin Solid Films, 2016, 603, 56–61 CrossRef CAS
.
-
N. Shibata, F. Oba, T. Yamamoto and Y. Ikuhara, Grain-Boundary Atomic Structures in Zirconia Ceramics, Ceramic Engineering and Science Proceedings, 2008, ch. 16 Search PubMed
.
- S. Naoya, F. Obaz, T. Yamamoto and T. Sakuma, Atomic structure and solute segregation of a S = 3, [110]/{111} grain boundary in an yttria-stabilized cubic zirconia bicrystal, Philos. Mag. Lett., 2002, 82, 393–400 Search PubMed
.
- T. Nakagawa,
et al.,Oxygen diffusion blocking of single grain boundary in yttria-doped zirconia bicrystals, J. Mater. Sci., 2005, 40(12), 3185–3190 CrossRef CAS
.
- T. Arima, K. Fukuyo, K. Idemitsu and Y. Inagaki, Molecular dynamics simulation of yttria-stabilized zirconia between 300 and 2000 K, J. Mol. Liq., 2004, 113, 67–73 CrossRef CAS
.
- W. Araki and Y. Arai, Molecular dynamics study on oxygen diffusion in yttria-stabilized zirconia subjected to uniaxial stress in terms of yttria concentration and stress direction, Solid State Ionics, 2010, 181, 1534–1541 CrossRef CAS
.
- S. H. Guan, C. Shang and Z. P. Liu, Resolving the Temperature and Composition Dependence of Ion Conductivity for Yttria-Stabilized Zirconia from Machine Learning Simulation, J. Phys. Chem. C, 2020, 124, 15085–15093 CrossRef CAS
.
- R. Pornprasertsuk, P. Ramanarayanan, C. B. Musgrave and F. B. Prinz, Predicting ionic conductivity of solid oxide fuel cell electrolyte from first principles, J. Appl. Phys., 2005, 98, 103513 CrossRef
.
- T. van Dijk and A. J. Burggraaf, Grain boundary effects on ionic conductivity in ceramic GdxZr1–xO2–(x/2) solid solutions, Phys. status solidi, 1981, 63, 229–240 CrossRef
.
- O. J. Durá,
et al., Ionic conductivity of nanocrystalline yttria-stabilized zirconia: Grain boundary and size effects, Phys. Rev. B: Condens. Matter Mater. Phys., 2010, 81, 184301 CrossRef
.
- Y. Yamamura, S. Kawasaki and H. Sakai, Molecular dynamics analysis of ionic conduction mechanism in yttria-stabilized zirconia, Solid State Ionics, 1999, 126, 181–189 CrossRef CAS
.
- X. Li and B. Hafskjold, Molecular dynamics simulations of yttrium-stabilized zirconia, J. Phys. Condens. Matter, 1995, 7, 1255–1271 CrossRef CAS
.
Footnote |
| † Electronic supplementary information (ESI) available. See DOI: 10.1039/d1ta08309k |
| This journal is © The Royal Society of Chemistry 2022 |

