Distinction of charge transfer and Frenkel excitons in pentacene traced via infrared spectroscopy
Marko
Pinterić
ab,
Seulki
Roh
 a,
Sebastian
Hammer
 c,
Jens
Pflaum
 c,
Martin
Dressel
 a and
Ece
Uykur
 *ad
*ad
a1. Physikalisches Institut, Universität Stuttgart, 70569 Stuttgart, Germanyde. E-mail: e.uykur@hzdr.de
bFaculty of Civil Engineering, Transportation Engineering and Architecture, University of Maribor, SI-2000 Maribor, Slovenia
cExperimentelle Physik VI, Universität Würzburg, 97074 Würzburg, Germany
dHelmholtz-Zentrum Dresden-Rossendorf, Institute of Ion Beam Physics and Materials Research, D-01328 Dresden, Germany
First published on 15th March 2022
Abstract
Infrared spectroscopy studies on pentacene single crystals have been performed in the frequency range of 12 meV to 3 eV in reflection and transmission configurations as a function of temperature, down to 10 K. Our results reveal the dominant contributions of the excitonic bands at the absorption edge. The singlet transitions of the Frenkel excitons at 1.78 eV with 130 meV Davydov splitting have been identified. An additional excitonic feature observed at 1.83 eV can be assigned to a charge transferr type exciton evidenced by the strong vibrational anomalies. On the other hand, the strong feature seen at 1.67 eV does not couple to the vibrational modes and suggests an electronic origin in nature.
1 Introduction
Pentacene has emerged as a model organic semiconductor in the search for low-cost, flexible, large-scale opto-electronic devices.1–3 Its electronic and transport properties have been widely studied and leap towards the potential industrial applications in the form of highly ordered thin films.4–6 As the archetypical exothermic singlet fission material, pentacene has gained interest not only for a fundamental understanding of the relevant steps underlying this process7 but also for applications in new kind of photovoltaic cells exceeding the Shockley–Queisser limit by harvesting triplet excitons.8,9 Despite the progress achieved with these films, the large scale application goal is pending due to the lack of fundamental understanding of the material.Different polymorphs of pentacene have been reported in literature. The C-phase (Campbell phase)10 and the S-phase (Siegrist phase)11 are often referred to as the bulk crystal structure. On the other hand, the TF (thin film) structure is shown to be distinct from the bulk phases,12,13 but it can be converted to the C-phase with increasing film thickness and/or increasing growth temperature.14 The optical and electronic behaviors seem to reveal differences.15,16 Hence, it is not always intuitive to distinguish the microscopic properties of the pentacene molecules and the macroscopic properties of the related crystalline solid states. Therefore, studies on single crystals are highly desired. Theoretical and experimental efforts in this regard are also not scarce; however, a consensus on the nature of the observed electronic and optical features is not established yet.17–24
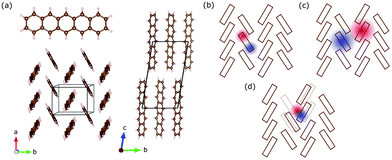
Pentacene (C22H14) is an archetypical organic semiconductor and – like many other organic compounds – its crystals consist of weakly interacting molecules. Bulk pentacene exhibits a triclinic crystal structure, where the unit cell contains two inequivalent organic molecules forming a herringbone pattern,16,25 as illustrated in Fig. 1(a). Electronic excitations are described in terms of intramolecular Frenkel excitons, where the bound electron–hole pair is confined within the same organic unit; and the intermolecular charge transfer (CT) excitons, where the electron–hole pair resides at adjacent organic units26,27 [Fig. 1(b and c)]. Compared to the Frenkel exctions, CT excitons usually possess only small oscillatory strength making these hard to excite and observe experimentally.3 The CT-like excitonic contributions are considered as an important ingredient in photovoltaic applications and fast singlet exciton fission rates in molecular solids,28–30 which has a potential to improve the power conversion efficiency of solar cells. Therefore, identifying the CT-like nature of the excitations at the absorption edge is crucial.
However, assigning the bands around the absorption edge is not very trivial. Earlier works assign the bands in the absorption edge solely to Frenkel-type excitons,27,31 while recent experimental studies32–35 and theoretical efforts22 suggest the admixture of CT excitons. Debates accelerate especially while similar lower energy features are discussed in terms of self-trapped excitons [Fig. 1(d)], which necessarily require the involvement of the underlying lattice.20,21,36 Advanced tools have been proposed and compared in several theoretical works to analyse the CT character of the bands.37,38 However, despite extensive efforts, the difficulty to obtain good agreement with experiments does not help the situation, either. With the advances in the singlet fission research, the low-lying bands are assigned to the intermediate state that precedes the fission into separate triplet excitons.39–41 Despite some challenges to this interpretation,42 most recent time-resolved studies suggest that it is plausible.43
Here, we have employed broadband infrared spectroscopy to study pentacene single crystals, where one can investigate the excitonic and vibrational features simultaneously. The vibrational features allow us to identify excitonic modes that couple to the lattice strongly, as they necessarily reflect the coupling in form of splitting and separation in energy.
2 Methods
Pentacene single crystals were grown by sublimation of purified material as explained elsewhere.15 The crystals form flat platelets with lateral dimensions of 5 × 5 mm2 and thickness up to 30 μm. Broadband optical measurements in the spectral range between 12–3100 meV have been performed with a commercial Bruker Vertex 80v Fourier-transform infrared spectrometer coupled to a Hyperion infrared microscope. An Oxford Mirostat He-flow cryostat is utilized for the temperature-dependent measurements down to 10 K allowing us to perform successive reflectivity and transmission measurement on the same measurement spot. As a reference spectrum, we have used freshly evaporated gold (low energy) and aluminum mirrors (high energy) in reflectivity configuration and vacuum for the transmission measurements. Reflectivity curves have been corrected for the reflection of the gold and aluminum.In the spectral range of the vibrational features the reflectivity of the sample is rather small and we can evaluate the absorption of the modes by using the Lambert–Beer law, α(ω)d = −ln{Tr(ω)}, where α(ω) is the frequency dependent absorption coefficient, d is the sample thickness and Tr(ω) is the transmission spectrum. However, the optical behavior in the vicinity of the band gap is dominated by the excitonic bands that appear both in reflection and transmission spectra strongly; therefore, we modelled our dielectric function in this energy range by using the input of both transmission and reflection. Taking into account both contributions allows us to evaluate full spectrum in a broad energy and temperature range. Here one can have a comparison with the absorption studies, albeit not a direct one.44 The imaginary part of the dielectric function consists of the refractive index (n) and the extinction coefficient (k) (ε2 = 2nk), whereas absorption coefficient is related with k.
3 Results and discussion
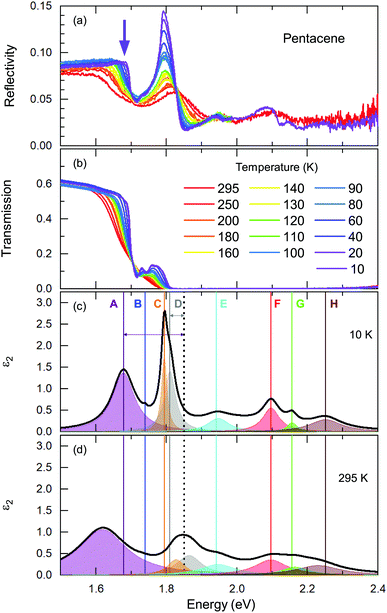
We start our discussion with the high-energy exciton modes. Our observation of the major excitonic bands is in accord with other studies.15,20,21,24Fig. 2 displays the temperature-dependent reflectivity and transmission spectra; the data are collected at exactly the same spot on the crystal. We have modelled the imaginary part of the dielectric function, ε2; a representative 10 K and a room temperature spectrum are presented in Fig. 2(c) and (d), respectively, together with all different contributions.Let us now address the different terms in more detail. Band C and Band E are the S0 → S1+ and S0 → S1− singlet transitions at ħω = 1.78 eV and 1.91 eV (at T = 10 K) that reflect the Davydov splitting of the singlet excitation. This splitting is expected in pentacene because the organic molecules form a herringbone arrangement with two translational-invariant molecules in the crystalline unit cell. The C band sits at 1.78 eV, in perfect agreement with theoretical calculations;22 this is also expected from crystalline films based on the extrapolation of the layer-dependent excitation energy.45 We observed a 130 meV Davydov splitting at room temperature that is in agreement with previous studies.15,20,21,24 The bands F, G, and H are located above the band gap, reflecting the vibronic progression of the S0 → S1 transition.
Band D is consistent with the absorption process21 observed in pentacene thin films and single crystals. Absorption studies have not identified Band A previously; however its energy range coincide with the bands reported within the photoluminescence studies20 along with the Band B. We should note that Band A overlaps with an electronic background and, therefore, it is not very easy to model it accurately. The intensity and the spectral weight of this mode might be overestimated. On the other hand, the temperature evolution of its position and the sharpening of the mode is more reliable. Another interesting observation is that this mode becomes visible mostly in the reflectivity process rather than transmission. A small upturn in the reflectivity spectra with decreasing temperature is noticed beyond the sharpening of the absorption edge (demonstrated with a purple arrow in Fig. 2(a)). This is not the case for the transmission data. We consider this as evidence that the observed Band A is not related with the absorption process only. We further suggest that it is seen as small traces in the emission process reported in photoluminescence studies.
These are the bands where a full consensus has not been reached yet. Band B is defined as the vibronic progression of Band A. Band A and Band D are discussed in terms of self-trapped excitons and/or a mixture of the charge transfer excitons that are located below the optical band gap. In principle, the self-trapped excitons are generated by the interplay of the electronic excitation with the intra-molecular vibronic and inter-molecular phononic modes. The created excitons interact inherently with the charge distribution of the surrounding lattice, thereby changing its local polarization, which lowers the potential energy of the exciton even further. Such an exciton–phonon/vibron interplay requires an electron–phonon coupling process and necessarily causes strong anomalies in the vibrational spectra, as well. At first glance, the binding energies can provide some guidance when searching for the vibration modes that could be involved in this self-trapped exciton formation. Considering that the exciton–phonon coupling is the only process contributing to the binding energies, this would provide a lower bound for the energy range of the vibrations. However, several different processes can contribute to the binding energy that might essentially lower the energy of the involved vibrations. Nonetheless, it would be a good starting point for tracking them down. In Fig. 2(c), the binding energies for Band A and D are depicted by arrows that can be estimated as Ebinding = Eabsorption − Eband; and it amounts to ∼150 meV and ∼40 meV for Band A and D, respectively. Here, we have used the absorption edge of 1.85 eV as often reported in experimental studies.23
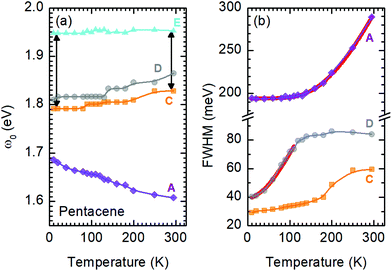
A more quantitative discussion regarding these bands can be offered based on their temperature behavior. Most of the bands become sharper with decreasing temperature, while they do not exhibit a significant shift with temperature. For the higher energy bands it is also ambiguous to assign any possible small shifts, as these modes are already broad and pretty low in intensity. Now let us take a look at the temperature dependence of B and C and the peculiar Bands A and D. As shown in Fig. 2c, we have modelled the imaginary part of our permittivity by taking into account eight Lorentzian contributions depicting different bands. The temperature evolution of these contributions has been traced for the strongest Bands A, C, and D, which are the bands of interests and the discussion of the present manuscript is focused on. The resonance frequencies along with the full-width at half maximum (FWHM) of the bands have been obtained from these fits and the results are displayed as a function of temperature in Fig. 3(a) and (b), respectively. As seen from Fig. 3(a), the Band C experiences a slight redshift with decreasing temperature resulting in a small increase of the Davydov splitting (black arrows): Commonly lowering the temperature causes a reduction of the herringbone angle46 that leads to an increase of the Davydov splitting.47 The FWHM [Γ(T)] of the bands are also presented in Fig. 3(b), where one can see a strong decrease for Band C down to 200 K followed by a linear progression all the way to lowest temperature. The initial decrease might be associated with the sudden stiffening of the crystal lattice related to the strain effects due to experimental setup, while below T = 200 K no further anomalies have been observed, except for the gradual change of the lattice parameters. These changes of the S0 → S1+ first Davydov component band suggest some structural anomalies in pentacene around 200 K, while below that temperature a gradual contraction of the lattice is evident.
The origin of Bands A and D is heavily debated in the literature. For that reason we now take a more detailed look into these bands along with the vibrational modes, which might affect these bands. The slight redshift is mimicked by the Band D, as well, while the FWHM of this band is rather peculiar. It shows a strong exponential decrease below ∼100 K, which is at odds with the expectations from only a pure lattice compression. Obviously another effect onto this band becomes dominant. Such exponential changes of the band-width parameter for the excitonic features have been discussed in terms of coupling to the longitudinal optical modes. This provides support for the commonly discussed origin of self-trapped exciton scenario.
In Fig. 3(b), the exciton–phonon coupling is depicted with the red solid line, where the independent boson model48
 | (1) |
Looking at Fig. 3(b) suggests that a similar exciton–phonon coupling scenario might apply for Band A, as well, and even extends to the entire measured temperature range. The estimated fit parameters for Band A are, Γ0 = 193.8 meV, σ = 0.01 meV K−1, A = 1000 meV, and ω0 = 397 meV. This more detailed analysis suggests that the parameters obtained for this band are not consistent with the expectation. While the coupling to the acoustic modes can still be neglected, the coupling to the optical mode is unusually strong. The energy suggested for the optical mode is much larger than the binding energy of this band at room temperature; it should be even smaller at the lowest temperatures due to the unusual blueshift of the band [Fig. 3(a)]. While, it is energetically possible that this vibration mode creates the self-trapping, the unusually strong coupling is something that requires attention. An alternative mechanism other than a strong phonon coupling might be at play for Band A, suggesting a different origin than self-trapped exciton scenario for this band.
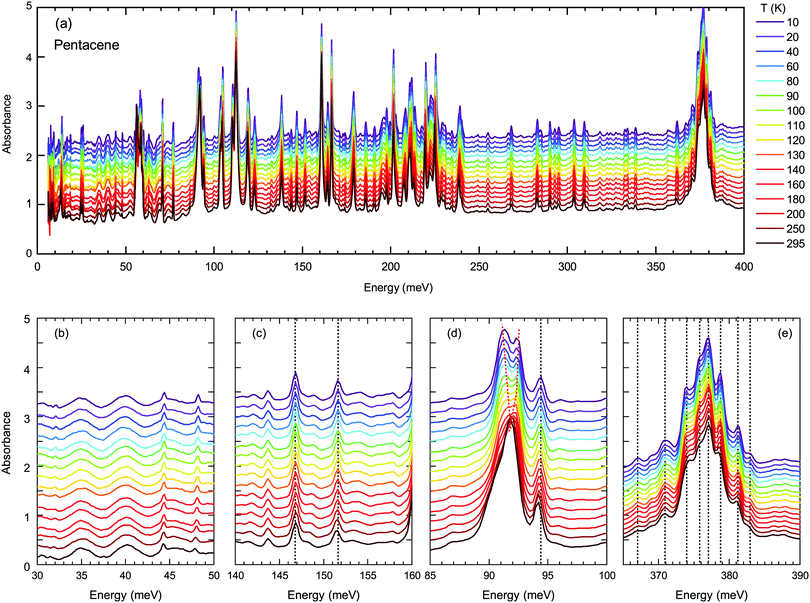
Next, we turn into the mid-infrared spectral range, where the vibrational fingerprints of the pentacene single crystals can be identified and are depicted in Fig. 4(a) in the full energy range. The spectrum is rich in this sense, as expected from the low symmetry of the molecular arrangement packing within the unit cell and the significantly larger degree of freedom that these molecules can possess. In the lower panels of Fig. 4, we have highlighted the modes estimated by the binding energies [Fig. 4(b and c)] and independent boson model [Fig. 4(d and e)].
As demonstrated in Fig. 4(b and c), the modes around binding energies for Band A and Band D are only small features, not very strong and do not show any anomalous behavior. The modes around the energies determined via independent boson analysis, on the other hand, are much stronger [Fig. 4(d and e)]. We should also point out that one of the strongest vibrational features in pentacene occurs in the energy range of 375 meV, that is fairly close to the obtained phonon energy for the independent Boson analysis for Band A (note, that there is no vibrational feature around 397 meV). Therefore, we present the vibration modes around this energy range in Fig. 4(e). The majority of the excitations show a gradual blueshift (or do not shift at all) with decreasing temperature, as represented by the dotted lines in Fig. 4, which is the expected variation of the vibrational/phonon modes in a system. Considering a harmonic approach, the stiffening of the bonds with decreasing temperature should result in a blue shift. The lack of any strong anomaly for neither of the modes associated with the Band A, suggest that indeed a mechanism other than the self-trapped exciton scenario is more plausible for Band A.
On the other hand, the mode around 90 meV that is associated with Band D shows a clear anomaly [shown with red lines in Fig. 4(d)] that is more significant below 100–120 K suggesting the strong involvement of an inter-molecular phonon mode. No splitting of the other modes can be identified, suggesting that there are no symmetry changes due to structural transitions and other forms should be considered. Charge fluctuations might be one plausible explanation. The dimer-like arrangement of the molecules in pentacene makes it a suitable candidate for the observation of these fluctuations, as often observed in organic conductors.
The electronic charge fluctuating within the dimer can be described by the Kubo formula
 | (2) |
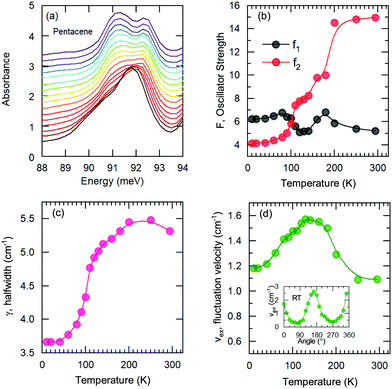
![[scr F, script letter F]](https://www.rsc.org/images/entities/char_e141.gif) = f1 + f2, where f1 and f2 are the oscillator strengths of the vibrational doublet located at ω1 and ω2 with the halfwidth, γ. The charge fluctuation velocity is given with vex, and Γ =γ + vex is the resulting width. The abbreviation
= f1 + f2, where f1 and f2 are the oscillator strengths of the vibrational doublet located at ω1 and ω2 with the halfwidth, γ. The charge fluctuation velocity is given with vex, and Γ =γ + vex is the resulting width. The abbreviation ![[scr R, script letter R]](https://www.rsc.org/images/entities/char_e531.gif) = 2γvex + γ2. Finally, the average and the weighted frequencies can be defined as, ωav and ωw, and given as
= 2γvex + γ2. Finally, the average and the weighted frequencies can be defined as, ωav and ωw, and given as | (3) |
 | (4) |
We have fitted the 90 meV mode with the Kubo formula given in eqn (2) and the parameters are depicted in Fig. 5(b–d), as oscillator strengths, halfwidth, and velocity, respectively. The results suggest that the high-temperature lattice changes are also reflected to this mode as all the parameters show a strong temperature dependence. On the other hand, even stronger effects are observed below approximately 100 K as the reduction of the fluctuation rate and the halfwidth. Furthermore a reversal of the oscillator strength distribution accompanies the anomalies; this advocates the strong effect of the charge induced phenomena. We should note, however, the charge fluctuations are still considerable even at lowest temperature. Despite the reduction, the fluctuation velocity is still sizeable. Furthermore, although the oscillator strength, which reflects the fluctuating charge density, initially decreases consistently with the freezing of the some portion of these charges with decreasing temperature; the lack of distinctly separated sharp modes suggest that the fluctuation regime is still dominant at low temperatures. The sizeable halfwidth of the modes also support this idea. Combining the observations of the vibrational features and the temperature dependence of the bandwidth, we propose that the Band D is essentially a charge transfer exciton, that is localized due to the strong interaction with the molecular vibrations caused by the charge fluctuations within the dimer formation of the pentacene molecules. We should note in passing that recent time-dependent Raman studies performed on functionalized pentacene dimer thin films also point towards the importance of the vibrational mode located at the same energy range.50 While at ground-state conditions it is relatively weak, upon pumping a significant enhancement is observed. This makes the presence of dimerized pentacene molecules and their coupling to the excitonic modes plausible. The dimer idea is also supported by the angular dependence of the fit parameters. In the inset of Fig. 5(d), the fluctuation velocity is presented, which disappears at certain angles that are perpendicular to the dimer orientations.
Now let us turn to the Band A. Since strong vibrational anomalies are lacking, the observed band cannot be explained by the self-trapped exciton scenario. This evidences the electronic origin for the Band A. Within the current study it is not easy to pinpoint the exact origin for this band; however, the results can be compared with different possibilities.
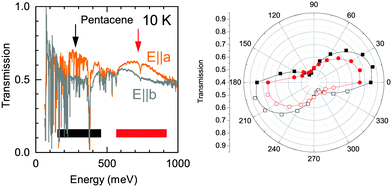
The detailed look to the overall electronic background in the polarization dependent spectra, on the other hand, reveals a possible explanation to this band. In Fig. 6, we show the transmission spectra along a and b axes in the mid-infrared range (Here, a and b-axes denote the optical axes and not the crystallographic axes). While the spectra are dominated by numerous vibrational modes, a clear broad electronic background centered around ħω = 200 meV emerges in the spectra along a-axis, possible with a second harmonics of the observed feature at higher energy range with an approximately 300 meV width. This strongly suggests an electronic origin for the Band A rather than a vibronic one as a credible explanation. We have also presented the polarization dependence of these electronic backgrounds in Fig. 6. As can be seen in right panel, both of the features follow the same polarization dependence with approximately 80–90 degree between the principle axes indicating that the observed electronic features are in line with the optical axes of the crystal. We should also note that it is not easy to pin these features to the crystallographic axes, as the pentacene crystal possess a triclinic symmetry, and hence a mixture of the out of plane response is expected in the in plane measurements, as well.19
The energy range of this band also matches remarkably well with the 1(TT) triplet state of pentacene that emits via a Herzberg Teller (HT) process.43 This process is discussed to be important in polyacenes that also require the involvement of vibronic modes. Vibronically important normal modes that are related to the HT process are calculated for pentacene, tetracene and hexacene; furthermore, it has been shown that they are enhanced for the brominated counterparts.51,52 In these calculations the excitation at 1.59 eV (excitation closest to the band of interest) were associated with the vibronic modes along a-axis. The comparison of the dominant a-axis vibronic modes with our absorption study reveals an interesting observation: One of these modes, ≈59 meV mode, has strong temperature-dependent anomalies, as we demonstrate in Fig. 7. The same figure also shows that this feature experiences a strong splitting at low temperatures. Considering the lack of any structural instabilities at low temperatures for pentacene, this unusual behavior indicates a strong coupling to the electronic background that also supports the observation of a 1(TT) state via the HT process. On the other hand, the vibronic nature of the investigated band has not been resolved; hence it is not clear at the moment whether the observed anomalous vibronic mode has a dominant effect or not. This is an interesting point to be taken into account and further studies in this regard are necessary. We should also mention in passing that it is energetically possible that this 59 meV mode is involved in the process of Band D; this also strengthen the idea of self-trapped-exciton for the Band D.
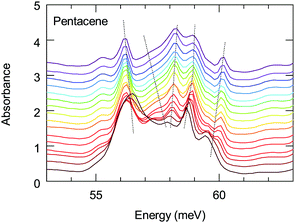 | ||
| Fig. 7 Temperature dependence of the absorption of the low-energy 59 meV mode. Dotted lines are guides to the behavior of the modes. | ||
4 Conclusions
We have measured the optical properties of pentacene single crystals in a broad spectral range in order to comparatively study the high energy excitonic and the low energy vibrational features. Our findings are consistent with previous reports; for instance, we could clearly identify the main exciton bands. Particular emphasis was devoted to the highly debated exciton modes (Band A and Band D), which we investigated in depth.The temperature dependence of the Band D suggests a possible coupling of this exciton mode to the vibrational features at around 90 meV. This estimate is supported by the strong anomalies observed for the 90 meV vibrational feature in the temperature range of 100 to 120 K. The vibrational anomalies can be explained by charge fluctuations suggesting a possible localization of Band D due to trapping by these strong fluctuations within the dimer arrangement of pentacene molecules; in other words this observation essentially classifies this band as a charge transfer exciton.
The lack of any vibrational anomaly with Band A suggests that this band has a different origin. Due to the broad electronic background observed around 250 meV, we suggest an electronic origin as a more plausible explanation for the observed Band A rather than the self-trapped exciton scenario. Recently proposed 1(TT) state emission via a Herzberg Teller process has also been discussed within the frame of coupling to vibronic modes Although one of the a-axis normal modes strongly couples to the electronic background, it is not clear if this is a dominant mode in the process of Band A. Further studies are required to clarify this point.
Author contributions
MD and JP conceptualized the work. MP conducted the experiments with the assistance of SR and EU. EU analysed the data. SH grew the crystals with the help of JP. EU and MD wrote the manuscript with the contributions from all authors.Conflicts of interest
Authors declare no conflicts.Acknowledgements
Authors acknowledge the fruitful discussions with Olga Iakutkina and the technical support from Gabriele Untereiner. E. U. acknowledges the European Social Fund and the Baden-Württemberg Stiftung for the financial support of this research project by the Eliteprogramme. J. P., and S. H. acknowledge the Bavarian State Ministry for Science and the Arts for funding within the collaborative research network “Solar Technologies go Hybrid” (SolTech). The work was supported by the Deutsche Forschungsgemeinschaft (DFG) via DR228/48-1 (Stuttgart) and PF385/11-1 (Würzburg).Notes and references
- S. R. Forrest, Nature, 2004, 428, 911–918 CrossRef CAS PubMed.
- A. Hagfeldt and M. Grätzel, Acc. Chem. Res., 2000, 33, 269–277 CrossRef CAS PubMed.
- S. Hammer, C. Zeiser, M. Deutsch, B. Engels, K. Broch and J. Pflaum, ACS Appl. Mater. Interfaces, 2020, 12, 53547–53556 CrossRef CAS PubMed.
- C. D. Dimitrakopoulos, A. R. Brown and A. Pomp, J. Appl. Phys., 1996, 80, 2501–2508 CrossRef CAS.
- Y. Jin, Z. Rang, M. I. Nathan, P. P. Ruden, C. R. Newman and C. D. Frisbie, Appl. Phys. Lett., 2004, 85, 4406–4408 CrossRef CAS.
- S. Yang, K. Shin and C. Park, Adv. Funct. Mater., 2005, 15, 1806–1814 CrossRef CAS.
- H. Seiler, M. Krynski, D. Zahn, S. Hammer, Y. W. Windsor, T. Wasileiadis, J. Pflaum, R. Ernstorfer, M. Rossi and H. Schwoerer, Sci. Adv., 2021, 7, eabg0869 CrossRef CAS PubMed.
- D. N. Congreve, J. Lee, N. J. Thompson, E. Hontz, S. R. Yost, P. D. Reusswig, M. E. Bahlke, S. Reineke, T. V. Voorhis and M. A. Baldo, Science, 2013, 340, 334 CrossRef CAS PubMed.
- A. Rao and R. H. Friend, Nat. Rev. Mater., 2017, 2, 17063 CrossRef CAS.
- R. B. Campbell, J. M. Robertson and J. Trotter, Acta Crystallogr., 1962, 15, 289–290 CrossRef CAS.
- T. Siegrist, C. Kloc, J. H. Schön, B. Batlogg, R. C. Haddon, S. Berg and G. A. Thomas, Angew. Chem., Int. Ed., 2001, 40, 1732–1736 CrossRef CAS.
- R. Ruiz, D. Choudhary, B. Nickel, T. Toccoli, K.-C. Chang, A. C. Mayer, P. Clancy, J. M. Blakely, R. L. Headrick, S. Iannotta and G. G. Malliaras, Chem. Mater., 2004, 16, 4497–4508 CrossRef CAS.
- S. Schiefer, M. Huth, A. Dobrinevski and B. Nickel, J. Am. Chem. Soc., 2007, 129, 10316–10317 CrossRef CAS PubMed.
- I. Bouchoms, W. Schoonveld, J. Vrijmoeth and T. Klapwijk, Synth. Met., 1999, 104, 175–178 CrossRef CAS.
- D. Faltermeier, B. Gompf, M. Dressel, A. K. Tripathi and J. Pflaum, Phys. Rev. B: Condens. Matter Mater. Phys., 2006, 74, 125416 CrossRef.
- C. Ambrosch-Draxl, D. Nabok, P. Puschnig and C. Meisenbichler, New J. Phys., 2009, 11, 125010 CrossRef.
- T. C. Berkelbach, M. S. Hybertsen and D. R. Reichman, J. Chem. Phys., 2014, 141, 074705 CrossRef PubMed.
- N. J. Hestand, H. Yamagata, B. Xu, D. Sun, Y. Zhong, A. R. Harutyunyan, G. Chen, H.-L. Dai, Y. Rao and F. C. Spano, J. Phys. Chem. C, 2015, 119, 22137–22147 CrossRef CAS.
- M. Dressel, B. Gompf, D. Faltermeier, A. Tripathi, J. Pflaum and M. Schubert, Opt. Express, 2008, 16, 19770–19778 CrossRef CAS PubMed.
- F. Anger, J. O. Ossó, U. Heinemeyer, K. Broch, R. Scholz, A. Gerlach and F. Schreiber, J. Chem. Phys., 2012, 136, 054701 CrossRef CAS PubMed.
- D. Qi, H. Su, M. Bastjan, O. D. Jurchescu, T. M. Palstra, A. T. S. Wee, M. Rübhausen and A. Rusydi, Appl. Phys. Lett., 2013, 103, 113303 CrossRef.
- M. L. Tiago, J. E. Northrup and S. G. Louie, Phys. Rev. B: Condens. Matter Mater. Phys., 2003, 67, 115212 CrossRef.
- T. Aoki-Matsumoto, K. Furuta, T. Yamada, H. Moriya, K. Mizuno and A. H. Matsui, Int. J. Mod. Phys. B, 2001, 15, 3753–3756 CrossRef CAS.
- C. Cocchi, T. Breuer, G. Witte and C. Draxl, Phys. Chem. Chem. Phys., 2018, 20, 29724–29736 RSC.
- D. Nabok, P. Puschnig, C. Ambrosch-Draxl, O. Werzer, R. Resel and D.-M. Smilgies, Phys. Rev. B: Condens. Matter Mater. Phys., 2007, 76, 235322 CrossRef.
- E. A. Silinsh, Organic Molecular Crystals: Their Electronic States, Springer Verlag, Berlin, 1980 Search PubMed.
- M. Pope and C. E. Swenberg, Electronic Processes in Organic Crystals and Polymers, Oxford University Press, Oxford, 1999 Search PubMed.
- M. W. B. Wilson, A. Rao, J. Clark, R. S. S. Kumar, D. Brida, G. Cerullo and R. H. Friend, J. Am. Chem. Soc., 2011, 133, 11830–11833 CrossRef CAS PubMed.
- W.-L. Chan, M. Ligges, A. Jailaubekov, L. Kaake, L. Miaja-Avila and X.-Y. Zhu, Science, 2011, 334, 1541 CrossRef CAS PubMed.
- C. Zeiser, C. Cruz, D. R. Reichman, M. Seitz, J. Hagenlocher, E. L. Chronister, C. J. Bardeen, R. Tempelaar and K. Broch, Nat. Commun., 2021, 12, 5149 CrossRef CAS PubMed.
- V. Zanker and J. Preuss, Angew. Phys., 1969, 27, 363 CAS.
- M. Grobosch, R. Schuster, T. Pichler, M. Knupfer and H. Berger, Phys. Rev. B: Condens. Matter Mater. Phys., 2006, 74, 155202 CrossRef.
- R. Schuster, M. Knupfer and H. Berger, Phys. Rev. Lett., 2007, 98, 037402 CrossRef CAS PubMed.
- H. Yamagata, J. Norton, E. Hontz, Y. Olivier, D. Beljonne, J. L. Brédas, R. J. Silbey and F. C. Spano, J. Chem. Phys., 2011, 134, 204703 CrossRef CAS PubMed.
- N. J. Hestand, C. Zheng, A. R. Penmetcha, B. Cona, J. A. Cody, F. C. Spano and C. J. Collison, J. Phys. Chem. C, 2015, 119, 18964–18974 CrossRef CAS.
- R. He, X. Chi, A. Pinczuk, D. V. Lang and A. P. Ramirez, Appl. Phys. Lett., 2005, 87, 211117 CrossRef.
- B. M. Wong and T. H. Hsieh, J. Chem. Theory Comput., 2010, 6, 3704–3712 CrossRef CAS PubMed.
- R. M. Richard and J. M. Herbert, J. Chem. Theory Comput., 2011, 7, 1296–1306 CrossRef CAS PubMed.
- P. M. Zimmerman, Z. Zhang and C. B. Musgrave, Nat. Chem., 2010, 2, 648–652 CrossRef CAS PubMed.
- E. C. Greyson, J. Vura-Weis, J. Michl and M. A. Ratner, J. Phys. Chem. B, 2010, 114, 14168–14177 CrossRef CAS PubMed.
- P. M. Zimmerman, F. Bell, D. Casanova and M. Head-Gordon, J. Am. Chem. Soc., 2011, 133, 19944–19952 CrossRef CAS PubMed.
- C. B. Dover, J. K. Gallaher, L. Frazer, P. C. Tapping, A. J. Petty, M. J. Crossley, J. E. Anthony, T. W. Kee and T. W. Schmidt, Nat. Chem., 2018, 10, 305–310 CrossRef CAS PubMed.
- D. G. Bossanyi, M. Matthiesen, S. Wang, J. A. Smith, R. C. Kilbride, J. D. Shipp, D. Chekulaev, E. Holland, J. E. Anthony, J. Zaumseil, A. J. Musser and J. Clark, Nat. Chem., 2021, 13, 163–171 CrossRef CAS PubMed.
- M. Dressel and G. Grüner, Electrodynamics of Solids, Cambridge University Press, Cambridge, 2002 Search PubMed.
- R. He, N. G. Tassi, G. B. Blanchet and A. Pinczuk, Appl. Phys. Lett., 2010, 96, 263303 CrossRef.
- S. Haas, B. Batlogg, C. Besnard, M. Schiltz, C. Kloc and T. Siegrist, Phys. Rev. B: Condens. Matter Mater. Phys., 2007, 76, 205203 CrossRef.
- I. Meyenburg, T. Breuer, A. Karthäuser, S. Chatterjee, G. Witte and W. Heimbrodt, Phys. Chem. Chem. Phys., 2016, 18, 3825–3831 RSC.
- S. Rudin, T. L. Reinecke and B. Segall, Phys. Rev. B: Condens. Matter Mater. Phys., 1990, 42, 11218–11231 CrossRef CAS PubMed.
- A. Girlando, M. Masino, S. Kaiser, Y. Sun, N. Drichko, M. Dressel and H. Mori, Phys. Status Solidi B, 2012, 249, 953–956 CrossRef CAS.
- C. Schnedermann, A. M. Alvertis, T. Wende, S. Lukman, J. Feng, F. A. Y. N. Schröder, D. H. P. Turban, J. Wu, N. D. M. Hine, N. C. Greenham, A. W. Chin, A. Rao, P. Kukura and A. J. Musser, Nat. Commun., 2019, 10, 4207 CrossRef PubMed.
- Y. Qian, X. Li, A. R. Harutyunyan, G. Chen, Y. Rao and H. Chen, J. Phys. Chem. A, 2020, 124, 9156–9165 CrossRef CAS PubMed.
- Y. Qian, T. Zhang, J. Han, A. R. Harutyunyan, G. Chen, Y. Rao and H. Chen, J. Phys. Chem. A, 2021, 125, 3589–3599 CrossRef CAS PubMed.
| This journal is © The Royal Society of Chemistry 2022 |

