1,4-Bis(trifluoromethyl)benzene as a new acceptor for the design and synthesis of emitters exhibiting efficient thermally activated delayed fluorescence and electroluminescence: experimental and computational guidance†
Levani
Skhirtladze
a,
Karolis
Lietonas
a,
Audrius
Bucinskas
a,
Dmytro
Volyniuk
 a,
Malek
Mahmoudi
a,
Omar
Mukbaniani
b,
Kai Lin
Woon
a,
Malek
Mahmoudi
a,
Omar
Mukbaniani
b,
Kai Lin
Woon
 *c,
Azhar
Ariffin
 *ad and
Juozas V.
Grazulevicius
 *a
*a
aDepartment of Polymer Chemistry and Technology, Faculty of Chemical Technology, Kaunas University of Technology, Lithuania. E-mail: juozas.grazulevicius@ktu.lt
bDepartment of Chemistry, Faculty of Exact and Natural Sciences, Tbilisi State University, Tbilisi, Georgia
cLow Dimensional Material Research Centre, Department of Physics, University Malaya, Kuala Lumpur, Malaysia. E-mail: ph7klw76@um.edu.my
dDepartment of Chemistry, Faculty of Science, University Malaya, Kuala Lumpur, Malaysia. E-mail: azhar70@um.edu.my
First published on 15th February 2022
Abstract
1,4-Bis(trifluoromethyl)benzene as a new acceptor with hydrogen bonding sites together with phenoxazine, phenothiazine or 9,9-dimethyl-9-10-dihydroacridine as donor moieties was used for the design and synthesis of compounds with symmetrical donor–acceptor–donor architectures as emitters exhibiting thermally activated delayed fluorescence (TADF). The molecules exhibited large dihedral angles between the donor and acceptor moieties which are close to 80° as was shown by single crystal X-ray analysis and theoretical calculations. The compounds showed very broad charge-transfer-state (1CT) absorption which can be accounted for by multiple 1CTs as indicated by quantum molecular dynamics simulations. The magnitude of oscillatory strength increases with deviation away from the orthogonality of the dihedral angle between the donor and acceptor and the presence of in-plane bending of the two donors where the donors swing back and forth with respect to the acceptor at C–N bonds. The localised triplet excited states (3LEs) were experimentally obtained. Although a very small and similar singlet and triplet splitting of ca. 20 meV was observed for the compounds, its reverse intersystem crossing rates were different and ranged from 1.92 × 10⁴ to 5.45 × 10⁵ s−1 due to the different energy gap between the 1CT and 3LE. A 9,9-dimethyl-9-10-dihydroacridine based compound was shown to be a promising cyan TADF emitter. The selection of the right donor with the appropriate 3LE that matches the charge transfer states is important to obtain an efficient TADF emitter. The X-Ray study of the packing pattern in the crystals of the compounds revealed that the molecules are held together through many weak van der Waals intramolecular bonds, which are formed between the CF3 fluorine atoms and hydrogen atoms of methyl groups or the carbon and hydrogen atoms of phenyl rings (C–H⋯F, C–F⋯N, C–H⋯H and C–H⋯C with distances smaller than 2.85 Å). Because of that, this compound emitted cyan electroluminescence with unusually stable colours at different emitter concentrations and different voltages in devices. The efficiency at a brightness of 1000 cd m−2 was practically the same as the maximum one due to the extremely low efficiency roll-off.
1. Introduction
The triplet state of a metal-free organic emitter is often characterized as a dark state as the emission is quantum mechanically forbidden. In a typical donor–acceptor TADF, this dark state can be converted into a bright state through spin–orbit coupling via the use of heavy metals such as iridium1 or through reverse intersystem crossing if the energy gap between the triplet (T) and singlet states (S) is less than 0.1 eV.2 The former is the phosphorescent emitter often referred to as a second-generation emitter while the latter often referred to as an emitter exhibiting thermally activated delayed fluorescence (TADF) is a third-generation emitter.3 The energy gap between S and T is related to the exchange interaction energy of the system.4 To minimize the exchange interaction energy, conformational twisting between the donor (D) and acceptor (A) is used to minimize the overlap between the highest occupied molecular orbital (HOMO) and the lowest unoccupied molecular orbital (LUMO). As a result, different combinations of donors and acceptors have been explored in the design of TADF emitters. Common donors are carbazole,5–7 phenoxazine,8–10 phenothiazine,11,12 and 9,9-dimethyl-9-10-dihydroacridine,13–15 while common acceptors are triphenyltriazine,9,16–18 sulfonyl groups,19,20 and cyano groups.21,22 Cyano and sulfonyl groups are strong electron-withdrawing moieties. Fluorine is also a strong electron-withdrawing group and it has been used as a substituent for the cyano group.23,24 Such substitution often results in red shifting of the emission spectra. Because of the close proximity of fluorine atoms, the resonance between the π electrons with the 3 lone pairs of electrons can increase the effective conjugation. It is expected that these lone pairs of electrons can participate in π-conjugation and hence increase the extent of electron delocalization of the acceptor.25,26 The electron-accepting and red-shifting abilities are beneficial for obtaining a small singlet–triplet splitting and promoting reverse intersystem crossing. Highly efficient TADF was observed for molecules containing acceptors with abilities to form intramolecular C–H⋯F hydrogen bonds.27 However, the molecular structures of those TADF emitters were very complicated including two electron-accepting difluorocyanobenzene units and seven electron-donating carbazole moieties linked through a diphenylene bridge. Due to such complexity, the advantages of intramolecular non-covalent interactions were not well understood. Using simpler molecular structures, in this work, we provide experimental and computational guidance for the development of TADF emitters with a large number of intramolecular non-covalent interactions.Hence, a new acceptor, 1,4-bis(trifluoromethyl)benzene (2CF3Ph), containing 6 fluorine atoms is explored, expecting the appearance of intramolecular non-covalent interactions. In many cases, one of the key parameters to obtain high internal quantum efficiency is an efficient reverse intersystem crossing between the triplet charge-transfer states (3CTs) and the singlet charge-transfer states (1CTs). This process is mediated by vibronic coupling between a 3CT and a locally excited triplet state (3LE).28–30 When the energy gap between all these three states becomes small, reverse intersystem crossing becomes efficient. The 2CF3Ph moiety has a short conjugated system. The lowest local triplet state of fluorinated benzene is above 3.5 eV.31,32 The contribution of the triplet locally excited (3LEA) state of the 2CF3Ph acceptor to the overall 3LE of D–A–D TADF will be minimal. Hence, the 3LE state is expected to be contributed mainly by the donor moiety. Phenoxazine (PO), phenothiazine (PS), and 9,9-dimethyl-9-10-dihydroacridine (AC) were selected as the donors configured with symmetrical D–A–D architectures in which D and A moieties are bridged through C–N bonds as shown in Scheme 1. The near orthogonality between the donor and acceptor moieties as a result of large steric hindrance from the extended bis(trifluoromethyl) group in these symmetrical D–A–D systems ensures strong decoupling of electrons on the D and A in the CT state which helps to reduce the singlet–triplet energy splitting. The best TADF emitter demonstrated cyan electroluminescence with unusually stable colours at different emitter concentrations and different voltages. In addition, the efficiency was practically the same at a brightness of up to 1000 cd m−2 due to the extremely low efficiency roll-off. These results can be explained by weak van der Waals intramolecular interactions that exist between the fluorine atoms of the CF3 group and methyl hydrogen atoms or carbon and hydrogen atoms of phenyl rings (C–H⋯F, C–F⋯N, C–H⋯H and C–H⋯C).27 Thus, the positive effects of intramolecular non-covalent interactions on the TADF properties are demonstrated.
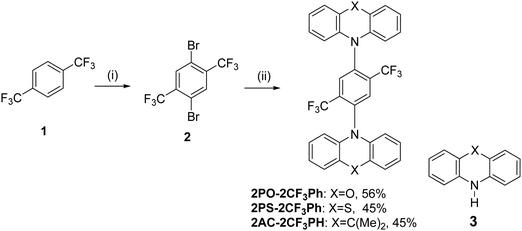 | ||
| Scheme 1 Synthesis of 2,5-bis(trifluorometyl)-1,4-phenylene derivatives: (i) H2SO4, H2O, TFA, reflux; NBS, r.t. 5 h; 60 °C 48 h (II) 3, Pd2(dba)3, X-Phos, t-BuONa, toluene, reflux, 24 h. | ||
2. Experimental section
In the ESI,† a detailed description of the general procedure for the synthesis of target derivatives and the experimental and theoretical techniques used for their characterization are presented.OLEDs ware fabricated using glass substrates with pre-patterned bottom indium tin oxide (ITO) electrodes (from Ossila company). Additional materials such as molybdenum oxide (MoO3), N,N′-di(1-naphthyl)-N,N′-diphenyl-(1,1′-biphenyl)-4,4′-diamine (NPB), tris(4-carbazoyl-9-ylphenyl)amine (TCTA), 3,3′-di(9H-carbazol-9-yl)-1,1′-biphenyl (mCBP), 3,5-di(9H-carbazol-9-yl)tetraphenylsilane (SimCP2), diphenyl-4-triphenylsilyl-phenylphosphineoxide (TSPO1), 2,2′,2′′-(1,3,5-benzinetriyl)-tris(1-phenyl-1-H-benzimi-dazole) (TPBi), and lithium fluoride (LiF) were used as received from Ossila, Sigma-Aldrich or Lumtec companies. The reference device was fabricated using 2,7-di-tert-butyl-9,9-dimethyl-10-(perfluoro-[1,1′-biphenyl]-4-yl)-9,10-dihydroacridine (PFBP-2a) as an emitter which was synthesized according the previously published procedure.33
3. Results and discussion
3.1 Synthesis
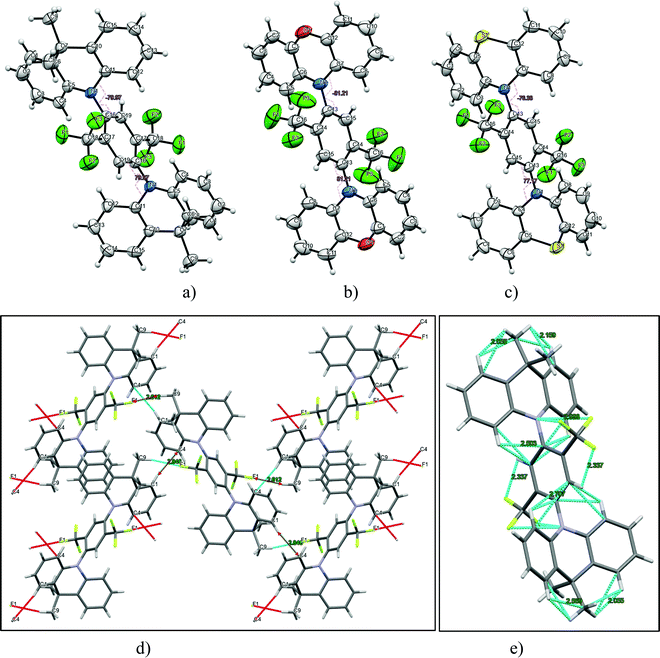
The synthesis of 2,5-bis(trifluomethyl)-1,4-phenylene derivatives is shown in Scheme 1. Buchwald–Hartwig coupling reactions of 1,4-dibromo-2,5-bis(trifluoromethyl)benzene (2) with phenoxazine, phenothiazine or 9,10-dihydro-9,9-dimethylacridine in the presence of tris(dibenzylideneacetone)dipalladium(0) and X-Phos at 110 °C gave the target D–A–D type compounds. The structures of the synthesized compounds, except that of 2PO-2CF3Ph, were confirmed by 1H and 13C NMR spectroscopy. It was not possible to confirm the structure of 2PO-2CF3Ph by 1H and 13C NMR due to solubility problems in all available deuterated solvents. However, we were able to confirm the structure by single crystal X-ray analysis. The single crystal X-ray crystallography data show that the dihedral angle between the donor and acceptor is 85.5° (Fig. 1).3.2. X-Ray analysis
Additionally, the structures of 2PO-2CF3Ph, 2PS-2CF3Ph and 2AC-2CF3Ph were confirmed using X-ray methodology. Single crystals of each compound were grown from dilute THF solution. 2AC-2CF3Ph and 2PO-2CF3Ph compounds crystallize in the P21/c monoclinic space group while, in the case of 2PO-2CF3Ph, the monoclinic C2/c space group was found. The Oak Ridge Thermal Ellipsoid Plot (ORTEP) projections show (Fig. 1a–c) that all target compounds are symmetrical. In addition, an X-ray study of the packing pattern in the crystal revealed that molecules are held together through weak van der Waals intermolecular bonds, which appear between CF3 fluorine and methyl hydrogen atoms or carbon and hydrogen atoms of the phenyl ring. For example, in the case of 2AC-2CF3Ph, C–H⋯F and C–H⋯C were found and their distances ranged from 2.61 to 2.85 Å (Fig. 1d). Additionally, the following weak intramolecular bonds (distance < 2.71 Å) are present: C–H⋯F, C–F⋯N, C–H⋯H, and C–H⋯C. Electron-donating moieties (acridine, phenoxazine and phenothiazine) found in the corresponding compounds (2PO-2CF3Ph, 2PS-2CF3Ph and 2AC-2CF3Ph) are non-planar, i.e. they are twisted by 15°, 30° and 31°, respectively. As for TADF emitters, the significant factor is a large torsional angle between the donor and acceptor fragments.34 For all three investigated compounds (2PO-2CF3Ph, 2PS-2CF3Ph and 2AC-2CF3Ph), the torsional angles between 1,4-bis(trifluoromethyl)benzene and phenoxazine phenothiazine, and acridine moieties were found to be 81.2°, 80.0°, and 77.2°, respectively.3.3. Frontier orbitals
DFT simulations were performed to investigate the molecular structures. Their optimized structures are shown in Fig. 2. The molecules exhibited large dihedral angles of 81.3°, 84.8°, and 82.0° between the donor and acceptor moieties for 2PO-2CF3Ph, 2PS-2CF3Ph, and 2AC-2CF3Ph, respectively. This is in close agreement with the single crystal data. The values of dihedral angles are very close to the experimental X-ray data obtained. The near orthogonal angle between the donor and acceptor is helpful for the efficient separation of frontier molecular orbitals. 9,9-Dimethyl-9-10-dihydroacridine and phenothiazine exhibited a saddle structure with the carbon and sulphur bending away from the planar structure at angles of 29.5° and 30.3°, respectively, while phenoxazine is rather flat. This is confirmed through X-ray data except for phenoxazine which is slightly saddled (∼15°) rather than flat. The HOMOs are equally distributed on the two units of donors and the LUMO is concentrated on 2CF3Ph as seen in Fig. 2. For HOMOs, there is a small overlapping of electron clouds with the LUMOs, which is crucial for increasing the oscillatory strength of the emitters. The nodes at the acceptor at the HOMO level are the antinodes of the LUMO level. The LUMO extends the electron clouds into the trifluoromethyl groups. A closer inspection indicates that the Sigma-bond of C–F is hyperconjugated with the π bonds of the benzene rings while the lone pairs of fluorine atoms interact with the hyperconjugated carbon, resulting in resonance/electron delocalization that extends from the benzene π-electrons to the fluorine lone pair of electrons.25,26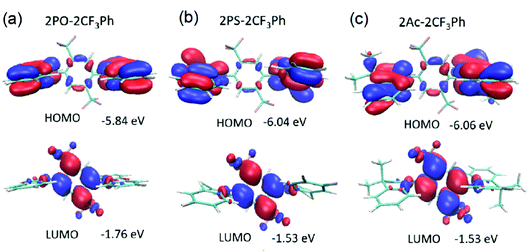 | ||
| Fig. 2 HOMO and LUMO along with their energy levels for (a) 2PO-2CF3Ph, (b) 2PS-2CF3Ph and (c) 2Ac-2CF3Ph. Note there is no total separation of HOMO and LUMO electron clouds. | ||
The HOMO energies of 2PO-2CF3Ph, 2PS-2CF3Ph, and 2AC-2CF3Ph were found to be 5.84 eV, −6.04 eV, and −6.06 eV, respectively, while the LUMO energies were −1.76 eV, −1.53 eV and −1.53 eV, respectively. The HOMO and LUMO of 2PO-2CF3Ph are deeper than those of the other compounds studied since the oxygen atom in PO enhances the pull-push electron effect of 2PO-2CF3Ph. The ionization potentials were determined using the oxidation onset (Eonset) in cyclic voltammetry (CV) curves relative to the Ag/Ag+ reference electrode. The derived values for 2PO-2CF3Ph, 2PS-2CF3Ph and 2AC-2CF3Ph were found to be −5.31 eV, −5.38 eV and −5.36 eV, respectively. These values cannot be directly related to the ionization potentials of 2PO-2CF3Ph, 2PS-2CF3Ph and 2AC-2CF3Ph.35 According to photoelectron spectroscopy measurements in air, ionization potential values of 6.01, 6.05, and 6.08 eV were obtained for the films of 2PO-2CF3Ph, 2PS-2CF3Ph and 2AC-2CF3Ph, respectively (Fig. S1d, ESI†). Considering the charge transport in the solid state, ionization potentials estimated by photoelectron spectroscopy have to be used. For example, an ionization potential of 6.08 eV for 2AC-2CF3Ph was used for the selection of OLED structures as will be shown below.
3.4. Molecular dynamics simulation
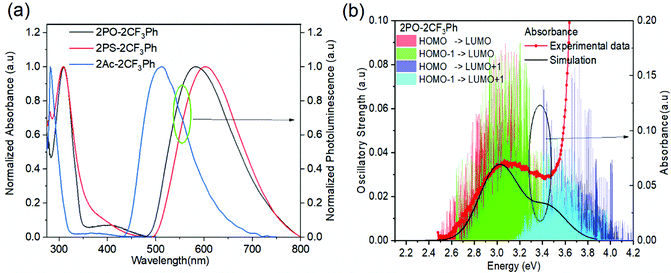
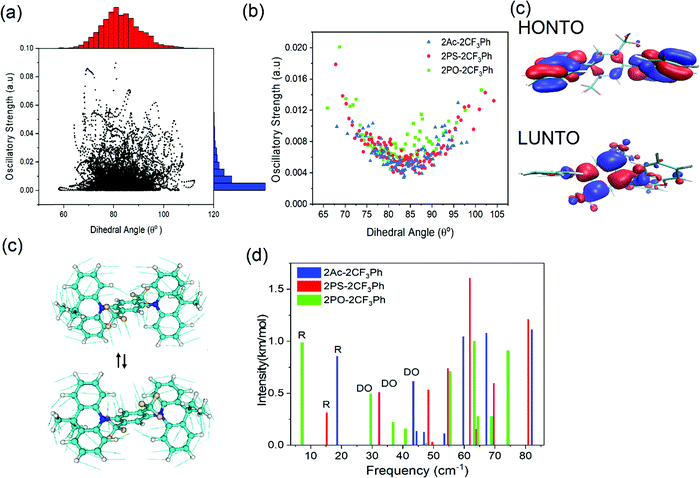
The photophysical properties of the compounds were analysed by measuring the UV-vis absorption and photoluminescence (PL) spectra of their toluene solutions at room temperature as shown in Fig. 3. High-energy absorption peaks observed below 350 nm can be assigned to the n–π*/π–π* transitions from the donors. Very broad absorption from 350 nm to 500 nm can be designated as CT absorption peaks from the donor to acceptor units. The natural transition orbital analysis based on time-dependent DFT for 1CT and 3CT states indicates that the lowest transition is strongly dominated by HOMO and LUMO transition with a contribution of more than 0.98 for all three molecules. These broad 1CT absorption peaks are clearly seen when there is a wide separation between the 1CT states and 1LE states. Vertical excitation of 2PO-2CF3Ph, 2PS-2CF3Ph, and 2AC-2CF3Ph yields transition energies of 2.37 eV, 2.70 eV and 2.78 eV with an oscillatory strength of less than 0.00005. 2AC-2CF3Ph yields an oscillatory strength of 0.0002. Such an extremely small oscillatory strength is the result of such near orthogonality between the donor and acceptor. Neglecting the explicit solute–solvent interactions, broadening derived from the spread of vertical excitation energies for different conformations can be computed in its ground state minimum. The disordered nature of molecules can be accounted for by using the ensemble approach. In the ensemble approach, the structures obtained from the molecular dynamics are used for the computation of vertical excitation energies. All the transition energies along with the respective oscillatory strength calculated by TD-TDF are shifted by 0.6 eV so as to align with the peak of absorption. The absorption between 2.6 eV to 3.8 eV for 2PO-2CF3Ph is dominated by charge transfer transitions from the HOMO to LUMO at ∼2.8 eV, from HOMO−1 to the LUMO at ∼3.0 eV, from the HOMO to LUMO+1 at ∼3.5 eV and from HOMO−1 to LUMO+1 at ∼3.6 eV as shown in Fig. 3(b). The simulated absorption curve is calculated by broadening each oscillatory transition by Gaussian line shape with a standard deviation of 0.1 eV. The higher energy deviated significantly because only the 4 lowest transition states are considered. The CT absorption curve of 2PS-2CF3Ph different from those of 2AC-2CF3Ph and 2PO-2CF3Ph as revealed by quantum molecular dynamics simulations is the consequence of a larger energy separation among the 4 lowest CT transitions as shown in (Fig. S2, ESI†).A plot of the dihedral angle between the donor and acceptor versus oscillatory strength of the 1st 1CT state of 2PO-2CF3Ph shown in Fig. 4(a) indicates that a smaller dihedral angle between the donor and acceptor is not the necessary condition for a larger oscillatory strength. Similar behaviours were also observed for 2PS-2CF3Ph and 2AC-2CF3Ph (Fig. S3, ESI†). However, when 100 data points are considered for a narrow range of dihedral angles, the mean oscillatory strengths start to show a parabolic feature with a minimum oscillatory strength at 85° as shown in Fig. 4(b) for 2PS-2CF3Ph and 2AC-2CF3Ph with the exception of 2PO-2CF3Ph where the oscillatory strength shows a spike at around 80°–90°. An extracted molecular structure representing this peculiar region is presented in Fig. 4(c). Fig. 4(c) shows the natural transition orbitals (NTOs) of the selected conformation distortion of 2PO-2CF3Ph due to the vibration exhibiting an oscillatory strength as high as 0.090 compared with the median oscillatory strength of 0.0044 within the simulated population. The highest occupied transition orbital (HONTO) of this conformer is extended into the acceptor through the C–N bond. The ΔEST is calculated to be 0.23 eV and the NTO is no longer dominated by the HOMO to LUMO transitions. It is rather a mixture of the HOMO to LUMO (0.83, contribution coefficient) and HOMO−1 to LUMO (−0.50, contribution coefficient). This increases the lowest unoccupied natural transition orbital (LUNTO) and HONTO distorting C–N–C bonds as seen in Fig. 4(b). The molecular distortion is induced by the rocking of the donor–acceptor bond as illustrated in Fig. 4(c) and such rocking has been found to contribute to reverse intersystem crossing.29 This rocking is the in plane bending of the two donors where the donors swing back and forth with respect to the acceptor. The vibrational frequency of the ground state indicates that the rocking oscillation is the lowest vibrational mode at 7.2 cm−1 for 2PO-2FC3Ph and at 15.2 cm−1 and 18.6 cm−1 for 2PS-2FC3Ph and 2AC-2FC3Ph, respectively. The slow rocking uninterrupted by the jostling of the solvent molecules is captured within the QMD 10 ps simulation window, giving rise to the observed ‘anomaly’ seen between 80° and 90° as shown in Fig. 4(b). The lowest D–A torsional oscillation (DO), which is the oscillation around the dihedral angle, occurs at 32.3 cm−1, 32.3 cm−1, and 29.5 cm−1 for 2PO-2CF3Ph, 2PS-2CF3Ph, and 2AC-2CF3Ph, respectively, as summarized in Fig. 4(d). The visualization of the lowest four molecular vibrations can be found in Fig. S4 (ESI†). The PL spectra show full-width half maximum (FWHM) values of 0.536 eV, 0.501 eV and 0.488 eV for 2CF3Ph, 2PS-2CF3Ph, and 2AC-2CF3Ph, respectively. The simple phenomenological line shape of flexible molecules can be accounted for through the sampling of molecular conformations.36 These FWHM values can be related to the conformational disorder of the molecules in the excited state and the ground state. Assuming that the molecular conformations at the excited state and ground state are independent and the change in the molecular conformation is the result of thermal perturbation from the solvent molecules the FWHM of emission (which can be fitted with a Gaussian curve) can be approximated by  ×2.355×σa, where σ is the standard deviation of the 1CT energy state. The values of σ of the 1st CT state in absorption as calculated from the QMD are 0.135 eV, 0.159 eV and 0.135 eV for 2CF3Ph, 2PS-2CF3Ph, and 2AC-2CF3Ph, respectively. The expected FWHM values for 2CF3Ph, 2PS-2CF3Ph, and 2AC-2CF3Ph are 0.450 eV, 0.503, and 0.450 eV. These values are close to the FWFM of the emission spectra. The σ can be used to infer the FHWM of the TADF emission and design a narrower σ.
3.5. Energy levels and delayed fluorescence
The PL spectra of the matrix of the compounds in Zeonex at 1% concentration recorded at different temperatures are shown in Fig. 5. When the phosphorescence spectra were discriminated from the fluorescence spectra by applying a delay time of 1, 5 or 9 ms at 77 K, it was not possible to estimate the 3CT energy by optical spectroscopy measurements as was noted above (Fig. 5 and Fig. S5, ESI†). The onsets of the phosphorescence spectra recorded at 77K and at the different gate delays of the matrix of 2PO-2CF3Ph, 2PS-2CF3Ph, and 2AC-2CF3Ph in Zeonex and MeTHF are related to their triplet LE states in the nature (Fig. S5a and b, ESI†). These triplet LE states can be attributed to the triplet LE states (3LED) of the corresponding donor moieties (10-phenyl-10H-phenoxazine (PO–Ph), 10-phenyl-10H-phenothiazine (PS–Ph) or 9,9-dimethyl-10-pheny-9,10-dihydroacridine (AC–Ph)) due to the similarities of the onsets of phosphorescence of 2PO-2CF3Ph, 2PS-2CF3Ph, and 2AC-2CF3Ph and PO–Ph, PS–Ph, and AC–Ph (Fig. S5c, ESI†) In addition, the onset of phosphorescence of the acceptor moiety is observed at a higher energy (3LEA = 3.65 eV) than that of the donor units PO–Ph, PS–Ph, and AC–Ph (Fig. S5d, ESI†). Therefore, the first singlet energy of 2PO-2CF3Ph, 2PS-2CF3Ph and 2AC-2CF3Ph was only estimated from the onsets of the PL spectra recorded at 300 K. The emission was mostly fluorescence (Fig. 5). The PL spectrum recorded at room temperature was redshifted with respect to the PL spectrum recorded at 77 K with increasing emission intensity at the lower energy levels except for 2AC-2CF3Ph. This observation can be attributed to the reduced conformational heterogeneity.37,38 As is discussed below, the 1CT energy was only taken as it is depicted in Fig. 7. Theoretically the energy gaps between the 3CT and 1CT were predicted to be of 0.04 eV, 0.03 eV and 0.04 eV for 2PO-2CF3Ph, 2PS-2CF3Ph and 2AC-2CF3Ph, respectively. The compounds were characterized by close values of ΔEST. TADF is a dynamical process for which there is a need to consider spin–orbit and vibronic couplings simultaneously. Since the spin–orbit coupling matrix elements of all organic TADF molecules are vanishing small, the vibronic coupling between the low lying electronic states is important. Here, we will consider the coupling with the 3LE state to meditate the RISC. | ||
| Fig. 5 The low-temperature and room-temperature PL of 2PO-2CF3Ph (a), 2PS-2CF3Ph (b) and 2AC-2CF3Ph (c) in Zeonex and the corresponding onsets of emission at 300 K. | ||
To examine the TADF behavior of the compounds in detail, their PL decay curves were recorded at different temperatures (Fig. 6a–c). The typical TADF decay curves were observed. They showed prompt decay (PF) in nanosecond range and microsecond delayed decay (DF). As the temperature was decreased, the DF was suppressed for all three compounds indicating that DF was thermally activated (Fig. 7). The fluorescence decays could be fitted by the sum of two exponentials, one describing the PF and the other DF decays (Fig. S6, ESI†). The lifetimes of PF and DF for 2PO-2CF3Ph, 2PS-2CF3Ph and 2AC-2CF3Ph were found to be 21.5 ns and 18.2 ns, 35.4 ns and 0.93 μs, and 1.41 μs and 2.56 μs, respectively (Table 1).
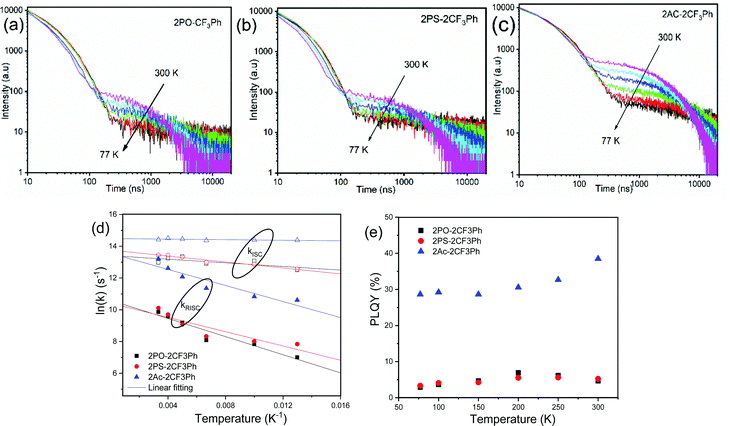 | ||
| Fig. 6 Fluorescence decay of (a) 2PO-2CF3Ph (b) 2PS-2CF3Ph and (c) 2Ac-2CF3Ph doped 1 wt% in Zeonex as a function of temperature as well as their kISC/kRISC (d) and PLQY (e) temperature dependences. | ||
| Compound | 2PO-2CF3Ph | 2PS-2CF3Ph | 2Ac-2CF3Ph |
|---|---|---|---|
| a The ΔEST values were calculated using the activation energies of ISC and RISC processes. | |||
| λ ICTPL, nm | 535 | 537 | 477 |
| PLQY, % | 4.6 | 5.2 | 38.5 |
| ΔESTa, eV | 0.02 | 0.011 | 0.021 |
| τ PF, ns (ratio, %) | 21.5 (72.3%) | 18.2 (28.2%) | 35.4 (21.6%) |
| τ DF, μs (%) | 0.93 (27.7%) | 1.41 (71.8%) | 2.56 (78.4%) |
| k ISC, s−1 | 4.33 × 10⁵ | 6.91 × 10⁵ | 1.84 × 10⁶ |
| k RISC, s−1 | 1.92 × 10⁴ | 2.46 × 10⁴ | 5.45 × 10⁵ |
| k rISC/kISC | 0.044 | 0.036 | 0.296 |
| ΔEISCA, meV | 4.9 | 8.1 | 0.8 |
| ΔERISCA, meV | 24.5 | 19.3 | 21.8 |
| k T nr | 4.78 × 10⁴ | 3.53 × 10⁴ | 9.25 × 10⁴ |
| k RISC/kTnr | 0.4 | 0.7 | 5.9 |
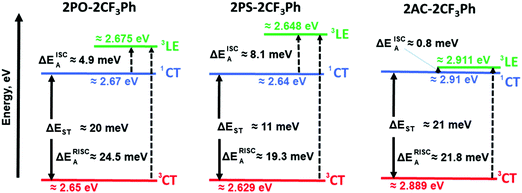
The rate of reverse intersystem crossing (kRISC) can be approximated to be 1.92 × 10⁴ s−1, 2.46 × 10⁴ s−1 and 5.45 × 10⁵ s−1 for 2PO-2CF3Ph, 2PS-2CF3Ph and 2AC-2CF3Ph, respectively.37 The higher kRISC values observed for 2AC-2CF3Ph compared to those of 2PO-2CF3Ph and 2PS-2CF3Ph are apparently due to the lower gap of ΔE3CT–3LE of 2AC-2CF3Ph. To prove this prediction, the rates of intersystem crossing (kISC) and kRISC were calculated at the different temperatures taking lifetimes of PF and DF from the single-exponential fitting of TADF decays recorded at different temperatures (Fig. S6, ESI†). The rates kISC and kRISC as a function of temperature are plotted in Fig. 6d. By the linear fitting of the plots, the ISC and RISC activation energies (EISCA and ERISCA) were obtained (Table 1). The fitting was performed according to the Arrhenius dependence k = A × exp(−Ea/kBT), where Ea is the activation energy, kB is the Boltzmann constant and A is the frequency factor involving the spin–orbit coupling constant.38 The different activation energies of intersystem crossing EISCA and reverse intersystem crossing ERISCA were obtained for 2PO-2CF3Ph, 2PS-2CF3Ph and 2AC-2CF3Ph. Those activation energies were used to construct the energy diagram shown in Fig. 7 as was previously proposed (Table 1).39 The best mixing of 3LE and the excited state wave function of 3CT was obtained for 2AC-2CF3Ph due to the lowest ΔE3LE–3CT. This result is coherent with the highest kRISC of 5.45 × 10⁵ s−1 and kRISC/kISC ratio of 0.296, which means the most efficient TADF of 2AC-2CF3Ph (Table 1). The 3CT energy state was not possible to take from optical spectroscopy measurements as was noted above (Fig. 5 and Fig. S5, ESI†). Nevertheless, the triplet CT states can be calculated using the activation energies for the ISC and RISC processes (Fig. 7). As a result, the 1CT–3CT energy gaps of 20 meV for 2PO-2CF3Ph, 11 meV for 2PS-2CF3Ph and 21 meV for 2AC-2CF3Ph were obtained (Fig. 7 and Table 1). The trend of those ΔEST values of 2PO-2CF3Ph, 2PS-2CF3Ph and 2AC-2CF3Ph was not in agreement with the trend of their TADF efficiency. However, the trend of the TADF efficiency of studied compounds was the same as that of their ΔE3LE–1CT values. For example, the best TADF efficiency was observed for 2AC-2CF3Ph which is characterized by the lowest ΔE3LE–1CT value of 0.8 meV (Fig. 7).
Apparently due to the relatively high ΔE3LE–3CT, PLQYs of 2PO-2CF3Ph and 2PS-2CF3Ph reached their maxima at ca. 200 K (Fig. 6e). The further increase of the temperature leads to the decrease of the PLQY values most probably due to the increase of non-radiative rates of the triplet states (kTnr, Table S1, ESI†). In contrast, 2AC-2CF3Ph showed an increase of PLQYs up to 38.5% with an increase of the temperature from 77 to 300 K due to the efficient TADF process. The highest ratio kRISC/kTnr of 5.9 was observed for 2AC-2CF3Ph. This kRISC/kTnr ratio has to be higher than unity (the case of 2AC-2CF3Ph) for efficient TADF emitters.40,41 As was previously mentioned, the theoretical calculations yielded 1CT values of 2.37 eV, 2.70 eV and 2.78 eV for 2PO-2CF3Ph, 2PS-2CF3Ph, and 2AC-2CF3Ph respectively. We also noted that X-ray data for the phenoxazine moiety in 2PO-2CF3Ph is slightly saddled (∼15°) rather than flat as predicted by geometry optimisation. This resulted in a larger error of 1CT compared with experimental data for 2PO-2CF3Ph. 1CT values for 2PS-2CF3Ph and 2AC-2CF3Ph are close to each other (error less than 0.2 eV). Nevertheless, from the calculations, the oscillatory strengths for all three compounds are virtually zero. From the experiment, the 3LE values of 2PO-2CF3Ph and 2PS-2CF3Ph are far higher than that of 2AC-2CF3Ph, resulting in very low RISC and hence very low PLQY for 2PO-2CF3Ph and 2PS-2CF3Ph but not for 2AC-2CF3Ph (Table 1). This indicates that the ΔE3LE–3CT gap is critical in increasing RISC which later yields high PLQY.
It should be noted that the 3LE values of PO–Ph, PS–Ph and AC–Ph were experimentally measured to be 2.83 eV, 2.65 eV and 3.22 eV respectively (Fig. S5c, ESI†). In the case of 2PO-2CF3Ph and 2PS-2CF3Ph, the triplet LE states of PO–Ph and PS–Ph calculated using the activation energies for the ISC process were in relatively good agreement with the experimental ones. In the case of 2AC-2CF3Ph, a 3LED of ca. 3.19 eV was estimated. It is considerably higher than the calculated one (2.911 eV). It is possibly because other donating fragments should be used for experimental determination of 3LE values as was discussed elsewhere.42 However, after a more precise analysis of the phosphorescence spectra of 2AC-2CF3Ph and AC–Ph (Fig. S5b and c, ESI†), two bands were identified. The high (3.19 eV) and low (ca. 2.92 eV) bands attributed to phosphorescence but not to delay fluorescence according to the PL decay measurements (Fig. S6, ESI†). The delay fluorescence was recorded in time ranging up to ca. 0.5 ms; while the phosphorescence was recorded using a delay of 9 ms (Fig. S5c, ESI†). This observation shows that compound 2AC-2CF3Ph is characterized by two 3LED states apparently having ππ* and nπ* character as was reported for 10-phenyl-10H, 10′H-spiro[acridine9,9′-anthracen]-10′-one.43,44 A ππ* 3LED value of ca. 3.19 eV and an nπ* 3LED value of ca. 2.92 eV were obtained for 2AC-2CF3Ph (Fig. S5b, ESI†). The value of nπ* 3LED is in very good agreement with the calculated triplet LE value (Fig. 7). Thus, the energy diagram shown in Fig. 7 can appropriately explain the most efficient TADF properties of 2Ac-2CF3Ph. It is also in good agreement with the experimentally measured 3LE values of 2PO-2CF3Ph, 2PS-2CF3Ph and 2Ac-2CF3Ph.
After selection of SimCP2 as the OLED host, we recorded the PL spectra of the films of molecular mixtures of 2AC-2CF3Ph and SimCP2 containing 10, 15, and 20 wt% of 2AC-2CF3Ph (Fig. S8a, ESI†). The shapes and maxima of the PL spectra of the films with different concentrations of 2AC-2CF3Ph were found to be very similar. This observation is in good agreement with the EL spectra of 2AC-2CF3Ph-based devices as is discussed below. The film of the molecular mixture of 2AC-2CF3Ph and SimCP2 containing 10 wt% of the emitter was selected for the investigation of TADF properties (Fig. S8b–e, ESI†). The PL spectra and PL decays of the molecular dispersion of 2AC-2CF3Ph in SimCP2 were very similar to those of 2AC-2CF3Ph in Zeonex (Fig. 5, 6c and Fig. S5, ESI†). The laser energy dependence of the delayed emission intensity was recorded for the emitting layer of 2AC-2CF3Ph [10 wt%]![[thin space (1/6-em)]](https://www.rsc.org/images/entities/char_2009.gif) :
:![[thin space (1/6-em)]](https://www.rsc.org/images/entities/char_2009.gif) SimCP2 (Fig. S7, ESI†). The slope of 0.95 of the dependence additionally supports the TADF origin of emission of 2AC-2CF3Ph.45 Taking into account the poor TADF properties of 2PO-2CF3Ph and 2PS-2CF3Ph, the photophysical measurements of these compounds in the SimCP2 host were not provided.
SimCP2 (Fig. S7, ESI†). The slope of 0.95 of the dependence additionally supports the TADF origin of emission of 2AC-2CF3Ph.45 Taking into account the poor TADF properties of 2PO-2CF3Ph and 2PS-2CF3Ph, the photophysical measurements of these compounds in the SimCP2 host were not provided.
3.6. Electroluminescence
Compound 2AC-2CF3Ph exhibited the best combination of the properties required for OLED applications. It was therefore selected as a TADF emitter for the electroluminescence study. The device structure was ITO/MoO3[0.5 nm]/NPB[40 nm]/TCTA[4 nm]/mCBP[4 nm]/light-emitting layer [24 nm]/TSPO1[4 nm]/TPBi[40 nm]/LiF[0.5 nm]![[thin space (1/6-em)]](https://www.rsc.org/images/entities/char_2009.gif) :
:![[thin space (1/6-em)]](https://www.rsc.org/images/entities/char_2009.gif) Al[88 nm], in which the layers of 2AC-2CF3Ph[5 wt%]
Al[88 nm], in which the layers of 2AC-2CF3Ph[5 wt%]![[thin space (1/6-em)]](https://www.rsc.org/images/entities/char_2009.gif) :
:![[thin space (1/6-em)]](https://www.rsc.org/images/entities/char_2009.gif) SimCP2, 2AC-2CF3Ph[10 wt%]
SimCP2, 2AC-2CF3Ph[10 wt%]![[thin space (1/6-em)]](https://www.rsc.org/images/entities/char_2009.gif) :
:![[thin space (1/6-em)]](https://www.rsc.org/images/entities/char_2009.gif) SimCP2 and 2AC-2CF3Ph[15 wt%]
SimCP2 and 2AC-2CF3Ph[15 wt%]![[thin space (1/6-em)]](https://www.rsc.org/images/entities/char_2009.gif) :
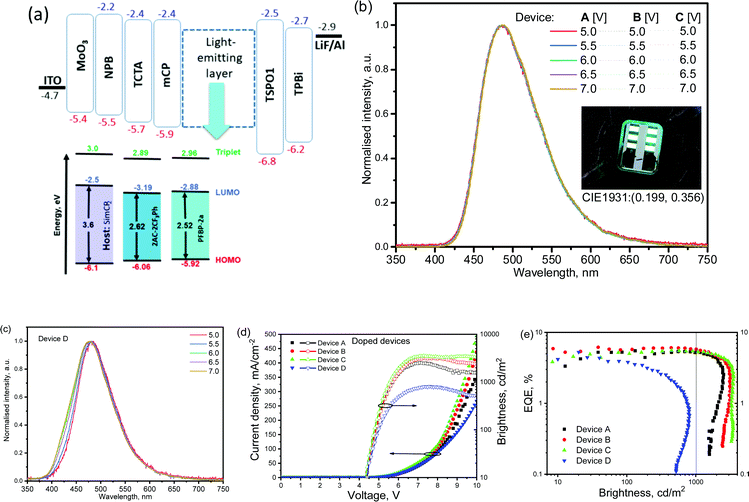
:![[thin space (1/6-em)]](https://www.rsc.org/images/entities/char_2009.gif) SimCP2 were used as the light-emitting layers for device A, B, and C, respectively. The light-emitting layer of 20 wt% molecular dispersion of PFBP-2a in SimCP2 was used in the reference device D in which the TADF emitter PFBP-2a with a fluorine-containing acceptor (perfluorobiphenyl) was used.33 As a result, a direct comparison of the electroluminescence performances was possible for the developed D–A electronic systems (9,9-dimethyl-9-10-dihydroacridine-1,4-bis(trifluoromethyl)benzene) with a similar one (9,9-dimethyl-9-10-dihydroacridine-perfluorobiphenyl). The materials with the usual roles, namely MoO3 as hole-injecting, NPB and TCTA as hole-transporting, mCBP as electron/exciton-blocking, SimCP2 as the host, TSPO1 as hole/exciton-blocking, TPBi as electron-transporting, and LiF as electron-injecting materials, were used in the device structures, aiming to provide balanced hole–electron recombination and exciton formation within the light-emitting layers (Fig. 8a). The selection of the host SimCP2 was caused by the following considerations. SimCP2 has a T1 of 3.0 eV with a lower polarity than DPEPO and an ambipolar transport property.46 When PFBP-2a or 2AC-2CF3Ph is doped into SimCP2 (as the HOMO levels of the emitters and the host are almost the same), the holes are easily transported while the electrons can be easily captured by the emitters (since the LUMOs of the emitters are deeper than those of the host). The zone of recombination will be located near the SMPCP2/TPSO1 interface. TPSO1 is an excellent electron-transporting and hole blocking material, which, along with a high triplet energy of over 3.36 eV, can suppress Dexter energy transfer loss into TPS01.47 The previous studies indicated that a high-triplet-energy ETL is critical for the high efficiency of blue OLEDs at high brightness.48
SimCP2 were used as the light-emitting layers for device A, B, and C, respectively. The light-emitting layer of 20 wt% molecular dispersion of PFBP-2a in SimCP2 was used in the reference device D in which the TADF emitter PFBP-2a with a fluorine-containing acceptor (perfluorobiphenyl) was used.33 As a result, a direct comparison of the electroluminescence performances was possible for the developed D–A electronic systems (9,9-dimethyl-9-10-dihydroacridine-1,4-bis(trifluoromethyl)benzene) with a similar one (9,9-dimethyl-9-10-dihydroacridine-perfluorobiphenyl). The materials with the usual roles, namely MoO3 as hole-injecting, NPB and TCTA as hole-transporting, mCBP as electron/exciton-blocking, SimCP2 as the host, TSPO1 as hole/exciton-blocking, TPBi as electron-transporting, and LiF as electron-injecting materials, were used in the device structures, aiming to provide balanced hole–electron recombination and exciton formation within the light-emitting layers (Fig. 8a). The selection of the host SimCP2 was caused by the following considerations. SimCP2 has a T1 of 3.0 eV with a lower polarity than DPEPO and an ambipolar transport property.46 When PFBP-2a or 2AC-2CF3Ph is doped into SimCP2 (as the HOMO levels of the emitters and the host are almost the same), the holes are easily transported while the electrons can be easily captured by the emitters (since the LUMOs of the emitters are deeper than those of the host). The zone of recombination will be located near the SMPCP2/TPSO1 interface. TPSO1 is an excellent electron-transporting and hole blocking material, which, along with a high triplet energy of over 3.36 eV, can suppress Dexter energy transfer loss into TPS01.47 The previous studies indicated that a high-triplet-energy ETL is critical for the high efficiency of blue OLEDs at high brightness.48
The EL spectra (peaking at 485 nm and with a full-width-at-half-maximum (FWHM) of 85 nm) of the devices A–C were very similar to the PL spectra of the corresponding light-emitting layers of 2Ac-2CF3Ph doped in SimCP2 peaking at 487 nm with a FWHM of 87 nm (Fig. 8b and Fig. S8, ESI†). According to this observation, the EL is attributed to the emission of 2Ac-2CF3Ph. Small differences between the PL and EL spectra are caused by the different optical and electrical excitation sources used. The EL spectrum of device D is in agreement with those of the previously studied PFBP-2a-based devices.33 The bands which could be attributed to additional functional materials were not observed. The close values of turn-on voltages of ca. 4.4 V were obtained for devices A–D due to the similar charge-injecting properties of 2AC-2CF3Ph and PFBP-2a (Fig. 8d). At voltages higher than ca. 7V, higher operating current densities were observed for devices A–C in comparison to that of Device D apparently because of the better charge-transporting properties of 2AC-2CF3Ph relative to those of PFBP-2a.
The EL spectra of devices A–C recorded at different voltages showed practically the same shapes and maxima wavelengths. In addition, they were very similar for different devices A–C despite the slightly different concentrations of the emitter 2AC-2CF3Ph used. This observation can be attributed to the formation of non-covalent intramolecular bonds by 2AC-2CF3Ph in solid-state as is demonstrated in Fig. 1e. In contrast, the reference D–A electronic system (9,9-dimethyl-9-10-dihydroacridine-perfluorobiphenyl) demonstrated unstable EL spectra in device D even at different external voltages (Fig. 8c).33 This observation well highlights the advantages of the newly designed electron-accepting 1,4-bis(trifluoromethyl)benzene moiety.
In comparison to the OLED based on a perfluorobiphenyl-containing compound, the advantages of the device based on the 1,4-bis(trifluoromethyl)phenyl containing compound were observed not only with respect to its EL spectra but also with respect to device efficiency roll-offs (Fig. 8e). At a valuable brightness of 1000 cd m−2, EQE values were comparable with the maximum EQE values of devices A–C (Table 2). The EQE roll-off of device D was dramatic and its maximum brightness even did not reach 1000 cd m−2 (Fig. 8d). The “stable” EQE was observed for devices A–C at relatively low operating current densities (lower than 40 mA cm−2). Then EQEs dramatically decreased. At higher operating current densities (higher than 40 mA cm−2), the bonds with the lowest cleavage energy apparently could be firstly broken due to the exciton-polaron annihilation reactions as discussed elsewhere.49,50
| Device name | EML | λ EL, nm | V ON, V | L MAX, cd m−2 | CEMAX, cd A−1 | PEMAX, lm W−1 | EQE10/EQE1000, % |
|---|---|---|---|---|---|---|---|
| λ EL is the EL maximum; VON is the turn-on voltage; LMAX is the maximum brightness; CEMAX is the maximum current efficiency and PEMAX is the maximum power efficiency. EQE10 and EQE1000 are EQEs at 10 and 1000 cd m−2, respectively. | |||||||
| Device structure is ITO/MoO3/NPB/TCTA/mCBP/light-emitting layer (EML)/TSPO1/TPBi/LiF:Al | |||||||
| A |
2AC-2CF3Ph [5 wt%]![[thin space (1/6-em)]](https://www.rsc.org/images/entities/char_2009.gif) : :![[thin space (1/6-em)]](https://www.rsc.org/images/entities/char_2009.gif) SimCP2 SimCP2 |
487 | 4.4 | 2500 | 11.7 | 9.9 | 4.7/5.18 |
| B |
2AC-2CF3Ph [10 wt%]![[thin space (1/6-em)]](https://www.rsc.org/images/entities/char_2009.gif) : :![[thin space (1/6-em)]](https://www.rsc.org/images/entities/char_2009.gif) SimCP2 SimCP2 |
487 | 4.4 | 3000 | 12.9 | 10.7 | 5.9/5.8 |
| C |
2AC-2CF3Ph [15 wt%]![[thin space (1/6-em)]](https://www.rsc.org/images/entities/char_2009.gif) : :![[thin space (1/6-em)]](https://www.rsc.org/images/entities/char_2009.gif) SimCP2 SimCP2 |
487 | 4.4 | 3500 | 12.6 | 8.97 | 4.6/5.4 |
| D |
PFBP-2a [20 wt%]![[thin space (1/6-em)]](https://www.rsc.org/images/entities/char_2009.gif) : :![[thin space (1/6-em)]](https://www.rsc.org/images/entities/char_2009.gif) SimCP2 SimCP2 |
478 | 4.4 | 800 | 6.2 | 5.6 | 4.4/− |
Conclusions
Three derivatives of phenoxazine, phenothiazine or 9,9-dimethyl-9-10-dihydroacridine as donors and 1,4-bis(trifluoromethyl)benzene as an acceptor were synthesized. Despite the high dihedral angle between the donor and acceptor, total separation of frontier orbitals is not observed. The derivative of 9,9-dimethyl-9-10-dihydroacridine and 1,4-bis(trifluoromethyl)benzene was found to be a promising blue TADF emitter with a high singlet charge transfer onset of 2.91 eV. This compound demonstrated cyan electroluminescence which is “insensitive” to the concentration of the emitter in the light-emitting layer due to the intramolecular interactions. The highest external quantum efficiency of 5.9% with practically absent roll-off up to a brightness of 1000 cd m−2 was obtained for the device based on this emitter. The result leads to a more important conclusion that a decrease of the ΔE3LE–1CT of TADF molecules can lead to an increase in the rate of reverse intersystem crossing and hence to an increase of the efficiency of TADF.Author contributions
Levani Skhirtladze: investigation, conducting synthesis of the organic compounds; Karolis Lietonas: investigation, conducting the photophysics and electroluminescence measurements; Audrius Bucinskas: single crystal X-ray crystallography analysis; Dmytro Volyniuk: analysis of photophysics and electroluminescence data, writing of the manuscript and supervision; Malek Mahmoudi: measurements and analysis of thermal properties; Omar Mukbaniani: supervision; Kai Lin Woon: theoretical calculation, visualisation of the results and wrote the manuscript, Azhar Ariffin: methodology for synthesis, wrote the manuscript, and supervision; Juozas V. Grazulevicius: conceptualization, funding acquisition, and supervision.Conflicts of interest
There are no conflicts to declare.Acknowledgements
This project has received funding from European Regional Development Fund (project No 01.2.2-LMT-K-718-03-0019) under the grant agreement with the Research Council of Lithuania (LMTLT). KLW and AA thank for the funding from the European Union's Horizon 2020 research and innovation programme under the Marie Sklodowska-Curie Grant agreement no 823720. The computation is supported by the University Malaya Research University Grant-Faculty Program (GPF086B-2020). Iryna Danyliv is acknowledged for the synthesis of PFBP-2a.References
- L. Xiao, Z. Chen, B. Qu, J. Luo, S. Kong, Q. Gong and J. Kido, Adv. Mater., 2011, 23, 926–952 CrossRef CAS PubMed.
- X. K. Chen, D. Kim and J. L. Brédas, Acc. Chem. Res., 2018, 51, 2215–2224 CrossRef CAS PubMed.
- G. Hong, X. Gan, C. Leonhardt, Z. Zhang, J. Seibert, J. M. Busch and S. Bräse, Adv. Mater., 2021, 33(2005630), 1–24 Search PubMed.
- X. Liang, Z. L. Tu and Y. X. Zheng, Chem. – Eur. J., 2019, 25, 5623–5642 CrossRef CAS PubMed.
- Q. Wei, P. Imbrasas, E. Caldera-Cruz, L. Cao, N. Fei, H. Thomas, R. Scholz, S. Lenk, B. Voit, S. Reineke and Z. Ge, J. Phys. Chem. A, 2021, 125, 1345–1354 CrossRef CAS PubMed.
- S. J. Woo, Y. H. Ha, Y. H. Kim and J. J. Kim, J. Mater. Chem. C, 2020, 8, 12075–12084 RSC.
- T. Serevičius, J. Dodonova, R. Skaisgiris, D. Banevičius, K. Kazlauskas, S. Juršėnas and S. Tumkevičius, J. Mater. Chem. C, 2020, 8, 11192–11200 RSC.
- J. Kosai, Y. Masuda, Y. Chikayasu, Y. Takahashi, H. Sasabe, T. Chiba, J. Kido and H. Mori, ACS Appl. Polym. Mater., 2020, 2, 3310–3318 CrossRef CAS.
- H. Tanaka, K. Shizu, H. Miyazaki and C. Adachi, Chem. Commun., 2012, 48, 11392–11394 RSC.
- J. Lu, Y. Zheng and J. Zhang, Phys. Chem. Chem. Phys., 2015, 17, 20014–20020 RSC.
- S. Xiang, R. Guo, Z. Huang, X. Lv, S. Sun, H. Chen, Q. Zhang and L. Wang, Dyes Pigm., 2019, 170(107636), 1–8 Search PubMed.
- G. Tang, A. A. Sukhanov, J. Zhao, W. Yang, Z. Wang, Q. Liu, V. K. Voronkova, M. Di Donato, D. Escudero and D. Jacquemin, J. Phys. Chem. C, 2019, 123, 30171–30186 CrossRef CAS.
- Q. Chen, Y. Xiang, X. Yin, K. Hu, Y. Li, X. Cheng, Y. Liu, G. Xie and C. Yang, Dyes Pigm., 2021, 188(109157), 1–7 Search PubMed.
- T. Chen, C. H. Lu, Z. Chen, X. Gong, C. C. Wu and C. Yang, Chem. – Eur. J., 2021, 27, 3151–3158 CrossRef CAS PubMed.
- Q. Zhang, S. Sun, W. J. Chung, S. J. Yoon, Y. Wang, R. Guo, S. Ye, J. Y. Lee and L. Wang, J. Mater. Chem. C, 2019, 7, 12248–12255 RSC.
- H. Tanaka, K. Shizu, H. Nakanotani and C. Adachi, J. Phys. Chem. C, 2014, 118, 15985–15994 CrossRef CAS.
- L. Su, F. Cao, C. Cheng, T. Tsuboi, Y. Zhu, C. Deng, X. Zheng, D. Wang, Z. Liu and Q. Zhang, ACS Appl. Mater. Interfaces, 2020, 12, 31706–31715 CrossRef CAS PubMed.
- K. L. Woon, C. L. Yi, K. C. Pan, M. K. Etherington, C. C. Wu, K. T. Wong and A. P. Monkman, J. Phys. Chem. C, 2019, 123, 12400–12410 CrossRef CAS PubMed.
- R. Xiao, Y. Xiang, X. Cao, N. Li, T. Huang, C. Zhou, Y. Zou, G. Xie and C. Yang, J. Mater. Chem. C, 2020, 8, 5580–5586 RSC.
- Y. Li, Z. Wang, X. Cai, K. Liu, J. Dong, S. Chang and S. J. Su, Dyes Pigm., 2019, 163, 249–256 CrossRef CAS.
- Y. Y. Wang, Y. L. Zhang, K. Tong, L. Ding, J. Fan and L. S. Liao, J. Mater. Chem. C, 2019, 7, 15301–15307 RSC.
- X. Cao, X. Zhang, C. Duan, H. Xu, W. Yuan, Y. Tao and W. Huang, Org. Electron., 2018, 57, 247–254 CrossRef CAS.
- Y. Li, J. J. Liang, H. C. Li, L. S. Cui, M. K. Fung, S. Barlow, S. R. Marder, C. Adachi, Z. Q. Jiang and L. S. Liao, J. Mater. Chem. C, 2018, 6, 5536–5541 RSC.
- S. Kothavale, W. J. Chung and J. Y. Lee, ACS Appl. Mater. Interfaces, 2020, 12(16), 18730–18738 CrossRef CAS PubMed.
- K. L. Woon, Z. N. Nadiah, Z. A. Hasan, A. Ariffin and S. A. Chen, Dyes Pigm., 2016, 132, 1–6 CrossRef CAS.
- J. Grobe and D. Le Van, J. Fluorine Chem., 2004, 125, 801–821 CrossRef CAS.
- W. Yuan, H. Yang, C. Duan, X. Cao, J. Zhang, H. Xu, N. Sun, Y. Tao and W. Huang, Chem, 2020, 6, 1998–2008 CAS.
- M. K. Etherington, J. Gibson, H. F. Higginbotham, T. J. Penfold and A. P. Monkman, Nat. Commun., 2016, 7(13680), 1–7 Search PubMed.
- J. Gibson, A. P. Monkman and T. J. Penfold, ChemPhysChem, 2016, 17(19), 2956–2961 CrossRef CAS PubMed.
- J. Gibson and T. J. Penfold, Phys. Chem. Chem. Phys., 2017, 19, 8428–8434 RSC.
- R. D. S. Stevens, R. Bonneau and J. Joussot-Dubien, J. Chem. Phys., 1972, 57, 5340–5342 CrossRef CAS.
- R. P. Frueholz, W. M. Flicker, O. A. Mosher and A. Kuppermann, J. Chem. Phys., 1979, 70, 3057–3070 CrossRef CAS.
- I. Hladka, D. Volyniuk, O. Bezvikonnyi, V. Kinzhybalo, T. J. Bednarchuk, Y. Danyliv, R. Lytvyn, A. Lazauskas and J. V. Grazulevicius, J. Mater. Chem. C, 2018, 6, 13179–13189 RSC.
- Z. Yang, Z. Mao, Z. Xie, Y. Zhang, S. Liu, J. Zhao, J. Xu, Z. Chi and M. P. Aldred, Chem. Soc. Rev., 2017, 46, 915–1016 RSC.
- J.-L. Bredas, Mater. Horiz., 2014, 1, 17–19 RSC.
- T. J. Zuehlsdorff and C. M. Isborn, Int. J. Quantum Chem., 2019, 119(e25719), 1–18 Search PubMed.
- F. B. Dias, T. J. Penfold and A. P. Monkman, Methods Appl. Fluoresc., 2017, 5(012001), 1–25 Search PubMed.
- A. E. Nikolaenko, M. Cass, F. Bourcet, D. Mohamad and M. Roberts, Adv. Mater., 2015, 27, 7236–7240 CrossRef CAS PubMed.
- T. Serevičius, R. Skaisgiris, I. Fiodorova, G. Kreiza, D. Banevičius, K. Kazlauskas, S. Tumkevičius and S. Juršėnas, J. Mater. Chem. C, 2021, 9, 836–841 RSC.
- K. H. Kim, S. J. Yoo and J. J. Kim, Chem. Mater., 2016, 28(6), 1936–1941 CrossRef CAS.
- M. Mahmoudi, J. Keruckas, K. Leitonas, S. Kutsiy, D. Volyniuk and J. V. Gražulevicius, J. Mater. Res. Technol., 2021, 10, 711–721 CrossRef CAS.
- H. Noda, X. K. Chen, H. Nakanotani, T. Hosokai, M. Miyajima, N. Notsuka, Y. Kashima, J. L. Brédas and C. Adachi, Nat. Mater., 2019, 18, 1084–1090 CrossRef CAS PubMed.
- L. G. Franca, A. Danos and A. Monkman, J. Mater. Chem. C, 2022, 10, 1313–1325 RSC.
- I. Lyskov and C. M. Marian, J. Phys. Chem. C, 2017, 121(39), 21145–21153 CrossRef CAS.
- X. Qiao and D. Ma, Mater. Sci. Eng., R, 2020, 139(100519), 1–38 Search PubMed.
- J.-H. Jou, W.-B. Wang, S.-Z. Chen, J.-J. Shyue, M.-F. Hsu, C.-W. Lin, S.-M. Shen, C.-J. Wang, C.-P. Liu, C.-T. Chen, M.-F. Wu and S.-W. Liu, J. Mater. Chem. C, 2010, 20, 8411–8416 RSC.
- S. O. Jeon, S. E. Jang, H. S. Son and J. Y. Lee, Adv. Mater., 2011, 23, 1436–1441 CrossRef CAS PubMed.
- M. A. bin Janai, K. L. Woon and C. S. Chan, Org. Electr., 2018, 63, 257–266 CrossRef.
- N. C. Giebink, B. W. D’Andrade, M. S. Weaver, P. B. Mackenzie, J. J. Brown, M. E. Thompson and S. R. Forrest, J. Appl. Phys., 2008, 103(044509), 1–9 Search PubMed.
- J. Lee, C. Jeong, T. Batagoda, C. Coburn, M. E. Thompson and S. R. Forrest, Nat. Commun., 2017, 8(15566), 1–9 Search PubMed.
Footnote |
| † Electronic supplementary information (ESI) available. CCDC 2101143, 2108557 and 2108558. For ESI and crystallographic data in CIF or other electronic format see DOI: 10.1039/d1tc05420a |
| This journal is © The Royal Society of Chemistry 2022 |

