 Open Access Article
Creative Commons Attribution 3.0 Unported Licence
Structural and gasification kinetic studies on co-pyrolysis chars of coal and biomass
Lang
Liu
 *a,
Jingsong
Zeng
b,
Qingrui
Jiao
b,
Shan
Ren
 *b and
Jian
Yang
b
aChemical Engineering Institute, Guizhou Institute of Technology, Guiyang, Guizhou 550003, China. E-mail: liu@git.edu.cn
bCollege of Material Science & Engineering, Chongqing University, Shapingba, Chongqing 400044, China. E-mail: shan.ren@cqu.edu.cn
First published on 3rd February 2022
Abstract
The CO2 gasification behaviors of co-pyrolysis chars of coal and biomass were investigated using isothermal thermogravimetry at 950–1150 °C. The TGA results showed that char gasification reactivity with higher biomass composition was better than that with lower biomass composition. The results from BET and XRD indicated that biomass can promote the growth of porous structure and inhibit graphite-like carbon formation during the co-pyrolysis of coal and biomass. An extended random pore model was proposed to define the gasification kinetics of the co-pyrolysis chars. The activation energies (Ea) of chars were observed to be reduced with increasing biomass composition. Meanwhile the synergetic influence of interactions between char/mineral and mineral/mineral on the whole co-gasification process was predicted. The relationship between the gasification reactivity and char characteristics was also analyzed.
Introduction
Coal gasification to syngas is an effective way to produce power, heating, and syngas fuel on a large scale, enabling simultaneous capture and storage of CO2,1 where the key is to improve the gasification reaction rate. Catalysts have been proven to help realize excellent conditions of coal gasification,2,3 and as a result of the formation and diffusion of the liquid–solid interface between alkali metal and carbon surface, the alkali metals exhibit the best catalytic activity.4,5 However, a great quantity of alkali metals is volatilized to the gas phase during the gasification, and the strong interaction between alkali metals and minerals in coal leads to catalyst deactivation and difficult recovery and regeneration.6–8 Therefore, it is necessary to seek a cheap and abundant catalyst.Most biomass is rich in alkali metals which can be used as an ideal catalyst to enhance the coal gasification efficiency.9–13 Biomass has higher volatile matter content and higher porosity of residual char than does coal,14 which can significantly increase the gasification kinetics. For these reasons, biomass is suggested as a potential cheap catalyst in co-gasification of coal and biomass.15 Furthermore, char gasification is generally considered as the rate-limiting step of the entire process.16 And most recent studies have focused on the influence of the characteristics of char, such as the chemical and structural properties as well as ash composition, on the char gasification reactivity.17–19 Ahmad et al.20 and Everson et al.21 previously determined that gasification reactivity increased with a decrease in aromaticity of various raw materials, including lignocellulose biomass and coal. Huo et al.22 reported that the reactivity index (R0.5) increased with an increase in the interlayer spacing (d002) and a decrease in the crystallisation height (Lc). Zhang et al.23 analysed the degree of interaction between biomass and coal during gasification and pyrolysis using a synergy factor. However, the quantification of the relationship of the chemical and structural characteristics of the char in relation to co-gasification reactivity has not been adequately investigated.
Furthermore, co-pyrolysis is the precursor to co-gasification, involving the cracking of organic matter in coal, volatilization of low-molecular-weight pyrolysis products, polycondensation of cracking residues, decomposition and combination of volatile products during emission, and further decomposition and repolycondensation of the polycondensation products,24–26 and all of these affect the characteristics of chars fed into the gasification zone. Hence, in this study, coal and biomass blended with different ratios were firstly co-pyrolyzed. Subsequently, the activity of the gasification reaction of co-pyrolysis chars was evaluated using a thermogravimetric analyser (TGA). The investigation of the gasification reaction kinetics was conducted by defining a random pore model (RPM) as well as an extended RPM. In addition, the characteristics of the co-pyrolysis char were quantitatively characterised by BET, SEM, XRD and Raman spectroscopic analyses. Finally, the relationship between the selected characteristics of the co-pyrolysis chars, such as the porous structure and crystallite properties, and the co-gasification kinetic parameters was analysed. The current study enhances the current knowledge on co-gasification of coal and biomass. The results obtained herein could be used for the design of highly efficient gasifiers.
Materials and methods
Materials
In this work, a typical coal found in southwest China was selected as the coal sample, while wheat straw was chosen as the biomass sample. The proximate and ultimate analyses of the raw samples are summarised in Table 1. The heating values of fuels were determined with an oxygen bomb, under excess oxygen condition (the initial oxygen pressure was 2.6–3.0 MPa), and the heat generated by burning fuel per unit mass was measured according to GB 213-87. Compared with coal, the wheat straw has higher volatile matter, oxygen and hydrogen contents and lower sulfur and ash contents. The raw samples were milled and sieved into particles sized between 100 and 150 μm. The coal powders were subsequently blended with the biomass in a mixer for 10 min. The blending proportions were as follows: biomass 0%/coal 100%, biomass 5%/coal 95%, biomass 10%/coal 90%, biomass 15%/coal 85%, and biomass 20%/coal 80%.| Sample | Proximate analysis (wt%, db)a | Ultimate analysis (wt%, daf)b | Calorific value (J g−1) | |||||||
|---|---|---|---|---|---|---|---|---|---|---|
| Fixed carbon | Volatiles | Ash | Moisture | C | H | N | O | S | ||
| a db, dry basis; daf, dry and ash-free. b Oxygen content by difference. | ||||||||||
| Coal | 74.5 | 15.63 | 9.47 | 0.4 | 81.49 | 4.26 | 1.22 | 12.45 | 0.56 | 32![[thin space (1/6-em)]](https://www.rsc.org/images/entities/char_2009.gif) 490 490 |
| WS | 11.42 | 73.49 | 8.54 | 6.55 | 41.02 | 3.83 | 1.724 | 53.13 | 0.28 | 16201.1 |
Preparation and characterisation of chars
The chars were prepared at 1150 °C under a N2 atmosphere in a horizontal tubular furnace. 800 mg of the char mixture was evenly spread in crucible boats, then heated to 1150 °C at a heating rate of 20 °C min−1, and kept for 30 min.For selected co-pyrolysis chars, X-ray diffraction curves were obtained via a wide-angle XRD analyser (UItima IV). The patterns were recorded at a scanning speed of 0.3° min−1 in the 2θ range of 10–90°. The Raman spectra of the co-pyrolysis chars were collected using a DXR Raman spectrometer (Thermo Fisher Scientific). About 5–10 particles were randomly selected and analysed in the spectral recording range of 800–2000 cm−1 in 60 seconds. The structural features were characterized using a N2 adsorption–desorption isotherm apparatus (ASAP 2020) and a Nova Nano SEM 450 microscope (FEI Company).
Gasification experiment
The co-gasification experiment was conducted with a Netzsch STA 449F3 TGA under a CO2 atmosphere in the temperature range of 950–1150 °C. The weighing precision was ±0.1 μg. In the gasification experiment, 5 ± 0.1 mg samples were thinly dispersed on a crucible plate, heated to 950–1150 °C at a rate of 20 °C min−1 under a 100 mL min−1 N2 stream, and then held for 30 min to fully pyrolyse the samples. Subsequently, the N2 stream was switched to a 100 mL min−1 CO2 stream to initiate the co-gasification for 90 min.Kinetic analysis
The gasification conversion (X) of a sample during co-gasification was calculated according to eqn (1): | (1) |
The co-gasification char gasification rates (R) were determined using eqn (2):
 | (2) |
(1) The char particles are porous, and the pores are cylindrical holes with uneven diameters. The co-gasification predominantly occurs on the inner surface of the char particles.
(2) The pores gradually expand with the corrosion of the internal surface area, and finally fuse together during gasification.
(3) The variation in the reaction area is a result of the interaction between the pore structures and the consumption of carbon active sites.
(4) In the initial stage of gasification, CO2 rapidly reacts with the amorphous carbon structures, leading to a gradual decrease in the amorphous carbon content. The subsequent main reaction between CO2 and the aromatic carbon structure is very slow. The influence of minerals on different carbon matrices varies.
(5) In addition to the effects of the interactions between char and minerals, the interactions between different minerals, which inhibit the gasification reaction, should also be considered. Overall, co-gasification is affected by the synergistic effects of the interactions between char and minerals as well as between minerals themselves, which are related to gasification conversion. Based on the conducted calculations, it was determined that the effect of synergism on the entire co-gasification process can be expressed by the following equation (eqn (3)):
| G(x) = ex(1 − x)α | (3) |
An eRPM will be obtained by putting eqn (3) into RPM, as shown in eqn (4):
 | (4) |
Results and discussion
Char gasification activity tests
The TGA profiles of the gasification of co-pyrolysis chars of coal and biomass in CO2 under isothermal conditions (950–1150 °C) are illustrated in Fig. 1(a–c). It can be seen that the carbon conversion increased with increasing biomass composition at a given gasification temperature. This result was consistent with the outcomes of previous studies, which concluded that some types of biomass can be applied as cheap and abundant catalysts to promote gasification.30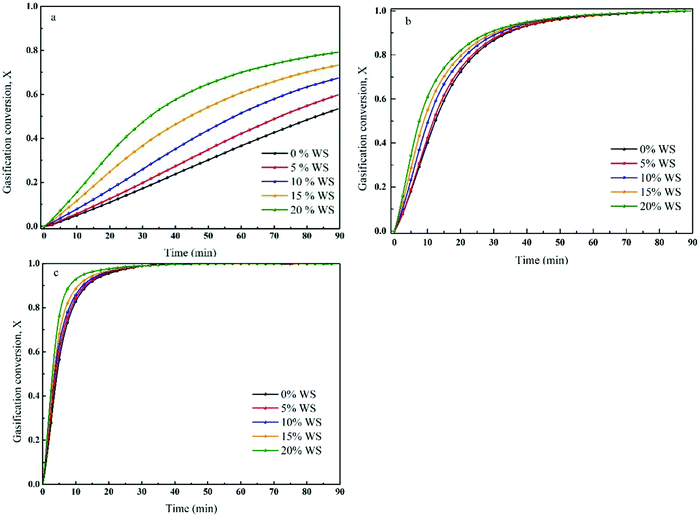 | ||
| Fig. 1 TGA profiles of gasification of co-pyrolysis chars of coal and biomass in CO2 at given temperatures: (a) 950 °C, (b) 1050 °C, (c) 1150 °C. | ||
Chemical composition of ash
The ash composition was evaluated by X-ray fluorescence spectroscopy (PANalytical Axios). Each test was repeated three times and the average value was taken to minimize the error. The chemical compositions of the ashes are summarised in Table 2. The results showed that SiO2 and Al2O3 were the major components in the ashes. These two oxides accounted for >70% of the total composition. It was also found that the proportions of K2O significantly increased with an increasing amount of biomass in the ashes, which could act as a catalyst in the gasification of co-pyrolysis char. In contrast, the proportions of CaO, MgO, and Na2O only increased slightly, while the amounts of SiO2, Al2O3, Fe2O3, and TiO2 decreased with increasing proportion of biomass.| Sample | Ash chemical composition (wt%) | |||||||||
|---|---|---|---|---|---|---|---|---|---|---|
| SiO2 | Al2O3 | SO3 | CaO | Fe2O3 | K2O | TiO2 | MgO | Na2O | other | |
| 0% bio | 58.76 | 21.68 | 4.79 | 4.83 | 4.21 | 1.45 | 1.68 | 0.93 | 0.85 | 0.82 |
| 5% bio | 57.78 | 20.33 | 5.48 | 4.87 | 4.05 | 2.61 | 1.62 | 1.24 | 1.01 | 1.01 |
| 10% bio | 57.03 | 19.06 | 5.97 | 5.01 | 3.85 | 3.65 | 1.53 | 1.5 | 1.17 | 1.23 |
| 15% bio | 56.55 | 17.61 | 6.33 | 5.13 | 3.71 | 4.66 | 1.46 | 1.78 | 1.31 | 1.46 |
| 20% bio | 55.71 | 16.16 | 7.2 | 5.24 | 3.49 | 5.67 | 1.35 | 2.06 | 1.44 | 1.68 |
Porous structure analysis
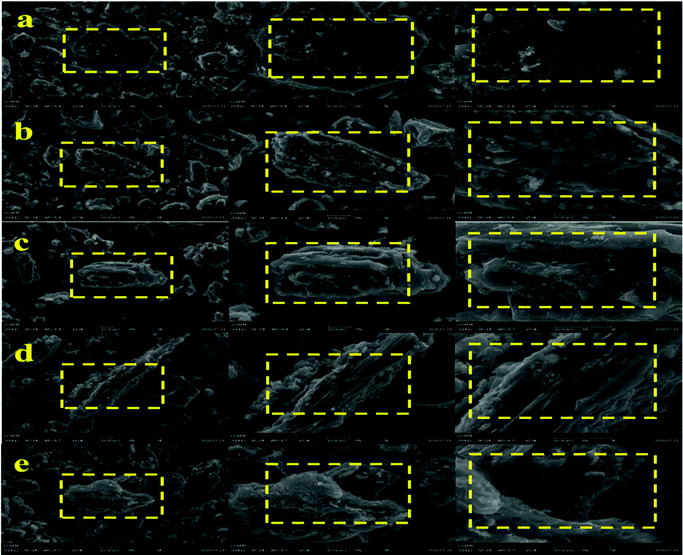
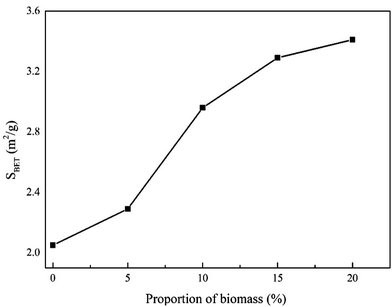
The morphologies of the initial chars were characterized by SEM, as shown in Fig. 2. It can be seen that the surface of the raw coal was compact without obvious pore structure, and only a few small particles adhere to the surface. After mixing 5% WS into co-pyrolysis process, the surface becomes rough, and the number of small particles on the surface increases obviously, and a few small pore structures can be found. With increasing WS proportion to 10%, the original small grooves on the surface of the char begin to expand and form large gullies, and the pore structure has developed significantly regardless of size or depth, and most of the small particles adhere to the gully walls. When the WS proportion increases to 15%, the gully structure deepens, the pore structure continues to increase, and the small particles attached to the gully walls decrease gradually. The gully structure disappeared in the co-pyrolysis char with 20% WS, which developed a larger pore structure, and there were a few pore structures with smaller pore size around the macropore. These results indicated that the biomass addition is conducive to the development of surface pore structure of the co-pyrolysis chars, which will increase the amount of active sites on the carbon surface during gasification17,18 and hence increase the char gasification reactivity.We subsequently measured the BET specific surface areas (SBET) of the initial chars (Fig. 3). The results revealed that SBET of the prepared chars increased with increasing proportion of biomass. This was consistent with previously reported outcomes and with the SEM results, which indicated that the biomass addition contributes to the release of volatile substances in the fuels during the co-pyrolysis, and resulting in the development of a porous structure.31,32 This in turn led to an increase in SBET and the amount of active sites on the carbon surface per unit weight.17,18 Notably, the degree of this trend increased with an increase in the proportion of biomass.
XRD analysis
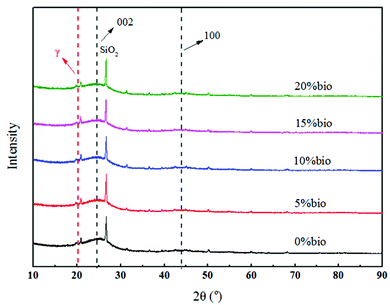
The results of previous studies31,33 demonstrated that catalysts significantly affected crystallite characteristics, including the crystallisation height (Lc), microcrystalline size (La), and crystal layer spacing (d002). It was also shown that catalysts hindered the growth of the char lattice during pyrolysis and inhibited graphitisation. The results of the XRD analysis of the prepared chars are presented in Fig. 4. The minor peaks in the patterns were caused by the presence of inorganic minerals in coal and biomass, while the sharp peak at approximately 27° was attributed to the existence of SiO2. Furthermore, the (002) band at ∼25° and the (100) band in the vicinity of graphite at ∼43°![[thin space (1/6-em)]](https://www.rsc.org/images/entities/char_2009.gif) 34 corresponded to graphite-like structures (i.e., crystalline carbon). The appearance of γ peaks at approximately 20° suggested the existence of aliphatic side chains attached at the periphery of the carbon crystallites.35 The obtained outcomes implied that the structures of the carbon crystallites were between those of graphite and the amorphous state.
34 corresponded to graphite-like structures (i.e., crystalline carbon). The appearance of γ peaks at approximately 20° suggested the existence of aliphatic side chains attached at the periphery of the carbon crystallites.35 The obtained outcomes implied that the structures of the carbon crystallites were between those of graphite and the amorphous state.
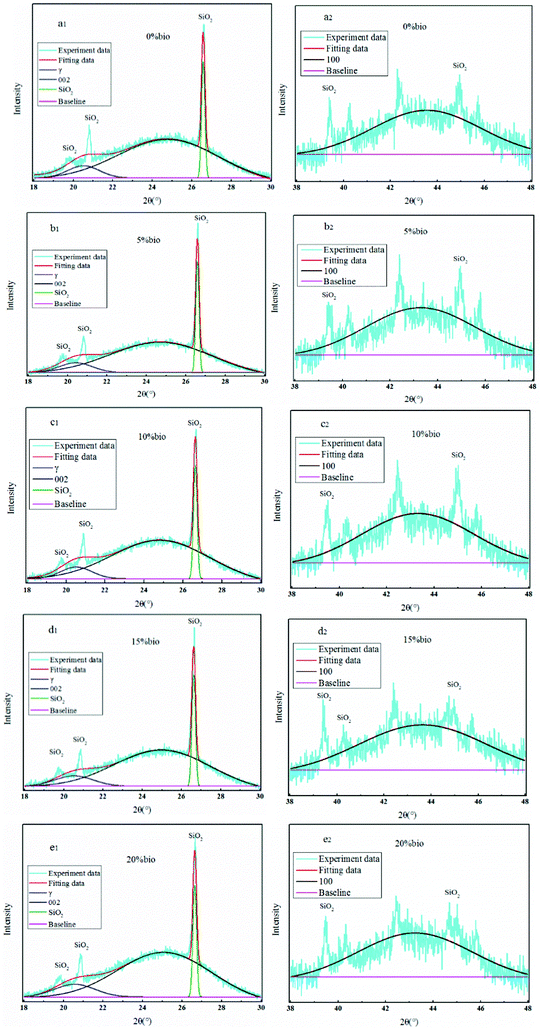
Fig. 5 illustrates the XRD patterns after smoothing and processing by Peakfit4.2. It was found that the intensity of the (002) and (100) bands decreased with an increase in the biomass proportion, which indicated that biomass doping could inhibit the graphitisation of char during pyrolysis. The results also demonstrated that the intensity of the γ peak increased with an increase in the biomass proportion. It was speculated that this was caused by the inhibition of the breaking of the side chains in the aliphatic moieties by the catalyst components in the biomass during pyrolysis. It was also hypothesised that there were more aliphatic chains in raw biomass than in raw coal.
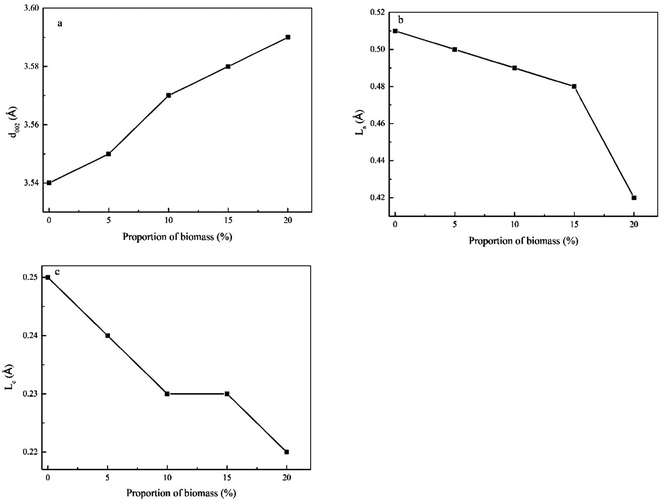
The calculated La, Lc, and d002 values are shown in Fig. 6. As can be seen, the values of La and Lc decreased with an increase of the biomass proportion. In contrast, the values of d002 exhibited the reverse trend. These observations indicated that the ordering of aromatic moieties in the sample was more irregular in space. In addition, the development of crystallite structures toward reverse graphitisation was noted, which increased the activity of gasification of co-pyrolysis char. This outcome was in agreement with the findings previously reported by Mafu et al.33
Raman spectroscopic analysis
To further verify the XRD results, we conducted Raman spectroscopic analysis to evaluate the chemical features of highly disordered carbon in the co-pyrolysis chars. We averaged multiple Raman spectra of each sample to account for the heterogeneity of the char particles. The Raman spectra obtained in the range from 800 to 2000 cm−1 are illustrated in Fig. 7.The spectra were deconvoluted into four Lorentzian bands (designated as the G, D1, D2, and D4 bands) and one Gaussian band (labelled as the D3 band). The D1 band at ∼1350 cm−1 was attributed to the vibration between the aromatic rings and aromatic moieties with no less than six rings. It corresponded to the A1g vibration of the amorphous hexagonal irregular lattice structure, and represented disorder in the carbon structure.36 The D2 band was detected as a shoulder band of the G band, which corresponded to the vibrational mode of the disordered graphite lattice. It was attributed to the E2g mode of the symmetric graphite lattice.37 On the other hand, the D3 band observed at ∼1500 cm−1 was ascribed to the amorphous sp2-bonded forms of carbon.38,39 In addition, the D4 band at ∼1250 cm−1 was attributed to amorphous mixing of the sp2–sp3-bonded forms of carbon. Lastly, the G band was the graphitic band. Subsequently, the band area ratios (ID1 + ID3 + ID4)/IG and IG/Iall were calculated to indicate the reacting sites and the extent of graphitisation in the co-pyrolysis chars. The variation of the band area ratios (ID1 + ID3 + ID4)/IG and IG/Iall with the biomass proportion is shown in Fig. 8. The results implied that (ID1 + ID3 + ID4)/IG increased with increasing biomass proportion, while IG/Iall exhibited a reverse trend. This suggested that the graphitic microcrystallite size decreased. Importantly, the Raman spectroscopic analysis was consistent with XRD evaluation.
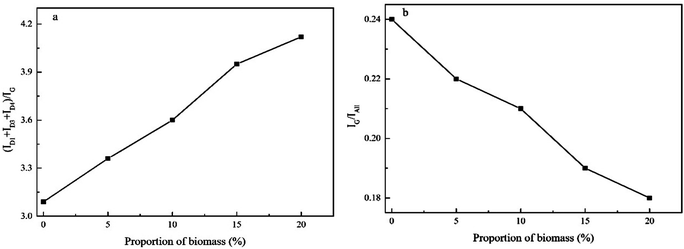 | ||
| Fig. 8 Variation of the band area ratios (ID1 + ID3 + ID4)/IG and IG/Iall with changes in the biomass proportion. | ||
Kinetic models and parameters of co-gasification
The gasification rate and carbon conversion curves were first defined by RPM (Fig. 9(a–c)). As can be seen, the gasification rate initially increased and then decreased with carbon conversion. Moreover, the maximum gasification rate was noted at a carbon conversion of 0.25–0.4. However, RPM was not a suitable model for the prediction of co-gasification behaviours. This is due to the synergistic effects of the interactions between chars and minerals as well as between minerals themselves during co-gasification. Ding et al.26 reported that RPM could only be used to determine the gasification kinetics at low carbon conversions (i.e., <0.393) or when the gasification rate reached a maximum value at carbon conversion of >0.393. It was found that RPM was particularly not applicable for biomass char gasification. Thus, a semi-empirical formula (G(x)) was introduced to the original RPM, which was named eRPM (eqn (3)). The corresponding fitting results are shown in Fig. 10(a–c). Notably, significantly better fitting results were obtained employing eRPM than RPM. In addition, the experimental data were consistent with the theoretical data calculated by eRPM. Importantly, as shown in Table 3, most of the R2 values were high (R2 ≥ 0.99). It was also found that the k values increased with increasing biomass composition at a given temperature, which confirmed the catalytic effect of biomass. The calculated α values ranged between 0.69 and 1.70. Furthermore, the ψ values for gasification of the prepared chars were in the range of 4.5–26.16. These outcomes implied that the eRPM proposed in this work could be utilised to accurately define the co-gasification kinetics of coal and biomass char.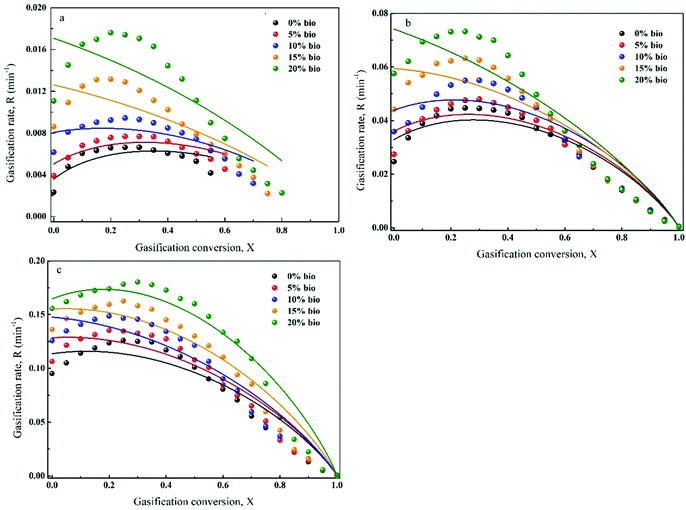 | ||
| Fig. 9 Application of RPM to define the gasification behaviour of chars at given temperatures: (a) 950 °C, (b) 1050 °C, (c) 1150 °C. | ||
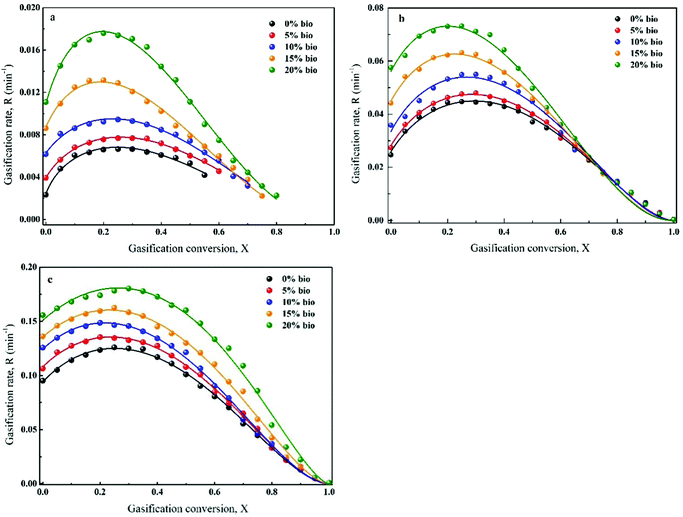 | ||
| Fig. 10 Application of eRPM to define the gasification behaviour of chars at given temperatures: (a) 950 °C, (b) 1050 °C, (c) 1150 °C. | ||
| Temperature | Parameter | Sample | ||||
|---|---|---|---|---|---|---|
| 0% bio | 5% bio | 10% bio | 15% bio | 20% bio | ||
| 950 °C | R 2 | 0.97 | 0.99 | 0.99 | 0.99 | 0.99 |
| k | 0.0024 | 0.0039 | 0.0063 | 0.0087 | 0.011 | |
| α | 1.21 | 1.23 | 1.28 | 1.67 | 1.70 | |
| ψ | 24.14 | 26.16 | 14.43 | 17.33 | 22.01 | |
| 1050 °C | R 2 | 0.99 | 0.99 | 0.99 | 0.99 | 0.99 |
| k | 0.026 | 0.028 | 0.033 | 0.045 | 0.056 | |
| α | 0.92 | 0.95 | 1.04 | 1.22 | 1.34 | |
| ψ | 15.43 | 14.73 | 14.19 | 11.17 | 10.02 | |
| 1150 °C | R 2 | 0.99 | 0.99 | 0.99 | 0.99 | 0.99 |
| k | 0.094 | 0.11 | 0.12 | 0.14 | 0.15 | |
| α | 0.96 | 0.96 | 1.00 | 0.86 | 0.69 | |
| ψ | 8.09 | 6.75 | 5.97 | 5.13 | 4.51 | |
Kinetics of the synergistic influence of interactions between chars and minerals as well as between various minerals on the co-gasification
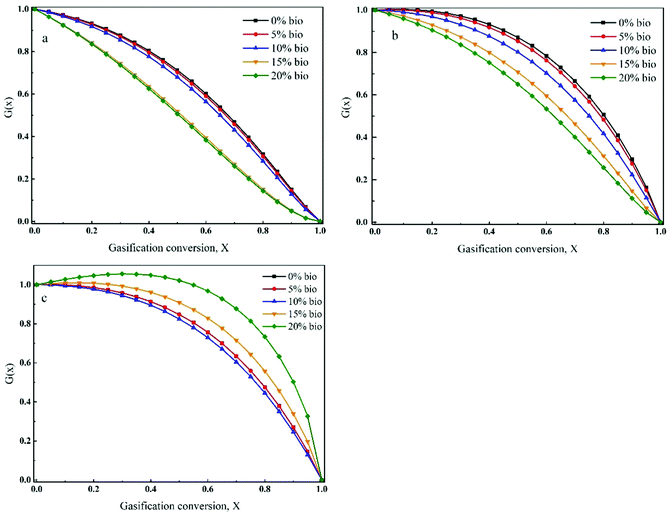
The above calculations confirmed that eRPM proposed in the present study could accurately describe the kinetic behaviour of co-gasification. Moreover, it was demonstrated that the synergistic effects of the interactions between chars and minerals as well as between minerals themselves on the gasification reaction were valid. Hence, G(x) in eqn (3) could be used to predict the synergistic influence of the above interactions on the entire co-gasification process. The relationship between these effects and the gasification conversion is demonstrated in Fig. 11(a–c). Furthermore, Fig. 11(a–c) shows that the catalytic effect of minerals on co-gasification gradually decreased during gasification. This was caused by the gradual consumption of the carbon matrix as well as by the strengthening of the interactions between minerals, which resulted in the deactivation of the catalyst.6 The data shown in these figures also indicated that the catalytic effects of the catalyst component on co-gasification decreased with increasing biomass proportion when the temperature was below 1050 °C. We speculated that this was caused by the inhibition of the carbon lattice growth by the catalyst component in biomass and by the enhancement of the production of volatile matter, which in turn resulted in an increased amount of reactive sites in co-pyrolysis char. In addition, as shown by the XRD and Raman spectroscopic analyses, the amount of reactive sites increased with an increase in the biomass proportion.40 In contrast, the effect of the catalyst on the amount of reactive sites was smaller. Fig. 11(c) demonstrates that when the temperature was raised to 1150 °C and the biomass increased to 15%, the interaction between the catalyst and char, particularly the graphite-like carbon matrix, was enhanced, and the catalytic effect of the catalyst was improved.Calculation of Ea and k0
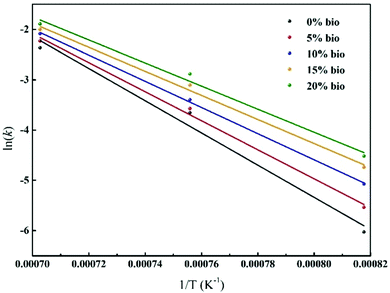
The Arrhenius law was applied to determine the activation energy (Ea) and pre-exponential factor (k0) values according to the following equation (eqn (5)):k = k0![[thin space (1/6-em)]](https://www.rsc.org/images/entities/char_2009.gif) exp(−Ea/RT) exp(−Ea/RT) | (5) |
![[thin space (1/6-em)]](https://www.rsc.org/images/entities/char_2009.gif) k vs. 1/T) acquired by linearising plots obtained using eqn (5) are shown in Fig. 12. In addition, the calculated Ea and k0 values are summarised in Table 4. It was found that the Ea values of chars decreased from 266.5 to 190.8 kJ mol−1 with an increase in the biomass composition from 0 to 20%. The decrease of the Ea values further confirmed the catalytic activity of the biomass. Importantly, this result was in agreement with the outcomes previously reported by Lahijani et al.,41 who observed that the value of Ea decreased when palm fruit cluster char or almond shell char was mixed with tire char. Moreover, Ding et al.26 noted an apparent reduction in Ea when corn stalk was mixed with Hulunbeier lignite coal.
k vs. 1/T) acquired by linearising plots obtained using eqn (5) are shown in Fig. 12. In addition, the calculated Ea and k0 values are summarised in Table 4. It was found that the Ea values of chars decreased from 266.5 to 190.8 kJ mol−1 with an increase in the biomass composition from 0 to 20%. The decrease of the Ea values further confirmed the catalytic activity of the biomass. Importantly, this result was in agreement with the outcomes previously reported by Lahijani et al.,41 who observed that the value of Ea decreased when palm fruit cluster char or almond shell char was mixed with tire char. Moreover, Ding et al.26 noted an apparent reduction in Ea when corn stalk was mixed with Hulunbeier lignite coal.
| Sample | E a (kJ mol−1) | ln![[thin space (1/6-em)]](https://www.rsc.org/images/entities/char_2009.gif) k0 k0 |
R 2 |
|---|---|---|---|
| 0% bio | 266.5 | 20.30 | 0.97 |
| 5% bio | 240.2 | 18.14 | 0.99 |
| 10% bio | 216.4 | 16.23 | 0.99 |
| 15% bio | 198.9 | 14.88 | 0.99 |
| 20% bio | 190.8 | 14.32 | 0.98 |
Relationship between the char characteristics and reactivity
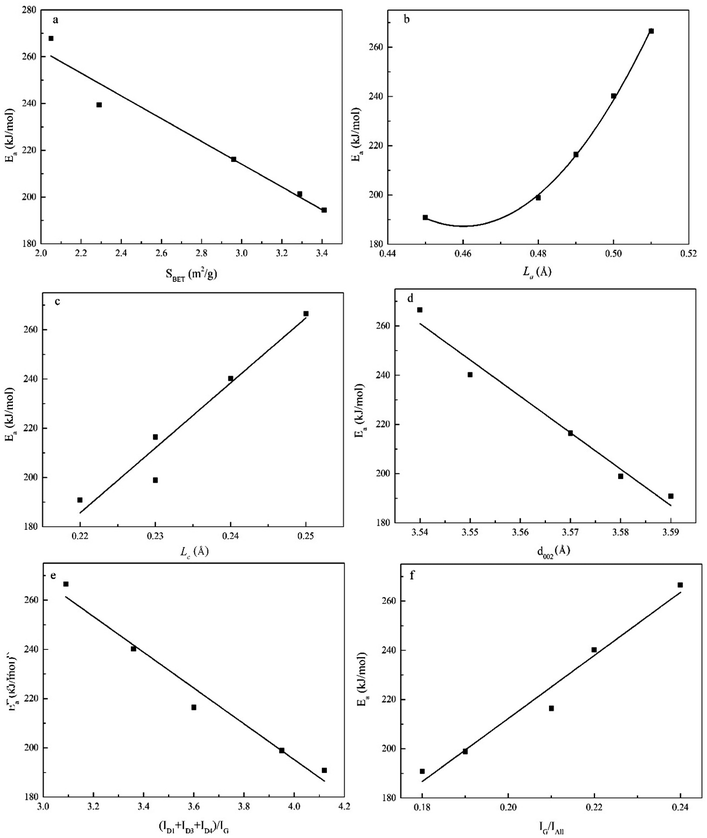
The carbon crystallite and structural characteristics of the chars exhibit direct effects on the reactivity. Hence, in the present study, we investigated the relationship between these characteristics and the char gasification reaction. The relationships between the char parameters (i.e., SBET, La, Lc, (ID1 + ID3 + ID4)/IG, and IG/Iall) and the activation energies are illustrated in Fig. 13. The results indicated that most of the parameters (i.e., SBET, Lc, (ID1 + ID3 + ID4)/IG and IG/Iall) displayed linear correlations with the activation energies (R2 ≥ 0.95). On the other hand, a 2nd-order polynomial correlation was noted between the La parameter and the activation energies. Mafu et al.33 previously reported the existence of a 2nd-order polynomial correlation between SBET and the gasification reactivity (i.e., the initial gasification rate, gasification rate index, and average final gasification rate). Based on the values of R2, the crystallite characteristics, and therefore aromaticity,42 had a significant impact on the activation energies. These observations indicated that the crystallite characteristics governed the char gasification rates during experiments conducted using a TGA. Additionally, the structural characteristics of char also had an important effect on the reactivity of gasification of co-pyrolysis char. Overall, we determined that the reactivity of gasification of co-pyrolysis char composed of coal and biomass could be predicted based on characteristic char parameters, such as SBET, La, Lc, (ID1 + ID3 + ID4)/IG, and IG/Iall.Conclusions
We established that the reactivity of gasification of co-pyrolysis char composed of coal and biomass increased with increasing biomass proportion. The results indicated that biomass promoted the growth of the porous structure and inhibited the formation of graphite-like carbon during the co-pyrolysis process. An eRMP was proposed to define the synergistic effects of the interactions between chars and minerals as well as between different minerals on co-gasification. The eRMP was found to accurately determine the kinetics of co-gasification of coal and biomass char. The char characteristics, such as SBET, La, Lc and (ID1 + ID3 + ID4)/IG, influenced the char reactivity with a statistically significant correlation. It was also found that the activation energies decreased with increasing biomass proportion.Conflicts of interest
There are no conflicts to declare.Acknowledgements
We gratefully acknowledge the National Natural Science Foundation of China (52164033), the Science and Technology Project of Guizhou Province (Qian Ke He Ping Tai Ren Cai[2019]5609), and the Natural Science Foundation of Guizhou provincial Department of Education (Qianjiaohe KY Zi[2017] 009) for financial support.References
- A. Giuffrida, D. Bonalumi and G. Lozza, Appl. Energy, 2013, 110, 44–54 CrossRef CAS.
- N. Daunt, M. Ross, G. Couzens, K. Cutbush, J. Green, D. Kennedy and J. Keller, Fuel, 2014, 117, 1181–1189 CrossRef.
- Y. Ohtsuka and K. Asami, Catal. Today, 1997, 39, 111–125 CrossRef CAS.
- H. Zhu, X. Wang, F. Wang and G. Yu, Energy Fuels, 2018, 32, 1320–1327 CrossRef CAS.
- D. W. Mckee, C. L. Spiro, P. G. Kosky and E. J. Lamby, Fuel, 1983, 62, 217–220 CrossRef CAS.
- L. Kühn and H. Plogmann, Fuel, 1983, 62, 205–208 CrossRef.
- Y. Zhao, W. Zhang, P. Wang, P. Liu, G. Zeng, S. Sun and S. Zhang, Int. J. Hydrogen Energy, 2018, 43, 10991–11001 CrossRef CAS.
- X. Chen, L. Liu, L. Zhang, Y. Zhao and P. Qiu, Bioresour. Technol., 2019, 279, 243–251 CrossRef CAS PubMed.
- H. J. Jeong, S. P. Sang and J. Hwang, Fuel, 2014, 116, 465–470 CrossRef CAS.
- L. Yan, Y. Cao, X. Li and B. He, Bioresour. Technol., 2018, 254, 97–106 CrossRef CAS PubMed.
- F. Pinto, H. Lopes, N. A. Rui, I. Gulyurtlu and I. Cabrita, Fuel, 2007, 86, 2052–2063 CrossRef CAS.
- A. B. Nasrin, A. N. Ma, M. C. Chow, H. Hamdan and Y. M. Choo, Oil Palm Industry Economic Journal, 2006, 6, 31–36 Search PubMed.
- M. V. Kok, I. Gokalp, K. Jayaraman and K. D. Samy, Renewable Energy, 2017, 101, 293–300 CrossRef.
- Z. Hameed, S. R. Naqvi, M. Naqvi, I. Ali and S. Hussain, J. Chem., 2020, 2020, 1–23 CrossRef.
- W. Zhu, W. Song and W. Lin, Fuel Process. Technol., 2008, 89, 890–896 CrossRef CAS.
- L. Liu, Y. Cao and Q. Liu, Fuel, 2015, 146, 103–110 CrossRef CAS.
- N. Standish and A. F. A. Tanjung, Fuel, 1988, 67, 666–672 CrossRef CAS.
- J. A. Moulijn and F. Kapteijn, Carbon, 1995, 33, 1155–1165 CrossRef CAS.
- K. Jayaraman, I. Gökalp and S. Jeyakumar, Appl. Therm. Eng., 2017, 110, 991–998 CrossRef CAS.
- A. A. Ahmad, A. Khasri, F. H. Kasim and A. Inayat, Renewable Sustainable Energy Rev., 2016, 53, 1333–1347 CrossRef CAS.
- R. C. Everson, G. N. Okolo, H. W. J. P. Neomagus and J. M. D. Santos, Fuel, 2013, 109, 148–156 CrossRef CAS.
- W. Huo, Z. Zhou, X. Chen, Z. Dai and G. Yu, Bioresour. Technol., 2014, 159, 143–149 CrossRef CAS PubMed.
- Y. Zhang, Y. Zheng, M. Yang and Y. Song, Bioresour. Technol., 2016, 200, 789–794 CrossRef CAS PubMed.
- R. P. Solomon, H. T. Fletcher and J. R. Pugmire, Fuel, 1993, 72, 587–597 CrossRef.
- V. J. Ibarra, R. Moliner and J. A. Bonet, Fuel, 1994, 73, 918–924 CrossRef.
- L. Ding, Y. Zhang, Z. Wang, J. Huang and Y. Fang, Bioresour. Technol., 2014, 173, 11–20 CrossRef CAS PubMed.
- I. Ahmed and A. Gupta, Appl. Energy, 2011, 88, 1613–1619 CrossRef CAS.
- I. Sircar, A. Sane, W. Wang and J. P. Gore, Fuel, 2014, 119, 38–46 CrossRef CAS.
- X. Wu, T. Jia and W. Jie, Fuel, 2015, 165, 59–67 CrossRef CAS.
- X. Wang, K. Yao, X. Huang, X. Chen and G. Yu, Fuel, 2019, 249, 103–111 CrossRef CAS.
- X. Gong, Z. Guo, Z. Wang, X. Gong, Z. Guo and Z. Wang, Energy Fuels, 2009, 23, 4547–4552 CrossRef CAS.
- D. W. Mckee, Fuel, 1983, 62, 170–175 CrossRef CAS.
- L. D. Mafu, H. Neomagus, R. C. Everson, G. N. Okolo, C. A. Strydom and J. R. Bunt, Bioresour. Technol., 2018, 258, 70–78 CrossRef CAS PubMed.
- Ł. Smedowski, M. Krzesinska, W. Kwasny and M. Kozanecki, Energy Fuels, 2011, 25, 3142–3149 CrossRef.
- Y. Zhang, X. Kang, J. Tan and R. L. Frost, Energy Fuels, 2013, 27, 7191–7197 CrossRef CAS.
- M. Asadullah, S. Zhang, Z. Min, P. Yimsiri and C. Z. Li, Bioresour. Technol., 2010, 101, 7935–7943 CrossRef CAS PubMed.
- A. Cuesta, P. Dhamelincourt and J. Laureyns, Carbon, 1994, 32(8), 1523–1532 CrossRef CAS.
- J. Jiang, W. Yang, Y. Cheng, Z. Liu, Q. Zhang and K. Zhao, Fuel, 2019, 239, 559–572 CrossRef CAS.
- T. Jawhari, A. Roid and J. C. Casado, Carbon, 1995, 33, 1561–1565 CrossRef CAS.
- P. L. Walker, S. Matsumoto, T. Hanzawa, T. Muira, I. M. K. Ismail, P. L. Walker, S. Matsumoto, T. Hanzawa, T. Muira and I. M. K. Ismail, Fuel, 1983, 62, 140–149 CrossRef CAS.
- P. Lahijani, Z. A. Zainal, A. R. Mohamed and M. Mohammadi, Bioresour. Technol., 2013, 138, 124–130 CrossRef CAS PubMed.
- L. D. Mafu, H. W. J. P. Neomagus, R. C. Everson, C. A. Strydom, M. Carrier, G. N. Okolo and J. R. Bunt, Bioresour. Technol., 2017, 243, 941–948 CrossRef CAS PubMed.
| This journal is © The Royal Society of Chemistry 2022 |

