 Open Access Article
Creative Commons Attribution 3.0 Unported Licence
Bioelectrocatalytic methanol production with alcohol dehydrogenase using methylviologen as an electron mediator
Takayuki
Katagiri
 a,
Masako
Kuwata
b,
Hideaki
Yoneda
c,
Hideaki
Sumi
c and
Yutaka
Amao
 *ab
*ab
aGraduate School of Science, Osaka City University, 3-3-138 Sugimoto, Sumiyoshi-ku, Osaka 558-8585, Japan. E-mail: amao@osaka-cu.ac.jp
bResearch Centre for Artificial Photosynthesis (ReCAP), Osaka City University, 3-3-138 Sugimoto, Sumiyoshi-ku, Osaka 558-8585, Japan
cInnovative Research Excellence, Power unit & Energy, Honda R&D Co.,Ltd, 4630 Shimotakanezawa, Haga-Machi, Hagagun, Tochigi 321-3393, Japan
First published on 4th April 2022
Abstract
Methanol fuel is paid much attention as an alternative lower carbon fuel for internal combustion and other engines. In this work, the bioelectrocatalytic methanol production from formaldehyde with alcohol dehydrogenase from Saccharomyces cerevisiae (ADH) using methylviologen (MV2+) as an electron mediator was developed toward establishing a method for synthesizing CO2 to methanol. When a single-electron reduction potential of MV2+ (−700 mV vs. Ag/AgCl electrode as a reference) was applied in the presence of ADH, reduction of formaldehyde to methanol was observed. After 90 min continuous external bias of −700 mV, 22.6% formaldehyde consumption based on methanol production was observed in this bioelectric catalyst system.
Various alcohols instead of liquid hydrocarbon are used as fuel for internal combustion engines.1 The first four aliphatic alcohols (methanol, ethanol, propanol, and butanol) are of interest as fuels because they can be synthesized chemically or biologically.2 Thus, these alcohols have characteristics with utilization in internal combustion engines. Of these alcohols, methanol has received a lot of attention as a low-carbon fuel. Although methanol is generally more toxic and has lower energy density, it is less expensive to produce sustainably than ethanol fuel. Methanol is synthesised from hydrocarbon or renewable resources, in particular natural gas and biomass, respectively.3 Methanol can also be produced by multi-electron–multi-proton concerted CO2 reduction. The CO2 reduction to methanol is classified into electrochemical, photochemical and thermocatalytic methods.4–8 For thermocatalytic methods, recently, attention has been focused on the production of methanol from direct CO2 hydrogenation with hydrogen gas. Cu, Au, Pd, Mo and lanthanide-based catalysts are widely used in this reaction. Many studies on electrocatalytic methods have been reported for CO2 reduction to methanol without using hydrogen gas.9–12 Renewable energy, such as solar cells, is used as a power source for electrochemical CO2 reduction, and there is no need to use hydrogen gas. As the CO2 reduction to methanol requires six-electrons coupled to six-protons, the reaction is considered to be kinetically slower, and thus, highly active and selective catalysts are needed. Research on Cu electrodes has been widely used in the electrochemical reduction of CO2. With Cu electrodes, which are widely used in electrochemical CO2, the key issue is how to achieve selectivity for methanol production due to the wide variety of products. To achieve selectivity for methanol production due to the electrochemical CO2 reduction, a method using a biocatalyst having excellent reaction specificity has attracted a great deal of attention. For direct CO2 reduction, dehydrogenases have been particularly paid high interest. Moreover, dehydrogenase enzymes are capable of reducing CO2 into alcohols selectively and directly under ambient conditions and in aqueous environments.13–16 For example, CO2 reduction to methanol is feasible with a three-step enzyme cascade including formate dehydrogenase (FDH), formaldehyde dehydrogenase (FldDH), and alcohol dehydrogenase (ADH), as shown in Fig. 1.15,16
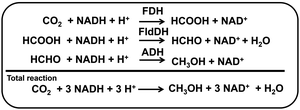 | ||
| Fig. 1 Reaction steps for the enzyme-catalyzed CO2 reduction to methanol through a three-step cascade of dehydrogenases (FDH, FldDH and ADH) with NAD+/NADH redox coupling. | ||
In this system, NADH functions as a common co-enzyme for the three dehydrogenases. However, electrochemically recycling NAD+ to NADH requires overcoming technically high hurdles. Usually, electrochemical NAD+ reduction results in the production of the single-electron reduced NAD+ and then the formation of the NAD dimer, (NAD)2.17–21 Moreover, the reaction between NAD+ and (NAD)2 is an irreversible process, since (NAD)2 is an inactive co-enzyme for NAD+-dependent dehydrogenases such as FDH, AldDH and ADH. To prevent the dimerization of NAD(P)+, it has been reported that NAD(P)+ electrochemically is reduced to NAD(P)H via ferredoxin-NADP+ reductase (FNR) and diaphorase using methylviologen (MV2+) as an electron mediator. Moreover, the electrochemical reduction of ketone or aldehyde to alcohol with ADH has also been reported.22 Even if the electrochemical reduction of NAD(P)+ to NAD(P)H could be achieved, the affinity between NAD(P)H and ADH does not change; thus, ADH catalytic activity cannot be controlled in the electrochemical system using NAD(P)+/NAD(P)H redox coupling. In addition, FNR is a very expensive biocatalyst, and the NADH regeneration system using diaphorase has problems for poor reproducibility. On the other hand, some studies are also underway on systems that directly use electron mediators such as MV2+ as co-enzymes for biocatalysts instead of NAD+. The single-electron reduced MV (cation radical form; MV+˙) has been found to function as a co-enzyme for many NAD+ dependent dehydrogenases.23,24 Since MV2+ can be easily reduced to MV+˙ electrochemically (lower applied potential >−1.0 V vs. Ag/AgCl), it can be expected to be useful for enzyme-catalyzed CO2 reduction to methanol through a three-step cascade of dehydrogenases (FDH, FldDH and ADH) without any other additional biocatalysts, FNR or diaphorase. In order to improve the efficiency of the system for electrochemical CO2 reduction to methanol using MV2+ as an electron mediator, it is necessary to improve the efficiency of each of a three-step cascade of dehydrogenases (FDH, FldDH and ADH).
In this study, the bioelectrocatalytic formaldehyde reduction to methanol with ADH from Saccharomyces cerevisiae using MV2+ as an electron mediator as shown in Fig. 2 was developed toward establishing a method for synthesizing CO2 to methanol.
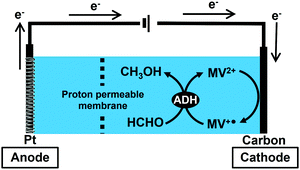 | ||
| Fig. 2 Outline for bioelectrocatalytic formaldehyde reduction to methanol with ADH from Saccharomyces cerevisiae using MV2+ as an electron mediator. | ||
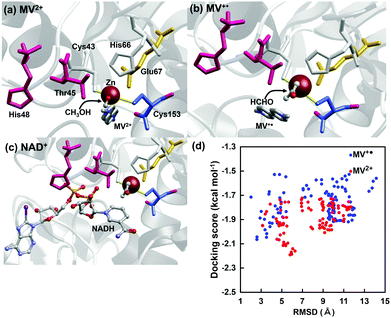
To investigate the effectiveness of the electron mediator MV2+ for ADH-catalyzed formaldehyde reduction to methanol, a docking simulation was investigated to clarify the validity of the binding of MV2+ or MV+˙ to the substrate-binding site of ADH. The crystal structure of ADH was obtained from the Protein Data Bank (PDB) database (PDB ID: 4W6Z)25 to prepare a molecular model of ADH for docking simulation with MV2+ or MV+˙. The docking simulation using the molecular model of ADH with MV2+ or MV+˙ was carried out by the MyPresto version 5.0 program provided by the Next Generation Natural Product Chemistry (N2 PC).26 As a docking site for the substrate, the grid size was set to 40 × 40 × 40 points with a grid spacing of 0.61 Å centered on the original ligand of the ADH crystal structure. The grid box contains the entire substrate-binding pocket of ADH, providing enough space for the ligand translational and rotational walk. The standard docking protocol for rigid and flexible ligand docking was carried out. In the MV2+ or MV+˙ binding to ADH, 6 amino acid residues (Cys43, Thr45, His48, His66, Glu67, Cys153) composed of the substrate-binding pocket of ADH possibly move flexibly and suit for MV2+ or MV+˙. The molecular models were subjected to 100 independent runs per ligand, and other parameters were set to the default values. Fig. 3 shows the docking simulation for MV2+, MV+˙ or NAD+ to the substrate-binding site of ADH. Fig. 3(d) shows the relationship between root mean square deviation (RMSD) and docking score in MV2+ (blue) or MV+˙ (red) to the substrate-binding site of ADH. The RMSD value was estimated as the measure of the average distance between the backbone atoms of superimposed ADH. The docking score for MV2+ or MV+˙ binding to ADH was a calculated value of binding affinity by a score function. The binding mode of MV2+ or MV+˙ to the substrate binding site of ADH was evaluated from the relationship between RMSD and the docking score. From the result of Fig. 3(d), there is no significant difference in RMSD value between MV2+ and MV+˙.
A docking model in which MV2+ or MV+˙ is bound closest to the substrate binding site of ADH (the one with the smallest RMSD value) is shown in Fig. 3(a or b). As shown in Fig. 3(a and b), it also was suggested that there was no significant difference in the binding mode to ADH in MV2+ and MV+˙. It was presumed that MV2+ or MV+˙ was closely located at the NAD+ binding site of ADH, as shown in Fig. 3(c). From these results, it is presumed that MV2+ or MV+˙ can bind to the substrate binding site of ADH and can contribute to formaldehyde reduction to methanol. We previously reported that the FDH-catalyzed CO2 reduction requires two electrons and the important process is how to supply electrons from MV+˙ to CO2 twice in FDH on the basis of the docking simulation and electrochemical techniques such as cyclic voltammogram.27 As the formaldehyde reduction catalyzed by ADH also requires two molecules of MV+˙, thus, it is presumed that the electrochemical reduction of formaldehyde by ADH also proceeds by the same mechanism in the previously reported FDH-based system.
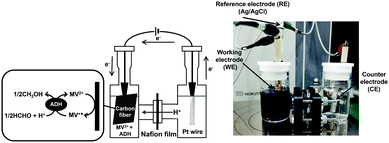
The electrochemical formaldehyde reduction to methanol with a platinum wire electrode (counter electrode), carbon fabric paper (FCP) electrode (working electrode) and Ag/AgCl electrode as a reference was carried out using a H-type electrochemical cell, as shown in Fig. 4. The volume of each cell was 28.0 mL. MV2+ dichloride was supplied by Tokyo Kasei Co. Ltd. ADH and the proton permeable film, Nafion® 117 film, were purchased from Sigma-Aldrich Co. Ltd. Carbon fabric paper (CFP) (TGP-H-030) was obtained from TORAY INDUSTRIES, INC. Extremal bias was applied against an Ag/AgCl electrode. ADH was added to the working electrode side. The chambers of the working and counter electrode sides were connected via the Nafion® 117. The active area of CFP was adjusted to be 3.75 cm2. Current was measured with an electrochemical analyzer (ALS1200C BAS Inc.). The electrolyte on the counter electrode side is composed of 17 mL of argon gas-saturated solution containing 1.0 mM sodium pyrophosphate buffer (pH 7.4). The electrolyte on the working electrode side is composed of 17 mL of argon gas-saturated solution containing 100 mM MV2+, 0.13 mM formaldehyde and ADH in 50.0 mM sodium pyrophosphate buffer (pH 7.4). The amount of ADH added varied between 2.36 and 23.6 nmol. Extremal bias was set to −700 mV against the Ag/AgCl electrode due to the single-electron reduction potential of MV2+.
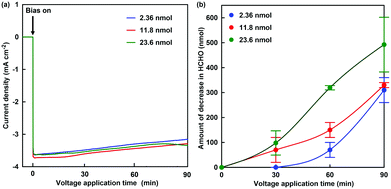
The formaldehyde concentration was quantified using a Nash reagent consisting of acetylacetone and acetic acid/ammonium acetate buffer. A colour reaction for formaldehyde depends on the synthesis of diacetyldihydrolutidine (DDL; absorption maximum: λmax = 410 nm) from acetylacetone and formaldehyde in the presence of excess of ammonium salt. The solution on the working electrode side was sampled for each reaction time, and the formaldehyde concentration was quantified with UV-visible absorption spectroscopy (SHIMADZU, MultiSpec-1500) using the Nash method. Fig. 5(a) shows the time dependence of the current density with continuous voltage application (−700 mV vs. Ag/AgCl electrode) in the electrochemical formaldehyde reduction to methanol with MV2+ and ADH. In all cases, a reduction current of approximately −3.2 mA cm−2 was observed with the extremal bias of −700 mV against the Ag/AgCl electrode. This indicates that the amount of ADH has almost no effect on the reduction current with extremal bias application. As shown in the photograph below Fig. 4, the colour of the solution on the working electrode side changes to blue due to the production of MV+˙. It was suggested that MV2+ could be efficiently reduced to MV+˙ by using this electrochemical system. Fig. 5(b) shows the time dependence of the amount of decrease in formaldehyde with continuous voltage application under various amounts of ADH.
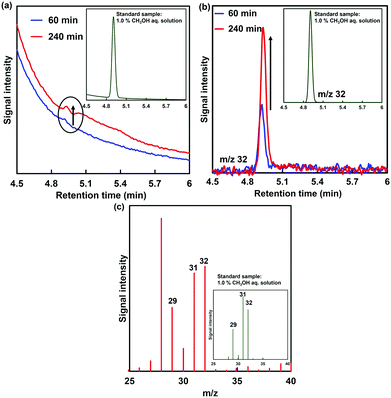
As the amount of ADH increased, the amount of decrease in formaldehyde also tended to increase, as shown in Fig. 5. In any case of the amount of ADH, the amount of decrease in formaldehyde after 90 min continuous voltage application exceeds the initial amount of ADH. As the apparent amount of methanol produced was estimated from the decrease in formaldehyde, the turnover number (TON) in the system of 2.36, 11.8 and 23.6 nmol of ADH after 90 min continuous voltage application was estimated to be 131.4, 28.0 and 20.9, respectively. In general, it is predicted that TON is independent of the amount of ADH with the excess of formaldehyde and MV+˙. However, the re-reduction of MV2+ bound to the substrate binding pocket of ADH is an important factor in the conversion of ADH-catalyzed formaldehyde to methanol using the electrochemical reduction of MV2+.27 It is considered that the MV2+ bound to the substrate binding pocket of ADH is easy to be reduced under the condition of the lower amount of ADH. Therefore, it is predicted that a difference in TON with respect to the amount of ADH was observed. The conversion yields for formaldehyde (initial amount: 2.21 μmol) to methanol in the system of 2.36, 11.8 and 23.6 nmol of ADH after 90 min continuous voltage application were estimated to be 14.0, 14.9 and 22.3%, respectively. Although the amount of decrease in formaldehyde was estimated as the apparent amount of methanol produced, the methanol produced could not be directly verified in this system. Thus, direct detection for methanol was attempted using gas chromatography–mass spectrometry (GC–MS; GCMS-QP2020 SHIMADZU Corporation). A crossbond dimethyl polysiloxane column (Restek Rtx-1; column length: 0.32 mm I.D. × 60 m; film thickness: 5.0 μm) was equipped for detecting methanol. The temperatures of the column and detector were 40.0 and 200.0 °C, respectively. He gas was used as the carrier gas. The electrochemical reduction was the same as in Fig. 5, and ADH was adjusted to 23.6 nmol. Fig. 6(a) shows the gas chromatogram of the sample in the working electrode side with continuous voltage application (−700 mV vs. Ag/AgCl electrode). The chromatogram of 1.0% methanol aqueous solution as a reference sample was also indicated in the inset of Fig. 6(a). Fig. 6(b) also shows the chromatogram using mass spectrometry as a detector (m/z 32).
From the chromatogram of the standard methanol sample, a methanol-based signal was observed with a retention time of 4.9 min. As shown in Fig. 6(a), the signal peak with a retention time of 4.9 min was increased with increasing continuous voltage application time. Moreover, the signal peak with a retention time of 4.9 min using mass spectrometry as a detector (m/z 32: molecular weight of methanol) also was increased with increasing continuous voltage application time. Fig. 6(c) shows the mass spectra of methanol peaks in GC–MS analysis of the working electrode side with continuous voltage application. As shown in Fig. 6(c), the m/z 29, 31 and 32 peaks based on methanol were observed by applying a continuous voltage application for 240 min. Thus, it also was confirmed by GC/MS that methanol was produced in this system. As shown in Fig. 6(c), the fragmentation pattern differs from that of pure methanol. The different fragment patterns are presumed to be due to the inflow of air from outside the system or oxygen produced on the counter electrode side.
In conclusion, a system for formaldehyde reduction to methanol with ADH as a catalyst is developed only by electrochemical reduction of MV2+ without using a NADH regeneration using FNR or diaphorase toward establishing a method for CO2 reduction to methanol. After 90 min continuous external bias, the conversion yield for formaldehyde to methanol was improved up to 22.3%.
Conflicts of interest
There are no conflicts to declare.Acknowledgements
The authors thank Profs Takashi Nakazono and Yusuke Yamada of Osaka City University for helping to measure the GC/MS.Notes and references
- C. P. Cooney, Y. Yeliana, J. J. Worm and J. D. Naber, Energy Fuels, 2009, 23, 2319 CrossRef CAS.
- S. Szwaja and J. D. Naber, Fuel, 2010, 89, 1573 CrossRef CAS.
- Irena And Methanol Institute (2021), Innovation Outlook: Renewable Methanol, International Renewable Energy Agency, Abu Dhabi.
- M. D. Porosoff, B. H. Yan and J. G. G. Chen, Energy Environ. Sci., 2016, 9, 62 RSC.
- S. Kar, J. Kothandaraman, A. Goeppert and G. K. S. Prakash, J. CO2 Util., 2018, 23, 212 CrossRef CAS.
- E. Alberico and M. Nielsen, Chem. Commun., 2015, 51, 6714 RSC.
- R. Kanega, N. Onishi, S. Tanaka, H. Kishimoto and Y. Himeda, J. Am. Chem. Soc., 2021, 143, 1570 CrossRef CAS PubMed.
- Y. Liu, F. Li, X. Zhang and X. Ji, Cur. Opin. Green Sustain. Chem., 2020, 23, 10 CrossRef.
- W. J. Zhang, Y. Hu, L. B. Ma, G. Y. Zhu, Y. R. Wang, X. L. Xue, R. P. Chen, S. Y. Yang and Z. Jin, Adv. Sci., 2018, 5, 1700275 CrossRef PubMed.
- N. Al-Rowaili, A. Jamal, M. S. Ba Shammakh and A. Rana, ACS Sustainable Chem. Eng., 2018, 6, 15895 CrossRef.
- J. Albo, M. Alvarez-Guerra, P. Castaño and A. Irabien, Green Chem., 2015, 17, 2304 RSC.
- J. L. Qiao, Y. Y. Liu, F. Hong and J. J. Zhang, Chem. Soc. Rev., 2014, 43, 631 RSC.
- J. Luo, A. S. Meyer, R. V. Mateiu and M. Pinelo, New Biotechnol., 2015, 232, 319 CrossRef PubMed.
- S. Schlager, A. Dibenedetto, M. Aresta, D. H. Apaydin, L. M. Dumitru, H. Neugebauer and N. S. Sariciftci, Energy Technol., 2017, 5, 812 CrossRef CAS PubMed.
- R. Obert and C. Dave, J. Am. Chem. Soc., 1999, 121, 12192 CrossRef CAS.
- S. W. Xu, Y. Lu, J. Li, Z. Y. Jiang and H. Wu, Ind. Chem. Eng. Res., 2006, 45, 4567 CrossRef CAS.
- K. Hironaka, S. Fukuzumi and T. Tanaka, J. Chem. Soc., Perkin Trans. 2, 1984, 1705 RSC.
- H. Wu, C. Tian, X. Song, C. Liu, D. Yang and Z. Jiang, Green Chem., 2013, 15, 1773 RSC.
- F. Hollmann, I. W. C. E. Arends and K. Buehler, ChemCatChem, 2010, 2, 762 CrossRef CAS.
- F. Hollmann, B. Witholt and A. Schmid, J. Mol. Catal. B: Enzym., 2002, 19–20, 167 CrossRef CAS.
- D. E. Torres Pazmino, M. Winkler, A. Glieder and M. W. Fraaije, J. Biotechnol., 2010, 146, 9 CrossRef CAS PubMed.
- S. Kuwabata, K. Nishida and H. Yoneyama, Chem. Lett., 1994, 407 CrossRef CAS.
- Y. Amao, Sustainable Energy Fuels, 2018, 2, 1928 RSC.
- Y. Amao and R. Kataoka, Catal. Today, 2018, 307, 243 CrossRef CAS.
- S. B. Raj, S. Ramaswamy and B. V. Plapp, Biochemistry, 2014, 53, 5791 CrossRef CAS PubMed.
- MyPresto version 5.0 program provided by Next Generation Natural Product Chemistry (N2 PC).
- A. Miyaji and Y. Amao, Phys. Chem. Chem. Phys., 2020, 22, 18595 RSC.
| This journal is © The Royal Society of Chemistry 2022 |

