 Open Access Article
Modulating oxygen vacancies of CeO2 nanospheres by Zn-doping: an efficient electrocatalyst for N2 reduction under ambient conditions†
Yuyao
Ji‡
 a,
Mingyu
Yang‡
 ab,
Wendong
Cheng
a,
Chengbo
Li
b and
Xingquan
Liu
 *a
*a
aUniversity of Electronic Science and Technology of China, Chengdu 610054, China. E-mail: lxquan@uestc.edu.cn
bCollege of Chemistry and Materials Science, Sichuan Normal University, Chengdu 610068, Sichuan, China
First published on 22nd September 2022
Abstract
At present, most industrial NH3 production comes from the Haber–Bosch process, which causes a series of serious environmental pollution problems. Electrochemical N2 reduction is regarded as a green pathway to deal with this problem. Recently, CeO2 has attracted much attention due to its high thermal stability. Metal doping with smaller ion radius is an effective strategy to regulate oxygen vacancies, increase the defect concentration and enhance the catalyst activity. Herein, we developed Zn-doped CeO2 nanospheres (Zn–CeO2) for the electrochemical NRR. In 0.1 M Na2SO4, Zn–CeO2 achieves a large NH3 yield of 29.01 μg h−1 mgcat.−1 and a high faradaic efficiency of 10.3% at −0.20 V vs. reversible hydrogen electrode, and it also shows good structure stability. The density functional theory (DFT) calculations revealed the reaction mechanism of NRR activity regulated by the doping metal.
As an important cornerstone of world energy, ammonia gas has been widely used in many fields, such as fertilizers, medicaments, dyes, etc.1 NH3 is also gradually being recognized as a potential alternative to fossil fuels as a transport fuel characterized by high energy density and no CO2 emissions.2 Although N2 has a very high content in the atmosphere, it is difficult to convert it into NH3 at room temperature and pressure due to its high nitrogen triple bond energy and strong dipole moment.3–5 For nearly a century, most industrial NH3 production has come from the Haber–Bosch process, which uses Fe or Ru as a catalyst and nitrogen and hydrogen as raw materials.6–9 However, the temperature and pressure required for this process are very high, and large amounts of carbon dioxide are emitted, leading to a series of environmental problems. Therefore, it is very necessary to explore a low energy consumption and environmentally friendly NH3 synthesis method.
As an important oxide catalyst, cerium oxide material has been a research hotspot in the field of ternary catalysts, environmental catalysis and catalyst supports for decades.10,11 However, the reported NRR activity of CeO2 related catalysts is still not high, which is mainly caused by their low electrical conductivity and poor N2 adsorption and activation.9 Recent reports have highlighted that oxygen vacancies (OV) can receive foreign electrons to enhance N2 adsorption and activation, thereby improving the NRR performance of the catalysts.12–15 Moreover, a large number of applications of CeO2 in the field of electrocatalysis mainly benefit from the existence of OV.16 Furthermore, a recent report by Liu et al.17 showed that OVs of CeO2 can be significantly enhanced via doping with transition elements; meanwhile, Liu et al.18 also proved that ZnO is an efficient NRR electrocatalyst. The above studies further motivated us to use elements with smaller ionic radii as dopants to improve the NRR performance of pure CeO2.
In this work, we report Zn-doped CeO2 nanospheres to modulate oxygen vacancies for promoting the NRR performance. As observed, in 0.1 M Na2SO4, the NH3 yield rate of Zn–CeO2 (29.01 μg h−1 mg cat.−1) is much better than that of undoped CeO2, with a high faradaic efficiency (FE) of 10.3%. It also shows good stability. Density functional theory (DFT) calculations reveal the mechanism that doped pairs are the active sites.
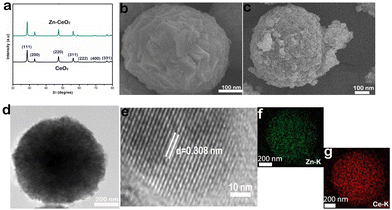
The XRD patterns of CeO2 and Zn–CeO2 nanospheres are shown in Fig. 1a, and all the XRD peaks positioned in each sample correspond to (111), (200), (220), (311), (222), (400), (331), and (420) planes. It is worth noting that no other secondary or impurity peaks are observed in Fig. 1a, indicating that Zn has been successfully doped with CeO2. Scanning electron microscopy (SEM) reveals the CeO2 nanospheres before and after Zn doping, as shown in Fig. 1b and c. The high-resolution TEM (HRTEM) image reveals the crystallographic fringes of 0.308 nm and can be well assigned to the (111) lattice plane of CeO2 (Fig. 1e). Furthermore, the corresponding elemental mapping images (Fig. 1f and g) of Zn–CeO2 also demonstrate that Zn is successfully doped in CeO2. From the above characterization results, it can be seen that we successfully synthesized a Zn–CeO2 nanosphere catalyst.
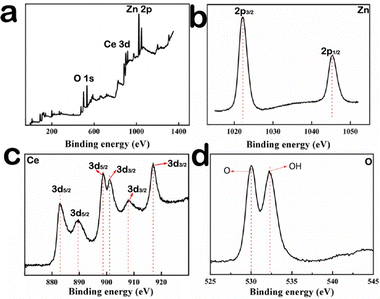
In order to further determine the element valence in the composite material, the XPS spectrum is necessary, and the results show the presence of Ce, O, and Zn elements in the Zn–CeO2 materials. Fig. 2a shows the survey scan of Ce 3d, Zn 2p and O 1s. The XPS spectra of Zn 2p3/2 and Zn 2p1/2 correspond to the binding energies of 1021.6 eV and 1043.8 eV (Fig. 2b). The spin-orbital splitting of 23.1 eV, between the peaks, confirmed that Zn exists as pure metal on the CeO2 matrix rather than its oxide form.19Fig. 2c shows the Ce 3d spectrum, and the peaks located in the range of 881–902 eV correspond to Ce 3d5/2; meanwhile, the peaks in the range of 901–921 eV correspond to Ce 3d3/2.20–22 The above results can be attributed Ce3+ and Ce4+.23 And they are match well with the previous reports.24,25Fig. 2d shows the XPS spectrum of O 1s. The peak seen at low binding energy (529.9 eV) corresponds to the oxygen atom in the CeO2 lattice,26 and the other peak at high binding energy (532.4 eV) corresponds to chemisorbed oxygen of the surface hydroxyl group.27 From the above results, it can be concluded that Ce element exists in the +3 or +4 oxidation state in the composite. For example, in the original cerium oxide, Zn exists in the 0 oxidation state, and oxygen exists in the −2 oxidation state and in the 0 oxidation state. Fig. S1 (ESI†) shows the Raman spectra of Zn–CeO2 and pure CeO2. Notably, the intensity in Zn–CeO2 is less than pure CeO2, implying that more oxygen vacancies are present in Zn–CeO2. Meanwhile, Fig. S2 (ESI†) shows the room temperature electron spin resonance (ESR) spectra of pure CeO2 and Zn–CeO2. The latter shows a definite oxygen vacancy signal at g = 2.018, indicating the formation of a large number of oxygen vacancies after the Ce3+ center.
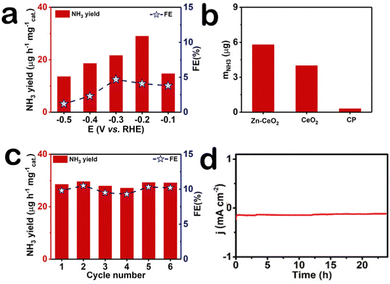
Our electrochemical tests are carried out in U-shaped electrolyzers separated by membranes. The optimum catalyst load is 0.1 mg cm−2. For more accurate determination of ammonia concentration, as shown in Fig. S3a (ESI†), the time-dependent current density curves of Zn–CeO2 were obtained. Fig. S3b (ESI†) presents the UV-Vis absorption. After electrolysis, the obtained NH3 in the solution phase was spectrophotometrically determined by the indophenol blue method,28 and another possible by-product (N2H4) was detected by the method of Watt and Chrisp.29 The corresponding calibration curves are shown in Fig. S4 (ESI†), respectively. It is worth noting that we did not detect the byproduct hydrazine in the reaction solution (Fig. S5, ESI†). The ammonia production rate and Faraday efficiency of the catalyst at different voltages are shown in Fig. 3a, and the ammonia production rate (29.01 μg h−1 mgcat.−1) and Faraday efficiency (10.3%) of the catalyst were the highest at −0.2 V, outperforming most reported NRR electrocatalysts listed in Table S1 (ESI†). To better demonstrate the NRR performance of the Zn–CeO2, we compare the electrochemical activity between the material and the precursor by the amount of ammonia produced (Fig. 3b). The results showed that the composites Zn–CeO2/CP showed the best NRR activity, and its NRR performance is much higher than that of CeO2/CP and bare CP. Stability is another indicator of electrochemical performance; the ammonia production rate and Faraday efficiency were tested after six cycles at −0.6 V (Fig. 3c). And UV-vis absorption spectra (Fig. S6, ESI†) confirm the high stability of Zn–CeO2/CP. After the cycling test, we found that the ammonia production rate and Faraday efficiency of the catalyst did not change basically. In addition, the current density of the catalyst did not fluctuate after 24 hours of electrolysis (Fig. 3d). This further shows that the catalyst has good electrochemical stability. The amount of NH3 measured in the Ar-saturated electrolyte at each potential was very small and insignificant compared to the N2-saturated electrolyte (Fig. S7, ESI†), indicating that the NH3 product is mainly generated by the supply of N2 electrocatalyzed by Zn–CeO2.
 | ||
| Fig. 3 (a) NH3 yields and FEs at each given potential. (b) NH3 yields at −0.20 V. (c) Stability test of Zn–CeO2 for 6 cycles at −0.20 V. (d) The curve for Zn–CeO2 at −0.20 V. | ||
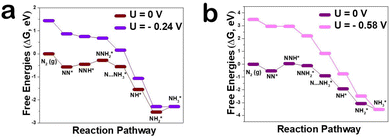
In order to explore the mechanism by which Zn, as a dopant, regulates defect concentration to enhance NRR activity from a microscopic perspective, the reaction mechanism of the NRR on the CeO2(111) surface was observed by DFT calculation. There are several well-established reaction pathways for the NRR depending on the specific adsorption modes of N2 molecules.30,31 To evaluate the potential of Zn–CeO2 as an electrocatalyst for nitrogen reduction, typical reaction paths through the distal mechanism were optimized and the corresponding free energy profiles/structures are summarized in Fig. 4a. Importantly, the N2 adsorption energy on the Zn–CeO2(111) surface with VO is higher than that on pure MnO2 (−0.24 vs. −0.58 eV). These results are attributed to the stronger electronic interaction between VO, N2 and Ce atoms. However, the barrier of NNH* protonation is greatly reduced after Zn doping. The second NH3* formation is the Zn–CeO2 limiting step with a critical energy barrier of 0.24 eV (NH2* + H+ + e− → NH3*). As shown in Fig. S8 (ESI†), the results show that the Zn doped surface has more vacant orbitals, which can enhance the adsorption energy of N2. The density of states (DOS) indicates that two orbitals hybridize after N2 adsorption by adding H atoms to the adsorbent, and N2 hydrogenation is performed by adding H atoms to the adsorbent based on a distal or alternate mechanism (Fig. S9, ESI†). The top panel of Fig. S10 (ESI†) shows the end-to-end adsorption configuration (a) with VO and (b) without VO for the N2 molecule on the CeO2(111) surface. For the former, the N2 molecule occupies VO, and one of its terminal N atoms interact directly with VO. In general, our theoretical calculations point out that Zn atoms can significantly improve the NRR performance, which is in good agreement with the experimental electrochemical results.
In conclusion, Zn has been shown to be an effective dopant to regulate the CeO2 defect concentration to enhance the NRR performance. In 0.1 M Na2SO4, Zn–CeO2 attains the largest NH3 yield of 29.01 μg h−1 mgcat.−1 and highest FE of 10.3% at −0.20 V. Moreover, it has good electrochemical stability, and its catalytic activity is basically unchanged after 24 hours of electrolysis. DFT calculation shows that doping Zn element with small ion radius in CeO2(111) can regulate and increase the concentration of oxygen vacancies, thus promoting the adsorption and activation of N2. Moreover, Ce3+ formed by oxygen vacancy defects is more likely to capture electrons, thus improving the NRR activity of the catalyst. This work not only provides an attractive scheme for the construction of the defect concentration on the catalyst surface but also opens new opportunities to explore cerium-based catalysts for N2 fixation applications.
Conflicts of interest
There are no conflicts to declare.Acknowledgements
This work was supported by the National Natural Science Foundation of China (No. 21575137).References
- V. Smil, Detonator of the population explosion, Nature, 1999, 400, 415 CrossRef CAS.
- M. D. Fryzuk, J. B. Love, S. J. Rettig and V. G. Young, Ignition of methane-air mixtures by isothermal hot wires, Science, 1997, 275, 1445–1447 CrossRef CAS.
- T. Vegge, R. Z. Sørensen, A. Klerke, J. S. Hummelshøj, T. Johannessen, J. K. Nørskov and C. H. Christensen, Indirect hydrogen storage in metal ammines, Br. Weld. Res. Assoc., 2008, 533–564 CAS.
- A. R. Singh, B. A. Rohr, J. A. Schwalbe, M. Cargnello, K. Chan, T. F. Jaramillo, I. Chorkendorff and J. K. Nørskov, Electrochemical ammonia synthesis-the Selectivity challenge, ACS Catal., 2017, 7, 706–709 CrossRef CAS.
- H. Jia and E. A. Quadrelli, Mechanistic aspects of dinitrogen cleavage and hydrogenation to produce ammonia in catalysis and organometallic chemistry: relevance of metal hydride bonds and dihydrogen, Chem. Soc. Rev., 2014, 43, 547–564 RSC.
- I. Dybkjaer, Ammonia catalysis and manufacture, ed. A. Nielsen, Springer, Heidelberg, 1995, pp. 199–308, Ammonia production processes Search PubMed.
- L. Zhang, X. Ji, X. Ren, Y. Luo, X. Shi, A. M. Asiri, B. Zheng and X. Sun, A novel strategy to synthesize Au nanoplates and their application for enzymeless H2O2 detection, ACS Sustainable Chem. Eng., 2018, 6, 9550–9554 CrossRef CAS.
- J. Han, X. Ji, X. Ren, G. Cui, L. Li, F. Xie, H. Wang, B. Li and X. Sun, MoO3 nanosheets for efficient electrocatalytic N2 fixation to NH3, J. Mater. Chem. A, 2018, 6, 12974–12977 RSC.
- R. Zhang, Y. Zhang, X. Ren, G. Cui, A. M. Asiri, B. Zheng and X. Sun, High-efficiency electrosynthesis of ammonia with high selectivity under ambient conditions enabled by VN nanosheet array, ACS Sustainable Chem. Eng., 2018, 6, 9545–9549 CrossRef CAS.
- Y. Ji, J. Liu, S. Hao, Y. Xiao, L. Li and X. Liu, Full water splitting by a nanoporous CeO2 nanowire array under alkaline conditions, Inorg. Chem. Front., 2020, 7, 2533–2537 RSC.
- B. Xu, L. Xia, F. Zhou, R. Zhao, H. Chen, T. Wang, Q. Zhou, Q. Liu, G. Cui, X. Xiong, F. Gong and X. Sun, ACS Sustainable Chem. Eng., 2019, 7, 2889–2893 CrossRef CAS.
- R. Yousefi and B. Kamaluddin, Effect of S- and Sn-doping to the optical properties of ZnO nanobelts, Appl. Surf. Sci., 2009, 255, 9376–9380 CrossRef CAS.
- C. Lv, C. Yan, G. Chen, Y. Ding, J. Sun, Y. Zhou and G. Yu, An amorphous noble-metal-free electrocatalyst that enables nitrogen fixation under ambient conditions, Angew. Chem., Int. Ed., 2018, 57, 6073–6076 CrossRef CAS PubMed.
- H. Li, J. Shang, Z. Ai and L. Zhang, Efficient visible light nitrogen fixation with BiOBr nanosheets of oxygen vacancies on the exposed {001} facets, J. Am. Chem. Soc., 2015, 13, 6393–6399 CrossRef.
- H. Xie, H. Wang, Q. Geng, Z. Xing, W. Wang, J. Chen, L. Ji, L. Chang, Z. Wang and J. Mao, Oxygen vacancies of Cr-doped CeO2 nanorods that efficiently enhance the performance of electrocatalytic N2 fixation to NH3 under ambient conditions, Inorg. Chem., 2019, 58, 5423–5427 CrossRef CAS PubMed.
- F. Esch, S. Fabris, L. Zhou, T. Montini, C. Africh, P. Fornasiero, G. Comelli and R. Rosei, Electron localization determines defect formation on ceria substrates, Science, 2005, 309, 752–755 CrossRef CAS PubMed.
- B. Liu, C. Li, G. Zhang, X. Yao, S. S. C. Chuang and Z. Li, Oxygen vacancy promoting dimethyl carbonate synthesis from CO2 and methanol over Zr-Doped CeO2 nanorods, ACS Catal., 2018, 8, 10446–10456 CrossRef CAS.
- Y. Liu, Y. Li, D. Huang, H. Zhang and K. Chu, ZnO Quantum dots coupled with graphene toward electrocatalytic N2 reduction: experimental and DFT investigations., Chem. – Eur. J., 2019, 25, 11933–11939 CrossRef CAS PubMed.
- J. F. Moulder, W. F. Stickle, P. E. Sobol and K. D. Bomben, Handbook of X-ray photoelectron spectroscopy, ed. J. Chastain, PerkinElmer Corporation, 1992 Search PubMed.
- J. López, L. Gilbank, T. García, B. Solsona, S. Agouram and L. Torrente-Murciano, Designing an improved transition metal phosphide catalyst for hydrogen evolution using experimental and theoretical trends, Appl. Catal., B, 2015, 174, 403–412 CrossRef.
- D. Chu, Y. Masuda, T. Ohji and K. Kato, Room-temperature synthesis and characterization of porous CeO2 thin films, Phys. Status Solidi A, 2012, 209, 139–142 CrossRef CAS.
- Y. Ji, J. Liu, S. Hao, Y. Xiao, L. Li and X. Liu, Full water splitting by a nanoporous CeO2 nanowire array under alkaline conditions., Inorg. Chem. Front., 2020, 7, 2533–2537 RSC.
- S. Sathyamurthy, K. J. Leonard, R. T. Dabestani and M. P. Paranthaman, Reverse micellar synthesis of cerium oxide nanoparticles, Nanotechnology, 2005, 16, 1960–1964 CrossRef CAS.
- M. M. Khan, W. Khan, M. Ahamed and A. N. Alhazaa, Microstructural properties and enhanced photocatalytic performance of Zn doped CeO2 nanocrystals., Sci. Rep., 2017, 7, 12560–12570 CrossRef PubMed.
- I. A. P. Farias, C. C. L. D. Santos and F. C. Sampaio, Antimicrobial activity of cerium oxide nanoparticles on opportunistic microorganisms: A systematic review, BioMed Res. Int., 2018, 2018, 1–14 CrossRef PubMed.
- J. Zhang, D. Gao, G. Yang, J. Zhang, Z. Shi, Z. Zhang and D. Xue, Synthesis and magnetic properties of Zr doped ZnO nanoparticles, Nanoscale Res. Lett., 2011, 6, 587 CrossRef PubMed.
- Y. Ji, W. Cheng, C. Li and X. Liu, Oxygen vacancies of CeO2 nanospheres by Mn-doping: An efficient electrocatalyst for N2 reduction under ambient conditions., Inorg. Chem., 2022, 61, 28–31 CrossRef CAS PubMed.
- D. Zhu, L. Zhang, R. E. Ruther and R. J. Hamers, Photo-illuminated diamond as a solid-state source of solvated electrons in water for nitrogen reduction, Nat. Mater., 2013, 12, 836–841 CrossRef CAS PubMed.
- G. W. Watt and J. D. Chrisp, Spectrophotometric method for determination of hydrazine, Anal. Chem., 1952, 24, 2006–2008 CrossRef CAS.
- D. Ma, Z. Zeng, L. Liu and Y. Jia, Theoretical screening of the transition metal heteronuclear dimer anchored graphdiyne for electrocatalytic nitrogen reduction, J. Energy Chem., 2021, 54, 501–509 CrossRef.
- F. Wang, H. Zhao, J. Liang, T. Li, Y. Luo, S. Lu, X. Shi, B. Zheng, J. Du and X. Sun, Magnetron sputtering enabled synthesis of nanostructured materials for electrochemical energy storage, J. Mater. Chem. A, 2020, 8, 20260–20285 RSC.
Footnotes |
| † Electronic supplementary information (ESI) available: Experimental section and supplementary figures. See DOI: https://doi.org/10.1039/d2ya00241h |
| ‡ Yuyao Ji and Mingyu Yang contribute equally to this manuscript. |
| This journal is © The Royal Society of Chemistry 2022 |


