Development of a mid-infrared sensor system for early fire identification in cotton harvesting operations
Yafei
Li
a,
Yang
Lu
a,
Chuantao
Zheng
 *a,
Shuo
Yang
a,
Kaiyuan
Zheng
a,
Fang
Song
a,
Chunguang
Li
*b,
Weilin
Ye
c,
Yu
Zhang
 a,
Yiding
Wang
a and
Frank K.
Tittel
d
aState Key Laboratory of Integrated Optoelectronics, College of Electronic Science and Engineering, Jilin University, 2699 Qianjin Street, Changchun 130012, China. E-mail: zhengchuantao@jlu.edu.cn; Tel: +86-13756090979
bCollege of Biological and Agricultural Engineering, Jilin University, 5988 Renmin Street, Changchun 130022, China. E-mail: lichunguang@jlu.edu.cn
cCollege of Engineering, Shantou University, 243 Daxue Road, Shantou, 515063, P.R. China
dDepartment of Electrical and Computer Engineering, Rice University, 6100 Main Street, Houston, TX 77005, USA
First published on 10th November 2022
Abstract
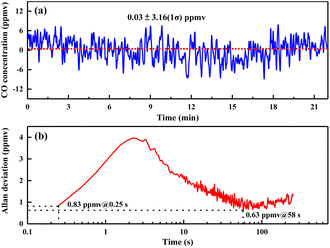
To realize early fire identification in cotton harvesting operations, a mid-infrared carbon monoxide (CO) sensor system was developed. To match the broadband light source with a 15° divergence angle, a multipass gas cell (MPGC) with an effective path length of 180 cm was designed to improve sensor sensitivity, leading to a limit of detection (LoD) of 0.83 parts-per-million by volume (ppmv). A damping module with springs at the bottom and front/back sides was fabricated, which can effectively reduce the vibration intensity by >80%. The sensor system can operate normally from −40 °C to 85 °C by stabilizing the temperature of the optical module through heating or cooling as well as using automotive electronic components. An adaptive early fire identification algorithm based on a dual-parameter threshold alarming method was proposed to avoid false and missing alarms. Field deployments on a harvester verified the good practicability of the sensor system.
1. Introduction
Cotton is an important cash crop and strategic material in China, with large yields and low production costs.1–5 In order to improve cotton picking efficiency and provide comprehensive economic benefits, with the development of agricultural mechanization technology, cotton pickers have been widely used instead of manpower in cotton harvesting operations.6–9 In the process of the cotton harvesting operation, the friction between the high-speed rotating cotton-picking head and the cotton stalk easily produces sparks, and these sparks are unavoidably wrapped in the cotton.10,11 Consequently, early fire, namely smoldering, occurs inside the cotton, which is flameless and difficult to detect.12 Once smoldering changes to flaming combustion and fire, great threats are posed to the safety and lives of people and property. Therefore, there is an urgent need to effectively realize early fire identification.Common fire detection methods mainly include image recognition, and temperature and smoke alarms. As we know, gas as a product of fire appears earlier than a flame, temperature and smoke. So, gas sensors have potential application value in early fire detection.13–15 Compared with traditional gas sensors, such as semiconductor sensors, electrochemical sensors, etc., gas sensors based on infrared absorption spectroscopy have attracted more and more attention because of their good selectivity and precision.16,17 The gas products of cotton smoldering mainly include carbon dioxide (CO2), carbon monoxide (CO) and some other harmful gases. Due to the presence of CO2 in the environment, CO is selected as the characteristic gas for early fire identification in order to avoid interference from the background gas.18–20 In addition, CO is also widely used in various trace gas detection scenarios, such as exhaled gas analysis,21 atmospheric monitoring,22–25 combustion diagnosis,26,27 and soil respiration analysis.28 The detection sensitivity of parts-per-trillion by volume (pptv) levels can be obtained using a mid-infrared quantum cascade laser (MIR-QCL).21,24,28 However, sensor systems based on the MIR-QCL are unsuitable for field deployment due to their large volumes and high cost, which make them unconducive to popularization and application.23,25 Using a non-dispersive infrared absorption (NDIR) detection method, a CO sensor system was developed for early fire identification in cotton harvesting operations by considering both the performance and the cost. In recent years, some commercial NDIR sensors have been developed, such as the aSENSE MIII sensor from Seaseair, the Novagas2 sensor from Novasis, and the MicroSENS 180-HS sensor from Micro-Hybrid. A short optical path was specially designed for miniaturization, resulting in the low sensitivity of these sensors. In addition, these commercial sensors are expensive (up to thousands of dollars) and unsuitable for the popularization of agricultural applications. At the same time, some research studies have also been carried out, mainly focusing on improving the sensitivity, enlarging the optical path lengths, and reducing the power consumption and noise.29–31 However, most of these sensors can only be operated in a laboratory or a good environment, and tend to perform poorly in harsh environments without any protection.
To realize early fire identification in cotton harvesting operations, a low-cost, high-sensitivity, anti-environmental interference sensor system was developed. A multipass gas cell (MPGC) with an effective path length of 180 cm was modeled and fabricated to increase the sensitivity of the sensor system to meet the need for early fire identification. Because of harsh harvesting operation sites, dust and moisture in the air entering the MPGC can affect the optical path structure. Since the sensor is placed on the harvester, large vibration and temperature differences severely influence the stability of the sensor system. Focusing on these problems in the harvesting operation, the developed sensor system was specially designed and optimized. A gas pretreatment module was used to filter out dust and moisture before the injection of ambient air into the MPGC to improve the measurement accuracy. A damping module with springs at the bottom and front/back sides of the sensor system was prepared to effectively reduce the vibration intensity and improve the stability. To cope with the influence of large temperature differences between day and night on the performance of the sensor system, a temperature control module was designed to stabilize the temperature of the optical module through heating or cooling and automotive electronic components were used.
Furthermore, most fire sensors only set one parameter (such as gas concentration, temperature, etc.) as the alarm threshold signal.32 However, once the monitored parameter is changed by external interference (such as vibration and temperature drifts), this detection method is then subject to a false alarm. In order to solve this problem, this work proposes an adaptive early fire identification algorithm based on the combination of the changing magnitude and the changing rate of CO concentration. The dual-parameter threshold alarming method can effectively identify early fire and avoid the occurrence of false alarms and missing alarms.
2. MIR CO sensor using a MPGC
2.1 System structure
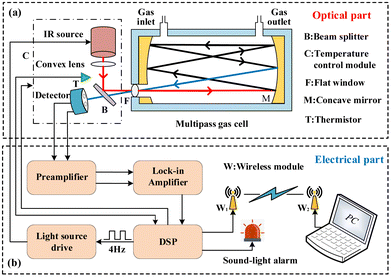
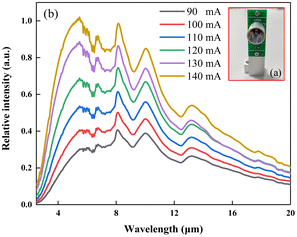
As shown in Fig. 1, the whole system structure consists of an optical part and an electrical part. In the optical part, the emitted light from a light source (Hawkeye Technologies, model IR55) with an approximately 15° divergence angle was converged using a convex lens and then was reflected by a beam splitter into a MPGC. Subsequently, the incident light was reflected six times by two concave mirrors to form an effective optical path length of 180 cm. The concave mirrors had a focal length of 300 mm and a reflectivity of 98%. Then, the light was transmitted to a pyroelectric detector (InfraTec, model LMM-242-IH) through the beam splitter. Since the infrared light source and pyroelectric detector were susceptible to temperature, a temperature control module with an electric heating film (EHF) and a thermoelectric cooler (TEC) was used to adjust the internal temperature of the optical module. In the electrical part, a digital signal processor (DSP, Texas Instruments, model TMS320F28335) was used as the main control unit of the whole sensor system. A 4 Hz square wave signal generated from DSP was used to modulate the infrared light source with a light source driver. At the same time, the modulated optical signal was received and converted to two electrical signals by the pyroelectric detector. The two electric signals were amplified using a preamplifier to match the input range of the custom-made lock-in amplifier. The amplitude of the electric signals was extracted using the lock-in amplifier and then transmitted to the DSP. The DSP converted the amplitude to CO concentration by means of the calibrated and fitted relation. The information was transmitted between the DSP and the LabVIEW-based monitoring platform through a wireless network. Long-term and real-time monitoring of CO concentration was carried out using the monitoring platform and an early fire could be identified through a self-adaptive identification algorithm accompanied by a fire alarm.2.2 Detection theory
Different gases have specific absorption of light at different wavelengths, which conforms to the Lambert–Beer law,33i.e.I(λ) = I0(λ)![[thin space (1/6-em)]](https://www.rsc.org/images/entities/char_2009.gif) exp[−α(λ)cl] exp[−α(λ)cl] | (1) |
| I0(λ) = φ(λ)i | (2) |
I(λ,l) = I0(λ)![[thin space (1/6-em)]](https://www.rsc.org/images/entities/char_2009.gif) exp[−α(λ)cl + m(λ)l + n(λ)l + p(λ)l] exp[−α(λ)cl + m(λ)l + n(λ)l + p(λ)l] | (3) |
Considering the measurement accuracy and system complexity, the dual-channel differential detection method based on the NDIR principle was adopted. The emitted light is absorbed by the target gas in the MPGC and then exits to the two sensing windows of the detector. The central wavelengths of the absorption channel and the reference channel are λ1 and λ2, respectively. The output signals U(λ1,l) and U(λ2,l) of the two corresponding channels can be expressed by eqn (4) and (5), respectively, as
 | (4) |
 | (5) |
 | (6) |
Then, gas concentration c can be obtained by eqn (6), i.e.
 | (7) |
2.3. Optical design
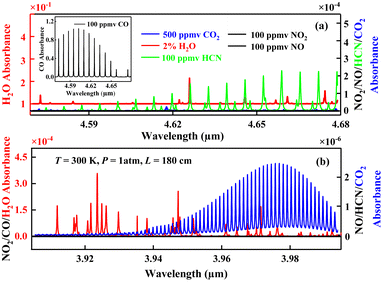
The used detector is a dual-channel detector with an integrated operational amplifier circuit, a temperature compensation circuit and a filter circuit. The window for each channel has an optical filter. The filter for the absorption channel was centered at 4.66 μm with a half-power bandwidth (HPBW) of 180 nm. The filter for the reference channel was centered at 3.95 μm with a HPBW of 90 nm.35 Considering the presence of H2O and CO2 in the air, Fig. 3 shows the simulated absorbance of 500 ppmv CO2, 100 ppmv CO and 2% H2O near 3.95 μm and 4.66 μm at a 300 K temperature, 1 atm pressure and 180 cm optical path based on the high-resolution transmission (HITRAN 2020) molecular absorption database.36Fig. 3(a) shows that the absorbance of 100 ppmv CO is about five orders of magnitude larger than those of 500 ppmv CO2 and 100 ppmv HCN within the spectral range of the absorption channel, so the interference of CO2 and HCN can be negligible. The absorbance of 2% H2O and 100 ppmv CO is on the same order of magnitude, so moisture should be removed before gas detection. In addition, 100 ppmv NO2 and 100 ppmv NO had almost no absorption in the absorption channel. The absorbance of 500 ppmv CO2, 2% H2O, 100 ppmv CO, 100 ppmv HCN, 100 ppmv NO2 and 100 ppmv NO within the spectral range of the reference channel was much smaller than the absorbance of 100 ppmv CO within the spectral range of the absorption channel. Therefore, the signal generated by the reference channel only represents the background noise.
 | (8) |
 | (9) |
After the incident light S0 is reflected, the propagation direction of the reflected light S1 is changed to be below the optical axis, so θ1 is a negative value, i.e.
| θ1 = −(α + β) = −(θ0 + 2α) | (10) |
The position of the reflection point P1 on M2 can be described by eqn (11), i.e.
 | (11) |
 | (12) |
After six reflections, the position of the reflection point can be described by eqn (13), i.e.
 | (13) |
It can be seen from eqn (13) that the position of the reflection point is the same as that of the incident point P0.
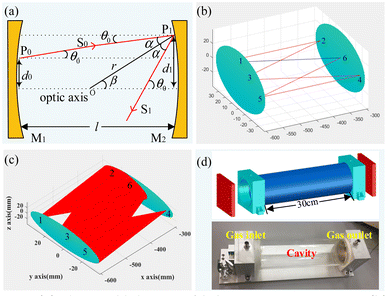
In order to verify the above-mentioned optical ray matrices, a MATLAB program was designed for light propagation simulation. Fig. 4(b) shows the optical propagation path of the incident light without the divergence angle. Fig. 4(c) shows the optical propagation path of the incident light with a 15° divergence angle. In addition, it can be found that the light can return to the original incident position after 6 reflections. Fig. 4(d) shows the three-dimensional model and photograph of the prepared MPGC. The bottom and two sides of the MPGC are made of aluminum alloys, and the 30 cm-long cavity is made of acrylic. The radius of the 30 cm-long cavity was 4 cm, resulting in a volume of ∼1.5 L. Two gold-plated concave mirrors were embedded on both sides of the MPGC, one of which has a light entrance hole with a diameter of 1 cm. To ensure the airtightness of the MPGC, a flat window was used to seal the light entrance hole, and then the flat window was squeezed through an external sealing cover. Considering the miniaturization and compactness of the optical structure, the light source and detector were placed on the same side of the MPGC, and the light beam entered and exited the MPGC from the same light entrance hole. A gas inlet and a gas outlet are located on both sides of the MPGC, respectively.
2.4. Gas pretreatment module
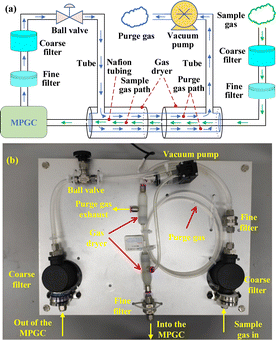
Gas pretreatment can lessen the effect of dust and moisture on the sensor system and improve detection accuracy. The structural diagram of the gas pretreatment module is shown in Fig. 5(a), which mainly includes two coarse filters (CTM, model CFD-10-02, Japan), two fine filters (Swagelok, model SS-4FW-2, USA), a gas dryer (Perma Pure, model MD-110-48F-R, USA), a ball valve and a vacuum pump (KNF, model NMP830HP, Germany). A two-stage filtration composed of a coarse filter and a fine filter can effectively filter out impurities in the sample gas. Most of the large particulates with a diameter of >10 μm can be filtered out using the coarse filter, and the tiny particulates with a diameter of >2 μm can be filtered out using the fine filter. The combination of the ball valve and vacuum pump controls the gas flow rate together. Fig. 5(b) shows a photograph of the assembled gas pretreatment module.The gas dryer is a moisture exchanger composed of the Nafion polymer. The Nafion polymer can transfer water molecules from one side of the membrane to the other according to the difference in the humidity level on both sides of the membrane. With the assistance of the Nafion polymer, the gas dryer selectively removes water from the pumped gas sample. This selectivity for water allows the gas dryer to remove more moisture than other gas drying solutions while keeping most analytes in the gas sample unaffected. The sample gas and the purge gas flow inside and outside of the Nafion tubing, respectively, in opposite directions. The dry purge gas can be either external purge gas or reflux sample gas. The external purge gas sources mainly include nitrogen, instrument air and compressed air. However, this method might not be cost-effective for continuous or high-flow-rate applications. In this sensor, the dust and moisture are filtered out by the two-stage filtration and gas dryer in turn. Then, the sample gas ejected from the MPGC flows back into the purge gas flow path. Compared with the method using external purge gas, this method is simpler and cost-effective.
2.5. CO sensing performance evaluation
 | (14) |
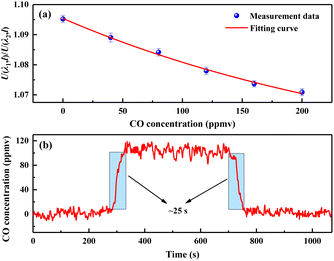
The response time of the sensor is affected by several factors, such as the volume of the gas cell and the gas flow rate.37 0 ppmv and 100 ppmv CO gas samples were injected alternately into the MPGC at a gas flow rate of 1 L min−1. The 10–90% response time was found to be ∼25 s for both rise and fall conditions, as shown in Fig. 6(b).
3. Enhancement of sensor stability
3.1. Stability enhancement under vibration
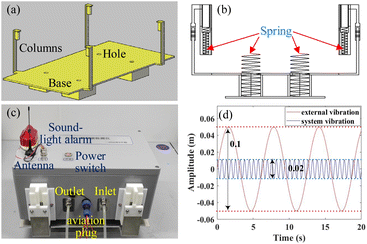
As shown in Fig. 8(a), the structure of the damping module is mainly composed of a base and four columns. The base is made from 304 stainless steel and supports the overall weight of the sensor system. The base is flanked by four columns, which are fixed on the instrument housing. There are four round holes dug in the base for placing springs. As shown in Fig. 8(b), when the instrument is subjected to external downward vibration, the springs at the bottom produce a reaction force to reduce the downward vibration. In addition, four springs were placed between the four columns and the recess to prevent the instrument from vibrating upward. Fig. 8(c) shows the outside view of the sensor system with the damping module. The shell of the whole sensor system adopts the IP67 degree of protection. The external 12 V power was supplied to the internal power module through an aviation plug.The sensor system with the damping module can be simplified to a single-degree-of-freedom dynamic model. The dynamic equation of the model satisfies eqn (15):
| mx′′(t) + cx′(t) + kx(t) = f(t) | (15) |
| x′′(t) + 2wξx′(t) + w2x(t) = F(t) | (16) |
 | (17) |
 . The spring stiffness k is defined as the ratio of the load increment df to the deformation increment dλ, i.e.
 | (18) |
The weight of the system m = 7 kg and the spring stiffness k = 700 kg m−1. According to eqn (18), the initial displacement a = 0.01 m. Assume that the external excitation f(t) = 0.05![[thin space (1/6-em)]](https://www.rsc.org/images/entities/char_2009.gif) sin(t). Without considering the spring damping, the performance of the damping module was simulated based on MATLAB. The simulation results show that the vibration intensity can be reduced by ∼80% after using the damping module, which theoretically illustrates the practicality of the damping design, as shown in Fig. 8(d).
sin(t). Without considering the spring damping, the performance of the damping module was simulated based on MATLAB. The simulation results show that the vibration intensity can be reduced by ∼80% after using the damping module, which theoretically illustrates the practicality of the damping design, as shown in Fig. 8(d).
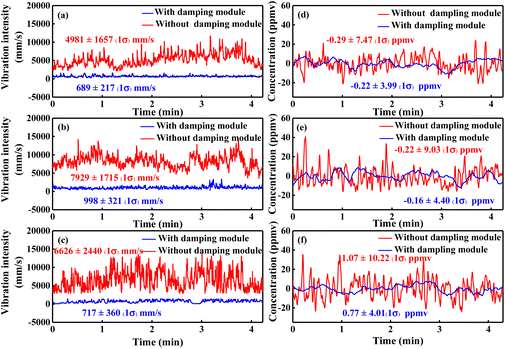
The developed sensor system equipped with a vibration sensor was used to carry out outdoor experiments to test the performance of the damping module. Fig. 9 shows the measured vibration intensity and the CO concentration in the atmosphere on an asphalt road, a grass road and a stone road under three different conditions. As shown in Fig. 9(a–c), there is a big difference in the vibration intensity in three road conditions. The average vibration intensities with the damping module under the three road conditions are reduced by 86%, 87% and 89%, respectively, compared with those of the sensor system without the damping module. Table 1 shows the detailed analysis results. The standard deviations of vibration intensity with the damping module are much lower than those without the damping module under the three road conditions. Therefore, the damping module can effectively absorb external vibration.
| Road conditions | Damping module | The average value of vibration intensity (mm s−1) | Percentage reduction (%) | The fluctuation value of CO concentration (ppmv) | Percentage reduction (%) |
|---|---|---|---|---|---|
| Asphalt road | Without | 4981 | 86 | 44.83 | 59 |
| With | 689 | 18.41 | |||
| Grass road | Without | 7929 | 87 | 56.95 | 64 |
| With | 998 | 20.50 | |||
| Stone road | Without | 6626 | 89 | 60.51 | 73 |
| With | 717 | 16.59 |
In addition, to verify the beneficial impact of adding the damping module to the sensor system, the CO concentration in the atmosphere under the three road conditions mentioned above was measured using the developed sensor system. As shown in Table 1, the fluctuation of the CO concentration measured using the sensor system with the damping module on an asphalt road, a grass road and a stone road was reduced by 59%, 64% and 73%, respectively, compared with those without the damping module. Therefore, the damping module can effectively enhance both the stability and accuracy of the sensor system.
3.2. Stability enhancement under a large temperature change
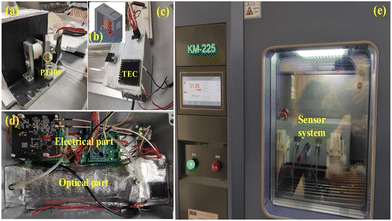
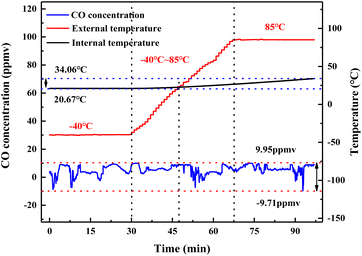
To cope with the large temperature difference between day and night, both the electrical and the optical parts should operate normally within a large temperature variation range. In the electrical part, the electronic components used are all automotive grade, which ensures the normal operation of the electrical part under extreme temperature conditions. In the optical part, the pyroelectric detector used in the sensor system is sensitive to temperature, thus a temperature control module was designed to control the temperature of the optical module. Fig. 10(a) shows a photograph of the optical module, in which a PT100 thermal resistor was adhered to the beam splitter for measuring the internal temperature change of the optical module. As shown in Fig. 10(b), the housing of the temperature control module was designed by 3D printing technology to cover the optical module. As shown in Fig. 10(c), two TECs embedded at the top and side of the housing were used for cooling, and an EHF with a maximum power of 48 W installed inside the housing was used for heating. By comparing the real-time temperature with the target temperature, the DSP adopted a proportional-integral-derivative (PID) algorithm to keep the temperature constant by controlling the EHF to heat or the TEC to cool so as to minimize the impact of temperature change on the detector. Fig. 10(d) shows an internal photograph of the sensor system. The optical part and electrical part are arranged separately to achieve a small size and compact structure. The developed sensor system was put into a constant temperature and humidity test chamber (CTHTC, Komeg, model KM-225, China) to observe the performance of the temperature control module, as shown in Fig. 10(e).As shown in Fig. 11, a 0 ppmv CO sample (pure N2) was injected into the MPGC, and the internal target temperature of the optical module was set to 21 °C. At the same time, the temperature of the CTHTC was adjusted from −40 °C to 85 °C and was maintained at −40 °C and 85 °C for 30 minutes, respectively. It took ∼35 minutes to rise from −40 °C to 85 °C. The external temperature of the optical module was always lower than the internal temperature in the first 46 minutes, which is mainly due to the continuous heating of the EHF. As the external temperature continued to rise and exceeded the internal target temperature, the TECs began to cool the internal environment of the optical module. The internal temperature kept rising slowly, finally reaching 34.06 °C. This was caused by the insufficient cooling efficiency of the TECs. The maximum cooling power of the TECs was 27 W. However, the measured CO concentration fluctuated between −9.71 ppmv and 9.95 ppmv during the whole process of external temperature change, benefiting from the temperature compensation of the pyroelectric detector within a certain temperature range. In future work, adding the water-cooling module to TECs can further increase cooling efficiency, leading to a further improvement in the stability of the sensor system.
4. Self-adaptive early fire identification algorithm
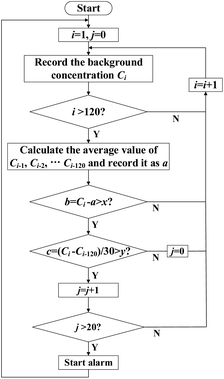
The CO content in the atmosphere is very small. When the CO concentration increases rapidly in a short time, it can be considered that there may be a hidden fire. According to the changing magnitude and changing rate of CO concentration, a self-adaptive early fire identification algorithm was proposed, which can automatically adapt to the change of gas concentration in the background environment. Fig. 12 shows the execution flow chart of the algorithm. First, at the initial state, let i = 1 and j = 0. Then, record the CO background concentration in the environment for 30 s with a sampling rate of 4 Hz, leading to 120 samples. Calculate the average value a of the latest 120 samples to update the background concentration, i.e., a = (Ci−1 + Ci−2 + ⋯ + Ci−120)/120. Then, judge whether the difference b between Ci and a is larger than x, where x is the threshold of the changing magnitude. If yes, proceed to the next step; if not, let i = i + 1. Let the changing rate c = (Ci − Ci−120)/30, where Ci and Ci−120 are concentration values at 120 samples apart. Then, judge whether c is larger than the threshold y of the changing rate. If yes, let j = j + 1; if not, let j = 0 and i = i + 1. In order to eliminate the instantaneous rise of Ci and c caused by external factors, such as vibration, judge whether j is greater than 20, that is, the changing magnitude and rate of CO concentration exceed the set threshold values x and y within 5 consecutive seconds. If yes, start the alarm; if not, let i = i + 1, and continue to read the next concentration value.In order to determine the threshold x and y, 1 g of cotton was used for testing under smoldering conditions. An electric heating table was placed in a transparent acrylic box to heat the cotton. A special temperature setting ensured that the cotton did not produce an open flame and remained smoldering. The generated CO was extracted from the top of the transparent acrylic box and was pumped into the MPGC at a flow rate of 1 L min−1. In addition, the gas pretreatment module was installed in front of the gas inlet of the MPGC to filter out dust and moisture. In the case of smoldering, the changing magnitude of CO concentration generated by 1 g of cotton over time is shown in Fig. 13(a). It can be found that the peak value is between 150 ppmv and 300 ppmv. Therefore, the threshold x of changing magnitude can be set to 100 ppmv. Fig. 13(b) shows the changing rate of CO concentration generated by 1 g of cotton over time. It can be found that the peak value exceeded 2 ppmv s−1, so the threshold value y of the changing rate can be set to 2 ppmv s−1. For broad applications of the sensor system, equal weights of plywood, wood and paper were used to carry out the smoldering experiment. The measurement results are similar to those of cotton smoldering, as shown in Fig. 13(a) and (b). Therefore, the same thresholds are also applicable to early fire identification for plywood, wood and paper. During detection, once the changing magnitude and the changing rate of CO concentration are higher than the set threshold x and y at the same time, the monitoring platform can distinguish them and then give an alarm.
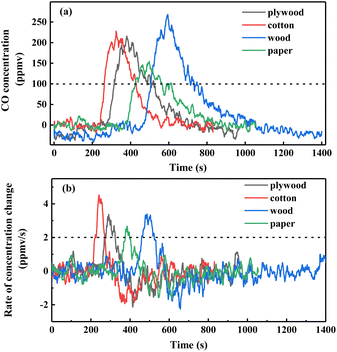 | ||
| Fig. 13 (a) The changing magnitude and (b) the changing rate of CO concentration generated by plywood, cotton, wood and paper with equal weights. | ||
5. On-site deployment
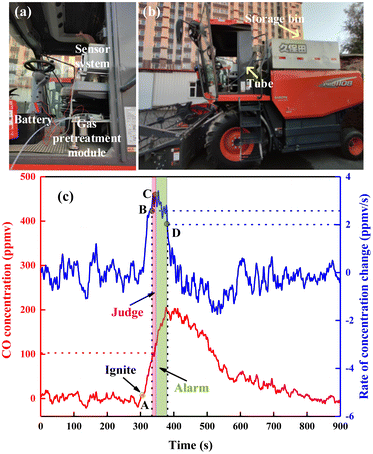
The developed sensor system was deployed on a harvester to verify the impact in practical application. The sensor system, the gas pretreatment module and the battery were placed on one side of the cab, as shown in Fig. 14(a). In order to save space, the sensor system and the gas pretreatment module were stacked. The battery supplied power to the sensor system and the vacuum pump embedded in the gas pretreatment module. As shown in Fig. 14(b), one end of the tube was connected to the air inlet of the MPGC and the other end was put into the storage bin to extract the gas inside. The smoldering cotton was placed in the storage bin and the generated CO was pumped into the gas pretreatment module using the pump through the tube. The target gas entered the sensor system after being filtered and dried using the gas pretreatment module.The self-adaptive early fire identification algorithm was used to monitor the early fire in real time. Fig. 14(c) shows the magnitude and changing rate of CO concentration during the movement of the harvester, in which the pink area and the green area represent the judgment time and the alarm time, respectively. The background CO concentration in the air was recorded for a period of 30 s and the average value was determined to be 1 ppmv. At point A (t = 312 s), the cotton in the storage bin was ignited for smoldering. At point B (t = 342 s), the changing magnitude and changing rate of CO concentration were 100 ppmv and 2.98 ppmv s−1, respectively, which exceeded the thresholds. At this time, the sensor system was continuously working and both the changing magnitude and changing rate of CO concentration exceeded the thresholds in the following 5 seconds. At point C (t = 347 s), the self-adaptive early fire identification algorithm identified the occurrence of an early fire and triggered sound and light alarms. At point D (t = 380 s), the changing magnitude and rate of CO concentration were 195 ppmv and 1.99 ppmv s−1, respectively. Since the changing rate was lower than the set threshold of 2 ppmv s−1, the alarm was terminated. The alarm time lasted for 33 s, which verified the practicability of the self-adaptive early fire identification algorithm. It should be noted that the CO produced by the harvester is different from that produced by crop combustion in terms of the changing magnitude and changing rate, which can be distinguished by the self-adaptive early fire identification algorithm. So, the harvester caused no effect on early fire identification throughout the experiment.
6. Conclusions
Focusing on the early fire hazard in cotton harvesting operations, a mid-infrared sensor system was developed for early fire identification. A gas pretreatment module was developed to decrease the impact of dust and moisture. A damping module was attached to the sensor system and outdoor experiments were implemented to verify its performance. The fluctuation of the measured CO concentration on an asphalt road, a grass road and a stone road was reduced by 59%, 64% and 73%, respectively, using the damping module. To cope with the influence of a large temperature difference between day and night on the performance of the sensor, a temperature control module was designed to control the temperature of the optical module. Pure N2 was injected into the MPGC placed in the CTHTC. The measured CO concentration fluctuated between −9.71 ppmv and 9.95 ppmv during a change in the external temperature from −40 °C to 85 °C. However, the internal temperature of the optical module increased from 21 °C to 34.06 °C, which was caused by the insufficient cooling efficiency of the TECs. In future work, adding a water-cooling module to TECs can further increase the cooling efficiency. In view of the false alarm and missing alarm of the single-parameter warning mechanism, an adaptive early fire identification algorithm based on the combination of the changing magnitude and changing rate of the CO concentration was proposed. Through the smoldering experiment of cotton, the threshold of the changing magnitude and the threshold of the changing rate were determined as 100 ppmv and 2 ppmv s−1, respectively. Related smoldering experiments confirmed that the thresholds are also applicable to the early fire identification of plywood, wood and paper. The field deployment and experiment on the harvester verified the good application value of the developed sensor system in early fire identification.Author contributions
Yafei Li: conceptualization, methodology, data curation, and writing – original draft. Yang Lu: investigation and validation. Chuantao Zheng: conceptualization, investigation, writing – review and editing, and funding acquisition. Shuo Yang: conceptualization and validation. Kaiyuan Zheng: investigation and validation. Fang Song: investigation and data curation. Chunguang Li: writing – review and editing. Weilin Ye: conceptualization and methodology. Yu Zhang: writing – review and editing. Yiding Wang: resources and funding acquisition. Frank K. Tittel: writing – review and editing and supervision.Conflicts of interest
There are no conflicts to declare.Acknowledgements
This work was supported in part by the National Key R&D Program of China (no. 2021YFB3201903), the National Natural Science Foundation of China (nos 61960206004 and 62175087), the Science and Technology Development Program of Jilin Province, China (no. 20200401059GX), the Science and Technology Research Project of Department of Education, Jilin Province, China (no. JJKH20211088KJ), the Key R&D Program of Changchun (no. 21ZGN24), and the Program for JLU Science and Technology Innovative Research Team (JLUSTIRT, 2021TD-39).References
- W. H. Zhou, S. D. Xv, C. J. Liu and J. F. Zhang, Appl. Spectrosc. Rev., 2016, 51, 298–312 Search PubMed.
- K. G. Fue, W. M. Porter, E. M. Barnes and G. C. Rains, AgriEngineering, 2020, 2, 150–174 CrossRef.
- Y. L. Chen, H. Z. Yang and W. Z. Liu, The First International Conference on Information Technology and Quantitative Management, ITQM, Suzhou, China, 2013.
- J. S. Tian, X. Y. Zhang, Y. L. Yang, C. X. Yang, S. Z. Xu, W. Q. Zuo, W. F. Zhang, H. Y. Dong, X. L. Jiu, Y. C. Yu and Z. Zhao, Ind. Crops Prod., 2017, 109, 803–811 CrossRef.
- Y. J. Shen, S. Li, Y. N. Chen, Y. Q. Qi and S. W. Zhang, Agric. Water Manage., 2013, 128, 55–64 CrossRef.
- N. Li, H. X. Lin, T. X. Wang, Y. Li, Y. Liu, X. G. Chen and X. T. Hu, Field Crops Res., 2020, 247, 107590 CrossRef.
- T. Hu, Y. N. Hu, J. Q. Dong, S. J. Qiu and J. Peng, Remote Sens., 2021, 13, 4819 CrossRef.
- E. Mygdakos and T. A. Gemtos, Bioprocess Eng., 2002, 82, 381–391 Search PubMed.
- M. V. Braunack and D. B. Johnston, Soil Tillage Res., 2014, 140, 29–39 CrossRef.
- Y. Q. Gu, H. W. Zhang, X. Q. Fu, L. Wang, Z. Y. Shen, J. Wang, Z. Y. Song and L. C. Zhang, Materials, 2021, 14, 2487 CrossRef CAS PubMed.
- Y. Q. Zhang, Y. Tian and Y. G. Meng, Trans. ASME, J. Tribol., 2021, 143, 021703 CrossRef.
- G. S. Qi, W. Lu, X. Y. Qi, X. X. Zhong, W. M. Cheng and F. M. Liu, Fire Saf. J., 2018, 102, 77–82 CrossRef.
- J. H. Du, R. C. Mang, X. Y. Huang, X. Gong and X. H. Zhang, Spectrosc. Spectrum Anal., 2007, 27, 899–903 Search PubMed.
- A. Solorzano, J. Eichmann, L. Fernandez, B. Ziems, J. M. Jimenez-Soto, S. Marco and J. Fonollosa, Sens. Actuators, B, 2021, 352, 130961 CrossRef.
- D. Gutmacher, U. Hoefer and J. Woellenstein, Sens. Actuators, B, 2013, 175, 40–45 CrossRef.
- Q. X. He, C. T. Zheng, H. F. Liu, Y. D. Wang and F. K. Tittel, Quantum Sensing and Nano Electronics and Photonics XIV, San Francisco, USA, 2017 Search PubMed.
- W. L. Ye, C. T. Zheng, X. Y. Cheng, F. P. Wu, M. M. Chen and Y. D. Wang, Infrared Phys. Technol., 2015, 71, 339–346 CrossRef CAS.
- Y. Chi, Z. X. Liu and Y. M. Zhang, J. Intell. Robot. Syst., 2019, 93, 337–349 CrossRef.
- J. M. Dang, H. Y. Yu, C. T. Zheng, Y. D. Wang and Y. J. Sun, Anal. Methods, 2018, 10, 3325–3331 RSC.
- J. W. Wang and H. L. Wang, Infrared Phys. Technol., 2014, 65, 1–4 CrossRef CAS.
- N. Pakmanesh, S. M. Cristescu, A. Ghorbanzadeh, F. J. M. Harren and J. Mandon, Appl. Phys. B: Lasers Opt., 2016, 122, 10 CrossRef.
- S. Viciani, A. Montori, A. Chiarugi and F. D'Amato, Sensors, 2018, 18, 2380 CrossRef.
- J. S. Li, H. Deng, J. Sun, B. L. Yu and H. Fischer, Sens. Actuators, B, 2016, 231, 723–732 CrossRef.
- N. W. Liu, L. G. Xu, S. Zhou, L. Zhang and J. S. Li, ACS Sens., 2020, 5, 3607–3616 CrossRef PubMed.
- J. S. Li, U. Parchatka and H. Fischer, Sens. Actuators, B, 2013, 182, 659–667 CrossRef.
- R. M. Spearrin, C. S. Goldenstein, I. A. Schultz, J. B. Jeffries and R. K. Hanson, Appl. Phys. B: Lasers Opt., 2014, 117, 689–698 CrossRef.
- C. Liu and L. J. Xu, Appl. Spectrosc. Rev., 2019, 54, 1–44 CrossRef CAS.
- N. W. Liu, L. G. Xu, S. Zhou, L. Zhang and J. S. Li, Analyst, 2021, 146, 3841 RSC.
- H. Hussain, J. H. Kim and S. H. Yi, Sensors, 2018, 18, 2911 CrossRef PubMed.
- M. M. Akram, A. Nikfarjam, H. Hajghassem, M. Ramezannezhad and M. Iraj, Sens. Rev., 2020, 40, 637–646 CrossRef.
- T. A. Vincent and J. W. Gardner, Sens. Actuators, B, 2016, 236, 954–964 CrossRef CAS.
- S. J. Chen, D. C. Hovde, K. A. Peterson and A. W. Marshall, Fire Saf. J., 2007, 42, 507–515 CrossRef CAS.
- Z. J. Xie and Q. L. Tan, Int. J. Infrared Millimeter Waves, 2006, 27, 1639–1649 CAS.
- J. N. Wang, L. J. Zheng, X. T. Niu, C. T. Zheng, Y. D. Wang and F. K. Tittel, Appl. Opt., 2016, 55, 7029–7036 CrossRef CAS PubMed.
- M. Dong, C. T. Zheng, S. Z. Miao, F. Song and Y. D. Wang, Infrared Phys. Technol., 2017, 85, 450–456 CrossRef CAS.
- Z. W. Liu, C. T. Zheng, C. Chen, H. T. Xie, Q. Ren, W. L. Ye, Y. D. Wang and F. K. Tittel, Anal. Methods, 2018, 10, 4838–4844 RSC.
- F. Song, C. T. Zheng, D. Yu, Y. W. Zhou, W. H. Yan, W. L. Ye, Y. Zhang, Y. D. Wang and F. K. Tittel, Appl. Phys. B: Lasers Opt., 2018, 124, 51 CrossRef.
| This journal is © The Royal Society of Chemistry 2023 |

