Determination of cobalt in chamomile tea samples at trace levels by flame atomic absorption spectrophotometry after poly(vinyl alcohol)-magnetic hydrogel based dispersive solid phase extraction
Nazime Ebrar
Karlıdağ
 a,
Rabia
Demirel
 a,
Hakan
Serbest
 b,
Fatma
Turak
 *a and
Sezgin
Bakırdere
 *ac
*ac
aYıldız Technical University, Department of Chemistry, İstanbul, 34210, Turkey. E-mail: fturak@yildiz.edu.tr; bsezgin@yildiz.edu.tr; Fax: +90-2123834134
bIstanbul Health & Technology University, Faculty of Engineering and Natural Sciences, Department of Chemical Engineering, İstanbul 34173, Turkey
cTurkish Academy of Sciences (TÜBA), Vedat Dalokay Street No: 112 Çankaya, Ankara, 06670, Turkey
First published on 8th December 2022
Abstract
In this study, an analytical strategy was proposed for the determination of cobalt at trace levels by using a flame atomic absorption spectrophotometry (FAAS) system after magnetic hydrogel based dispersive solid phase extraction (MH-DSPE). Poly(vinyl alcohol) based magnetic hydrogels (PVA-MH) were synthesized easily, quickly, and cost effectively in the laboratory and used as an adsorbent material in the microextraction process. Under the optimum experimental conditions, the limit of detection (LOD) and limit of quantitation (LOQ) values were recorded as 4.2 and 14.1 μg L−1, respectively. To investigate the matrix effects on the analyte signal, spike experiments were performed using chamomile tea extracts and good recovery results were obtained between 85.7 and 113.8%. A 57.8-fold improvement was achieved in the detection power compared to that of a conventional FAAS system. The results obtained throughout all experimental studies demonstrated the applicability in addition to the accuracy of the method for the quantification of trace levels of cobalt with high accuracy in a chamomile tea matrix.
1 Introduction
Heavy metals can adversely affect living organisms and the environment. Although some of these metals are important for maintaining various physiological and biochemical functions in living organisms, they can cause different problems above certain limit concentrations.1 Cobalt, one of these metals, is an essential element that has various functions in the human body such as in the blood formation process, stimulation of hemoglobin synthesis, and functioning of various enzymes, vitamins and hormones.2 This metal has a positive effect on vitamins such as vitamin B12 and 1.0 mg is sufficient for a normal body. In addition, a Co-60 gamma-ray source with radioactive properties has been used as a tracer and radio therapeutic agent.3 Cobalt enters the human body through solid and liquid foods. Determination of this metal at low levels is critical because cobalt is carcinogenic at high doses.4,5In the literature, there are several studies reported for the determination of cobalt in different matrices such as inductively coupled plasma optical emission spectrometry (ICP-OES),6 inductively coupled plasma mass spectrometry (ICP-MS),7 graphite furnace atomic absorption spectrometry (GFAAS),8 ultraviolet-visible spectrophotometry (UV-vis),9 digital image colorimetry,10 stripping voltammetry,11 and flame atomic absorption spectrometry (FAAS).12 Among the aforementioned methods, FAAS is preferred by many research laboratories in heavy metal determination because of its outstanding features such as short analysis times, easy and inexpensive operation, and not requiring complicated mechanisms.13 However, the FAAS system has critical limitations in the determination of analytes at trace levels, such as that approximately ten percent of the sample solution can be transported by the nebulizer to the atomizer and interference effects from the matrix.14 Therefore, it is necessary to apply a suitable preconcentration method to minimize the effects of these disadvantages and increase device sensitivity.
Several methods such as cloud point extraction (CPE),15 dispersive liquid liquid microextraction (DLLME),16 solidified floating organic drop microextraction (SFODME),17 supramolecular solvent-based microextraction procedure (Ss-ME),18 single drop microextraction (SDME),19 and solid phase extraction (SPE)20 have been reported for the preconcentration/separation of cobalt from different matrices in the literature. In dispersive solid phase extraction (DSPE), which is a different application of the SPE method, the extraction process takes place by dispersing a small amount of adsorbent in the aqueous solution. The analyte(s) adsorbed on the adsorbent surface are released using a proper solvent. Here, the high interaction between the adsorbent and the analytes increases the extraction efficiency.21 Among the nanomaterials developed for the application of this method, different studies are carried out with graphene, carbon nanotubes, zinc oxide, metal organic frameworks and magnetic nanoparticles.22 Magnetic polymer composites (MPCs) are interesting hybrid materials containing nanoparticles embedded in a polymer matrix. In this application, a stable MPC suspension is formed by diffusion of magnetic particles in the polymer gel. As an innovative composite, these materials have the properties of both a polymer gel and a magnetic fluid, making them an attractive class in current extraction processes.23 Recently, hydrogels have been an attractive sorbent in removing environmental pollutants with advantages such as chemical stability, low toxicity, cost effectiveness and high adsorption capacity.24 Structurally, hydrogels are three-dimensional and capable of diffusing large amounts of water into their internal networks.25 Since polyvinyl alcohol (PVA) has a hydroxyl group in its structure, many functional groups are biocompatible with PVA. This property has led researchers to conduct various studies on synthesizing PVA/Fe3O4 nanocomposites.26,27
In present study, it was aimed to develop an accurate, sensitive, and environmentally friendly method for the determination of ionic cobalt in chamomile tea samples. After all parameters were optimized with the help of a univariate optimization approach for efficient extraction, the applicability of the developed PVA-MH-DSPE-FAAS method was investigated by performing spiking experiments on chamomile tea extract samples.
2 Materials and methods
2.1 Chemicals and reagents
Analytical grade chemicals and reagents were used throughout all experimental studies. The stock cobalt standard solution (1000 mg L−1) in 0.50 M nitric acid, used to prepare cobalt standard solutions, was supplied from Merck, Germany. A Milli-Q® Reference Ultrapure Water Purification System was used to obtain ultrapure water to use for all sample and cobalt standard solution preparations. Buffer solutions with pH values between 2.0 and 10 were prepared using potassium dihydrogen phosphate, sodium hydrogen phthalate, sodium bicarbonate, and sodium tetraborate decahydrate salts. Ethanol, sodium hydrogen phthalate, ammonium iron(II) sulfate hexahydrate ((NH4)2·Fe(SO4)2·6H2O) and sodium hydroxide were purchased from Merck, Germany. The nitric acid solution (65%), hydrochloric acid solution (37%), iron(III) chloride hexahydrate (FeCl3·6H2O) and tri-sodium citrate dihydrate (C6H5Na3O7·2H2O) were purchased from Isolab, Germany. Poly(vinyl alcohol) was obtained from Sigma-Aldrich, Germany. The buffer solutions in the range of pH 2.0–5.0 were prepared by adding 0.10 M HCl/0.10 M NaOH to 0.10 M sodium hydrogen phthalate, that with pH 6.0 was prepared with 0.10 M potassium dihydrogen phosphate and 0.10 M NaOH. A buffer solution with pH 7.0 was prepared with 0.10 M tris and 0.10 M HCl while 0.10 M HCl/0.10 M NaOH and 0.025 M sodium tetraborate decahydrate were used to prepare the buffers in the range of pH 8.0–10.2.2 Instrumentation
A flame atomic absorption spectrophotometer (ATI UNICAM 929 AA model) was employed for the determination of cobalt. A deuterium lamp (D2) was used for background correction in the measurements. A cobalt hollow cathode lamp operating at the wavelength of 240.8 nm and 15 mA of lamp current was used as the line source. An ultrasonic bath (RunYAS medical ultrasonic cleaner, Clean-01), an orbital shaker (Biosan, PSU-10i) and a vortex (Velp, ZX3) were utilized to mix the solutions. An Ohausdw precision balance was employed to weigh salts and magnetic hydrogels. A Heraeus D-6450 Hanau oven was used to remove moisture from the salts and nanoparticles. The measurements of pH of the buffers and sample solutions were performed with an HI 2211 model Hanna Instruments pH/ORP meter. A centrifuge (BIOBASE BKC-TL5II) was used to accelerate phase separation. The magnetic hydrogels were separated from the sample solution with a neodymium magnet.2.3 Synthesis of the poly(vinyl alcohol) based magnetic hydrogel
Procedures from previous studies in the literature with different materials were adapted for the synthesis of PVA-MH.28,29 Briefly, 0.40 g of PVA was dissolved in 10 mL of a water/ethanol (2![[thin space (1/6-em)]](https://www.rsc.org/images/entities/char_2009.gif) :
:![[thin space (1/6-em)]](https://www.rsc.org/images/entities/char_2009.gif) 3) (v/v) mixture in a beaker and heated to 60 °C under constant stirring. Then, the PVA hydrogel was obtained by adding 3.0 mL of 4.0% (w/w) sodium tetraborate decahydrate solution prepared in deionized water. 4.97 mmol (NH4)2·Fe(SO4)2·6H2O and 10 mmol FeCl3·6H2O were dissolved using 12.5 mL of ultrapure water in another beaker and then added into the prepared PVA hydrogel. In order to form bead-shaped hydrogels, the magnetic PVA solution was transferred through a 1.0 mm diameter tube to the alkali solution prepared by dissolving 7.356 g of C6H5Na3O7·2H2O and 12.5 g of NaOH salts in 250 mL of deionized water. Bead-shaped hydrogels were kept in an alkaline solution for 24 hours and then washed 3–4 times with deionized water to separate impurities. The sorbent was dried in an oven at 50 °C for 12 hours. Finally, the dried hydrogels were turned into a powder with the help of a pestle and mixed to increase the surface area.
3) (v/v) mixture in a beaker and heated to 60 °C under constant stirring. Then, the PVA hydrogel was obtained by adding 3.0 mL of 4.0% (w/w) sodium tetraborate decahydrate solution prepared in deionized water. 4.97 mmol (NH4)2·Fe(SO4)2·6H2O and 10 mmol FeCl3·6H2O were dissolved using 12.5 mL of ultrapure water in another beaker and then added into the prepared PVA hydrogel. In order to form bead-shaped hydrogels, the magnetic PVA solution was transferred through a 1.0 mm diameter tube to the alkali solution prepared by dissolving 7.356 g of C6H5Na3O7·2H2O and 12.5 g of NaOH salts in 250 mL of deionized water. Bead-shaped hydrogels were kept in an alkaline solution for 24 hours and then washed 3–4 times with deionized water to separate impurities. The sorbent was dried in an oven at 50 °C for 12 hours. Finally, the dried hydrogels were turned into a powder with the help of a pestle and mixed to increase the surface area.
2.4 PVA based magnetic hydrogel characterization
PVA-MH was characterized by FTIR and SEM. A peak was exhibited at 3413 cm−1 resulting from the OH stretching of PVA-MH. The band at 1010 cm−1 was attributed to the C–O stretching of PVA. The bands at 1385 and 1591 cm−1 belong to C–H bending. In addition, a strong peak appears at 620 cm−1, attributed to the Fe–O–H stretching, so that the iron oxide nanoparticles are proven to be present in the hydrogel network (Fig. 1).30,31 In the SEM images shown in Fig. 2, agglomeration of PVA hydrogels on magnetite particles proved the PVA hydrogel coating on the Fe3O4 surface.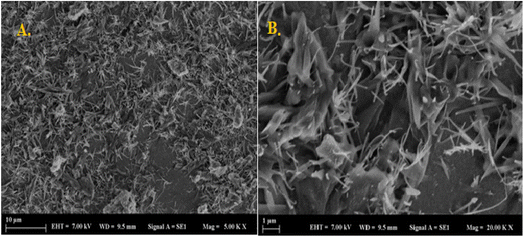 | ||
| Fig. 2 Scanning electron microscope images acquired for the PVA based magnetic hydrogel (A) scale of 10 μm and (B) scale of 1 μm. | ||
2.5 PVA-MH-DSPE procedure
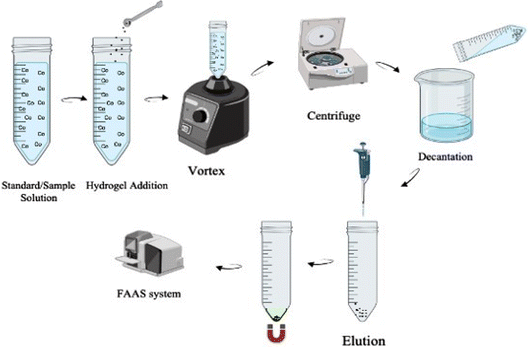
In the extraction process (Fig. 3), first 20 mg of synthesized PVA-MH and 0.75 mL of pH 9.0 buffer were added to 40 mL sample/standard solution. In order to maximize the interaction between the analyte and the adsorbent in the aqueous solution, a vortex was applied for 60 s. The solutions were centrifuged at 3000 rpm for 120 s to minimize the suspension of hydrogels. Then, the hydrogels collected at the bottom of the tube were separated from the aqueous phase using a neodymium magnet and left in an oven at 50 °C for effective drying. The desorption process was carried out by adding 150 μL of 1.0 M HNO3 to the hydrogels that were completely dehydrated. The eluted cobalt solution was sent to the FAAS system to measure absorbance.2.6 Sample preparation
Two dried chamomiles were supplied from a local market in İstanbul, Turkey. In the preparation of tea samples, 1.0 g of chamomile samples were weighed and then brewed in 200 mL of pre-boiled distilled water for 5 minutes as in usual consumption. The samples were filtered to separate the liquid phase and pulp from each other and allowed to cool under room conditions. Then, the filtrates including an chamomile extract were diluted 10 times with deionized water. The recovery experiments were performed by spiking different cobalt concentrations into these solutions.3 Results and discussion
The analytical conditions (volume of sample solution, type/volume of buffer solution, amount of hydrogel, mixing type/period and eluent concentration/volume) of the method were optimized by a univariate approach for the accurate and precise determination of cobalt with a FAAS system.3.1 Effect of the pH and volume of buffer
In the dispersive solid phase extraction procedure, pH of the sample solution is critical for efficient adsorption of an analyte(s) onto the sorbent material. Hence, buffer solutions in the pH range of 2.0–10 were added into cobalt standard solutions to investigate the pH effect on the extraction output. The results obtained showed a proportional increase in absorbance values with increasing buffer pH values. In the acidic region, free hydronium ions compete with the analyte ions to be adsorbed on the surface of the sorbent material. The increase in absorbance values can be explained by the fact that the analyte ions are better adsorbed on the surface of the sorbent as the acidity of the solution decreases.32 In the results obtained, it was observed that the highest absorbance value was recorded at pH 10. However, considering the possibility of cobalt precipitation in the basic region in the form of hydroxyl, it was necessary to investigate the effect of the sorbent material on the extraction outputs. For this reason, the extraction process was applied without adding sorbent to the solutions containing pH 9.0 and 10 buffers, where the two highest absorbance values were obtained with these buffer usages, and the extraction phases were sent to the FAAS system. The absorbance value recorded for extraction without a sorbent at pH 9.0 was found to be approximately 10% of the absorbance signal recorded for extraction using a sorbent. For pH 10, this value was about 40%. In other words, it was understood that 10% of the obtained extraction yield was due to the precipitation of cobalt in the form of hydroxides and therefore, pH 9.0 was selected as the optimum point.The optimum volume of the pH 9.0 buffer solution was then determined by testing different volumes between 0.50 and 2.0 mL. The results obtained for the different buffer volumes were not different from each other, but 0.75 mL was selected as the optimum volume because it produced more repeatable results for the replicate extractions.
3.2 Effect of the sample volume
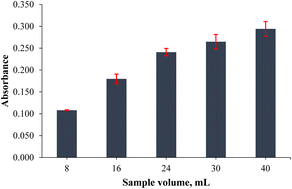
The sample volume plays an important role in obtaining high extraction efficiency. In this step, sample volumes such as 8.0, 16, 24, 32 and 40 mL were investigated to achieve the highest extraction yield. Increasing the initial/final volume ratio is important for a high yield extraction output, but the interaction between the analyte and adsorbent can be limited by the volume and shape of the sample container/tube used. Therefore, the highest sample volume was determined to be 40 mL for the extraction process in the usage of a 50 mL falcon tube, because efficient mixing could not be achieved when more than 40 mL samples were used. As shown in Fig. 4, the absorbance values were increased linearly from 8.0 to 40 mL and the highest absorbance value was observed at 40 mL of sample volume. Hence, 40 mL was selected as the optimum point.3.3 Effect of the sorbent amount
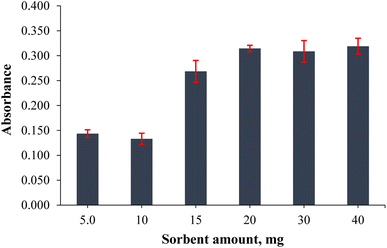
The amount of sorbent directly affects the extraction efficiency and recovery of the target analyte. Although the surface area will increase with the use of high amounts of sorbent, the solvent consumption required for elution will be equally high. Hence, the effect of the sorbent amount on cobalt extraction/preconcentration was investigated by adding 5.0, 10, 15, 20, 30 and 40 mg of PVA-MH to determine the optimum sorbent amount. The results given in Fig. 5 show that the highest absorbance value was obtained at 20 mg, and no significant difference was obtained in absorbance values using 30 and 40 mg. It was understood that the effect on the desorption of analytes did not change besides the increased surface area when more than 20 mg of sorbent was used. Low amounts of PVA-MH could not provide sufficient surface area to adsorb the analytes. Thus, 20 mg PVA-MH was determined as the optimum amount of sorbent.3.4 Effect of the mixing type and period
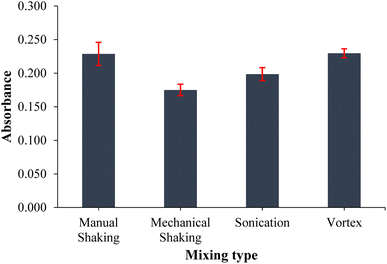
Mixing is an important parameter in extraction because it homogenizes the extractant with the sample solution and accelerates the entire extraction process. Therefore, the mixing type and period were optimized to enhance the efficiency of the extraction process. Four different mixing types (vortex, ultrasonication, mechanical shaking, and manual shaking) were applied to cobalt standard solutions under equivalent conditions and the results obtained were compared to the results of an extraction performed without mixing. The vortex mixing recorded the highest absorbance signal, and it was about 1.5 times higher than that of the extraction performed without mixing. In addition to the high extraction output, vortex mixing recorded the lowest standard deviation as shown by the error bars in Fig. 6. Different periods between 15 and 75 s were then tested to determine the optimum period of vortex mixing. The highest absorbance signal was recorded for a 60 s vortex period, and it also recorded low standard deviations obtained from the triplicate measurements.3.5 Effect of the concentration and volume of eluent
In the elution process, which is a critical step to achieve high enrichment factors, it is aimed to maximize the difference between the initial and final sample volumes. In addition, capability of the solvent used in the desorption process has an important role in the extraction efficiency. First, elution was carried out using different concentrations of HNO3 to obtain the highest elution efficiency. The optimum eluent concentration was determined to be 1.0 M due to the high absorbance and the low standard deviation values. Next, measurements for several volumes (75, 100, 150 and 200 μL) of 1.0 M of HNO3 were carried out to determine the elution capacity of HNO3 for cobalt ions. The highest absorbance value was recorded by adding 150 μL of 1.0 M HNO3. When the results obtained in 150 and 200 μL volumes are compared, it was thought that there was a decrease in the signal due to dilution in the 200 μL of eluent volume. On the other hand, volumes below 150 μL do not provide sufficient sample for FAAS measurements.3.6 Analytical figures of merit
The optimum parameters for the proposed method are summarized in Table 1, and under these optimal conditions, analytical performances of FAAS and PVA-MH-DSPE-FAAS were determined. The developed method presented a linear working range between 15 and 150 μg L−1 with a regression coefficient of 0.9965. The limit of detection (LOD) and limit of quantification (LOQ) were calculated with seven measurements of the lowest concentration and these values were found to be 4.2 and 14.1 μg L−1, respectively. All analytical characteristics (LOD, LOQ, % RSD, regression coefficient; R2, standard deviation and linear working range) of each system are specified in Table 2. Enhancement in detection power was calculated by comparing LOD values of each system. A 57.8-fold enhancement in detection power was obtained when LOD values of the PVA-MH-DSPE-FAAS system were compared to those of the conventional FAAS system.| Optimization parameters | Value |
|---|---|
| Sample flow rate | 4.5 mL min−1 |
| Acetylene flow rate | 18 L h−1 |
| Sample volume | 40 mL |
| pH/volume of buffer solution | pH 9.0/0.75 mL |
| Amount of PVA-MH | 20 mg |
| Mixing type/period | Vortex/60 s |
| Eluent concentration/volume | 1.0 M/150 μL of HNO3 |
| Method | LOD, μg L−1 | LOQ, μg L−1 | Regression coefficient, R2 | Linear working range μg L−1 | RSD, % | Enhancement in detection power |
|---|---|---|---|---|---|---|
| FAAS | 245 | 817 | 0.9976 | 750–20![[thin space (1/6-em)]](https://www.rsc.org/images/entities/char_2009.gif) 000 000 |
5.8 | — |
| PVA-MH-DSPE-FAAS | 4.2 | 14.1 | 0.9965 | 15–150 | 4.7 | 57.8 |
There are several solid phase extraction methods combined with flame atomic absorption spectrometry in the literature for cobalt at low detection limits. The specific variants and comparisons of literature strategies for cobalt are summarized in Table 3.
| Analytical method | Sorbent | Real sample | LOD, μg L−1 | Recovery, % | Ref. |
|---|---|---|---|---|---|
| a Pipette tip-zirconium nanoparticles-solid phase extraction-slotted quartz tube-flame atomic absorption spectrophotometry. b Ultrasound-assisted dispersive microsolid-phase extraction-flame atomic absorption spectrometry. c Oxidized multiwalled carbon nanotubes. d Dispersive micro-solid phase extraction based on rejection property-flame atomic absorption spectrometry. e Magnetic solid phase extraction flame atomic absorption spectrophotometry. f Flow injection solid phase microextraction-flame atomic absorption spectrometry. g Poly(vinyl alcohol) based magnetic hydrogel dispersive solid phase extraction flame atomic absorption spectrophotometry. | |||||
| PT-ZrNPs-SPE-SQT-FAASa | ZrNPs | Soil samples | 2.2 | 90.0–101 | 33 |
| UA-DMSPE-FAASb | Ox-MWCNTsc | Water, food and tobacco | 0.30 | 95.0–102 | 34 |
| DMSPE-RP-FAASd | 1-(2-Pyridylazo)-2-naphthol (PAN) | Tap, mineral, well and river waters | 1.2 | 97.6–101.4 | 35 |
| MSPE-FAASe | PTh-coated Fe3O4 | Tap water and food samples | 0.30 | 96.0–104.9 | 36 |
| FI-SPME-FAASf | Chromosorb 105 resin | Table salt and tap water | 2.5 | 95–100 | 37 |
| PVA-MH-DSPE-FAASg | PVA-MH | Chamomile tea | 4.2 | 85.7–113.8 | This study |
3.7 Recovery studies in real samples
In order to characterize the accuracy and applicability of the PVA-MH-DSPE-FAAS method, recovery experiments on chamomile tea extract samples were performed and evaluated. Since consumption of this tea is very high and chamomile samples contain different organic and inorganic substances originating from the environment in which they were grown, recovery studies were carried out in this matrix. After the analysis of the samples, cobalt standards at the concentrations of 50, 100 and 150 μg L−1 were spiked into two different chamomile tea samples and measurements were performed under the optimum conditions of the PVA-MH-DSPE-FAAS method. The recovery results with the external calibration method indicated the suppressive effect of the matrix on the analyte signal. Hence, the matrix matching calibration strategy was applied to minimize the effects from the matrix and to obtain high recovery results. The recovery results calculated for three different concentrations applied to both chamomile tea samples were found to be between 85.7 and 113.8%. The experimental results of the recovery studies are given in Table 4, and it is noted that cobalt may be determined accurately and precisely by using the matrix matching calibration strategy with the developed method.| Spiked concentration, μg L−1 | External calibration recovery ± standard deviation, % | Matrix matching recovery ± standard deviation, % | |
|---|---|---|---|
| Sample A | 50 | 36.8 ± 2.8 | 113.8 ± 8.5 |
| 100 | 45.4 ± 0.6 | 99.6 ± 1.3 | |
| 150 | 59.8 ± 4.7 | 113.1 ± 8.9 | |
| Sample B | 50 | 28.9 ± 2.0 | 87.6 ± 6.0 |
| 100 | 43.1 ± 3.0 | 85.7 ± 5.9 | |
| 150 | 50.6 ± 5.5 | 89.0 ± 9.6 |
4 Conclusion
In this work, a simple and quick analytical method named PVA-MH-DSPE-FAAS was developed for the extraction and preconcentration of cobalt in chamomile tea extract samples. PVA-based magnetic hydrogels were synthesized and used as the sorbent material for the DSPE method. A PVA-MH sorbent was synthesized by a simple precipitation process and characterized by FTIR and SEM methods. All parameters affecting the preconcentration of the analyte were univariately optimized to achieve a high signal-to-noise ratio. Under the optimum experimental conditions, a 57.8-fold improvement was obtained when the LOD (limit of detection) values of the PVA-MH-DSPE-FAAS system (4.2 μg L−1) and the FAAS system (245 μg L−1) were compared to each other. The quantification limit of the proposed method was found to be 14.1 μg L−1. In addition to testing the applicability and accuracy of the method, recovery studies were carried out using the matrix matching calibration strategy for the spiked chamomile tea samples. The excellent percent recovery results (85.7–113.8%) proved the applicability and accuracy of the developed PVA-MH-DSPE-FAAS method for a chamomile tea extract matrix.Conflicts of interest
The authors declare that they have no conflicts of interest.Acknowledgements
This research did not receive any specific grant from funding agencies in the public, commercial, or not-for-profit sectors.References
- M. Jaishankar, T. Tseten, N. Anbalagan, B. B. Mathew and K. N. Beeregowda, Interdiscip. Toxicol., 2014, 7, 60–72 CrossRef PubMed.
- T. Borahan, B. T. Zaman, G. Özzeybek and S. Bakırdere, Chem. Pap., 2021, 75, 2937–2944 CrossRef CAS.
- M. R. Pourjavid, M. Arabieh, S. R. Yousefi, M. R. Jamali, M. Rezaee, M. H. Hosseini and A. A. Sehat, Mater. Sci. Eng., C, 2015, 47, 114–122 CrossRef CAS PubMed.
- A. S. Amin, Arabian J. Chem., 2014, 7, 715–721 CrossRef CAS.
- R. Magaye, J. Zhao, L. Bowman and M. Dıng, Exp. Ther. Med., 2012, 4, 551–561 CrossRef CAS PubMed.
- M. Bartosiak, K. Jankowski and J. Giersz, J. Pharm. Biomed. Anal., 2018, 155, 135–140 CrossRef CAS PubMed.
- S. Capiau, E. Bolea-Fernandez, L. Balcaen, C. Van Der Straeten, A. G. Verstraete, F. Vanhaecke and C. P. Stove, Talanta, 2020, 208, 120055 CrossRef CAS PubMed.
- Q. Han, Y. Huo, L. Yang, T. Hao, X. Yang and Y. Zhai, Anal. Methods, 2015, 7, 8931–8935 RSC.
- M. Eskandarpour, P. Jamshidi, M. R. Moghaddam, J. B. Ghasmei and F. Shemirani, J. Sci. Food Agric., 2020, 100, 2272–2279 CrossRef CAS PubMed.
- V. A. Lemos, I. V. S. Junior, L. B. Santos, J. A. Barreto and S. L. C. Ferreira, Water, Air, Soil Pollut., 2020, 231, 334 CrossRef CAS.
- C. Kokkınos, A. Economou and M. Koupparıs, Talanta, 2009, 77, 1137–1142 CrossRef PubMed.
- H. Abdolmohammad-Zadeh and E. Ebrahimzadeh, Open Chem., 2010, 8, 617–625 CrossRef CAS.
- C. Demir, M. Öner, S. Bodur, E. Ö. Er and S. Bakırdere, ChemistrySelect, 2021, 6, 2906–2912 CrossRef CAS.
- G. Kaya and M. Yaman, Talanta, 2008, 75, 1127–1133 CrossRef CAS PubMed.
- N. Baghban, A. M. H. Shabani, S. Dadfarnia and A. A. Jafari, J. Braz. Chem. Soc., 2009, 20, 832–838 CrossRef CAS.
- N. Altunay, A. Elik and R. Gürkan, Microchem. J., 2019, 147, 277–285 CrossRef CAS.
- M. S. Bidabadi, S. Dadfarnia and A. M. H. Shabani, J. Hazard. Mater., 2009, 166, 291–296 CrossRef CAS PubMed.
- Z. A. Alothman, M. A. Habila, E. Yilmaz, N. M. Al-Harbi and M. Soylak, Int. J. Environ. Anal. Chem., 2015, 95, 1311–1320 CrossRef CAS.
- M. Amjadi, J. L. Manzoori and J. Abulhassani, J. AOAC Int., 2010, 93, 985–991 CrossRef CAS PubMed.
- N. Jalbani and M. Soylak, At. Spectrosc., 2014, 35, 163–167 CrossRef CAS.
- M. Öner, S. Bodur, C. Demir, E. Yazıcı, S. Erarpat and S. Bakırdere, J. Food Compos. Anal., 2021, 101, 103978 CrossRef.
- S. Büyüktiryaki, R. Keçili and C. M. Hussain, TrAC, Trends Anal. Chem., 2020, 127, 115893 CrossRef.
- N. Jahan, S. Pathak, K. Jain and R. P. Pant, Colloids Surf., A, 2018, 539, 273–279 CrossRef.
- E. Öztürk Er, E. Maltepe and S. Bakirdere, Microchem. J., 2018, 143, 393–399 CrossRef.
- E. M. Ahmed, J. Adv. Res., 2015, 6, 105–121 CrossRef CAS PubMed.
- A. Maleki, M. Niksefat, J. Rahimi and Z. Hajizadeh, BMC Chem., 2019, 13, 19 CrossRef PubMed.
- J. S. Gonzalez, C. E. Hoppe, P. Mendoza Zélis, L. Arciniegas, G. A. Pasquevich, F. H. Sánchez and V. A. Alvarez, Ind. Eng. Chem. Res., 2014, 53, 214–221 CrossRef CAS.
- E. Maltepe, E. Öztürk Er and S. Bakırdere, Microchem. J., 2020, 158, 105231 CrossRef CAS.
- Y. Huang, D. Wang, W. Liu, L. Zheng, Y. Wang, X. Liu, M. Fan and Z. Gong, Food Chem., 2020, 316, 126378 CrossRef CAS PubMed.
- M. Abasian, V. Hooshangi and P. N. Moghadam, Iran. Polym. J., 2017, 26, 313–322 CrossRef CAS.
- N. R. Nagireddy, M. M. Yallapu, V. Kokkarachedu, R. Sakey, V. Kanikireddy, J. Pattayil Alias and M. R. Konduru, J. Polym. Res., 2011, 18, 2285–2294 CrossRef CAS.
- G. M. Al-Senani and F. F. Al-Fawzan, Egypt. J. Aquat. Res., 2018, 44, 187–194 CrossRef.
- Z. Tekin, T. Borahan, N. Özdoğan and S. Bakırdere, Anal. Methods, 2020, 12, 1244–1249 RSC.
- A. A. Gouda, R. El Sheikh, A. M. Khedr, S. Abo Al Ezz, W. Gamil, M. M. El-Gabry and E. H. Youssef, Int. J. Environ. Anal. Chem., 2021, 1–15 CrossRef.
- F. Salimi, M. Shamsipur, E. Koosha and M. Ramezani, Int. J. Environ. Anal. Chem., 2022, 102, 872–884 CrossRef CAS.
- S. Shegefti, A. Mehdinia and F. Shemirani, Microchim. Acta, 2016, 183, 1963–1970 CrossRef CAS.
- A. Uzun Karatepe, M. Soylak and L. Elci, Anal. Lett., 2002, 35, 2363–2374 CrossRef.
| This journal is © The Royal Society of Chemistry 2023 |


