 Open Access Article
Creative Commons Attribution 3.0 Unported Licence
Controlling lamellarity and physicochemical properties of liposomes prepared using a microfluidic device
Yuka
Matsuura-Sawada†
ab,
Masatoshi
Maeki†
 *cde,
Shuya
Uno
 a,
Koichi
Wada
b and
Manabu
Tokeshi
 *c
*c
aGraduate School of Chemical Sciences and Engineering, Hokkaido University, Kita 13 Nishi 8, Kita-ku, Sapporo, 060-8628, Japan
bDepartment of Chemistry, Manufacturing and Control, Kobe Pharma Research Institute, Nippon Boehringer Ingelheim Co., Ltd., 6-7-5, Minatojima-minamimachi, Chuo-ku, Kobe, Hyogo 650-0047, Japan
cDivision of Applied Chemistry, Faculty of Engineering, Hokkaido University, Kita 13 Nishi 8, Kita-ku, Sapporo 060-8628, Japan. E-mail: m.maeki@eng.hokudai.ac.jp; tokeshi@eng.hokudai.ac.jp; Fax: +81-11-7066745; Tel: +81-11-7066773 Tel: +81-11-7066744
dJST PRESTO, 4-1-8 Honcho, Kawaguchi, Saitama 332-0012, Japan
eInstitute of Materials Structure Science, High Energy Accelerator Research Organization (KEK), Tsukuba, Ibaraki 305-0801, Japan
First published on 1st February 2023
Abstract
The function of liposomal drugs and cosmetics is not only controlled by the lipid composition/formulation, but also by the liposome size and internal structure/properties (uni- and multi-lamellae) and membrane rigid/fluidic properties. Although the preparation of liposomes using microfluidic devices offers precise size control and easy scale-up in a continuous manufacturing system, their lamellarity and physicochemical property differences have not been investigated. We therefore prepared different paclitaxel (PTX)-loaded liposomes by changing two process parameters and investigated their physicochemical properties. The liposome size and drug loading were modified by changing the initial lipid concentration and flow rate ratio (FRR) of the aqueous and ethanol phases introduced into the microfluidic channels. Small-angle X-ray scattering and transmission electron microscopy revealed that the liposomes comprised a uni- or multi-lamellar structure that could be controlled by changing the FRR and initial lipid concentration. We also found that these structural differences affected the drug release profiles. Furthermore, the dissolution kinetics of the latter half of the drug release test could be modulated by the membrane fluidity of the liposomes. These differences in the drug release rates were consistent with the results of the in vitro cell viability assay, confirming that the multilamellar liposomes showed milder activity than the PTX solution by allowing the extended release of PTX. Thus, we concluded that the preparation of liposomes using microfluidic devices allows the liposome size, DL%, and drug release profiles to be adjusted as required.
1. Introduction
Lipid-based nanoparticles (Lb-NPs) have been used in many clinical applications in the pharmaceutical and cosmetic fields for therapeutic purposes. Lb-NPs can successfully deliver both poorly water-soluble and water-soluble drugs and high molecular-weight modalities, such as oligonucleotides. Based on their internal structure, Lb-NPs can be subdivided into liposomes,1 lipid emulsions,2 lipid nanoparticles (LNPs),1,3 solid lipid nanoparticles1,4 and nanostructured lipid carriers.1 Lb-NPs have the great advantages of high biocompatibility and biodegradability.5 Based on these characteristics, LNPs have been utilized for the vaccines against COVID-191,6–8 and liposomes are widely used in pharmaceutical products such as Doxil,1,6,9 AmBisome,6,10 and cosmetic products.11The most basic Lb-NPs are liposomes, which are enclosed vesicles consisting of one or more lipid bilayers. The size of such liposomes can be adjusted from nano- to micro-order, depending on the target organ/cells for delivery and the site of application. The physicochemical properties of liposomes, such as the encapsulation efficiency (EE%),12–16 drug release profile,12–16 morphology,17 stiffness,17 and photoprotection of drugs,18 significantly impact drug delivery to target organs and cellular uptake.14,19 These physicochemical properties change depending on the liposome composition, size, and lamellar structure of lipid bilayer.
Comparisons of the physicochemical properties and effects on drug activity between uni- and multi-lamellar liposomes have been reported.15–21 Generally, liposomes are classified according to their preparation method. For example, liposomes prepared using a lipid thin-film hydration method tend to form multi-lamellar vesicles. Then, uni-lamellar vesicles can obtain by extrusion or sonication with the multilamellar vesicles. Liposomes are also classified according to particle size. Specifically, micro-ordered liposomes form multilayer lamellar vesicles, while nano-ordered liposomes form single-layer lamellar vesicles. However, Scott et al. observed that even if liposomes of uniform particle size are obtained by extrusion through a 100 μm membrane filter, they still contain some multilamellar vesicles.22 Thus, if the lamellar properties of liposomes are inferred from indirect physicochemical properties, the evaluations and results might include large uncertainties regarding the lamellar properties of these liposomes. In addition, micro-ordered liposomes have often been evaluated as representatives of multi-lamellar liposomes in terms of liposome size.15,16,19,20 It is more desirable to evaluate multi- and uni-lamellar liposomes in a realistic size range that can be applied to drug delivery for intravascular administration by injection, such as intravenous (IV) injection or infusion; however, such reports remain scarce.
Microfluidic technology is widely used to prepare nanoparticles composed of lipids and polymers.23 Microfluidic technology offers precise particle size control, ease of operation, and continuous production, allowing seamless scale-up from laboratory (lab) to production scale.24 Therefore, this preparation technique is one of the most promising nanoparticle preparation methods currently being investigated.25 According to the literature, liposomes prepared using microfluidic devices have been characterized by microscopy and X-ray diffraction and were observed to form both uni- and multi-lamellar structures.26,27 However, the effect of the microfluidic preparation conditions on the detailed lamellar structure of liposome is still not fully understood.
We previously reported that microfluidic technology can be used to prepare uniform liposomes of different sizes and particle concentrations by simply changing the lipid concentration in the same formulation.28 Based on these findings, we considered the possibility of obtaining liposomes with different lamellar structures by changing the process parameters and lipid concentrations.
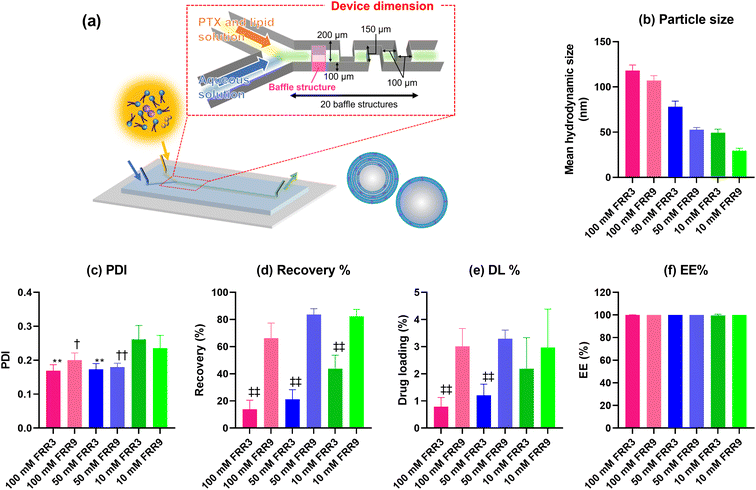
In this current study, paclitaxel (PTX) was used as a model compound, and PTX-loaded liposomes were prepared with homogeneous compositions. Specifically, the PTX-loaded liposomes were prepared under three lipid concentrations and two flow rate ratio (FRR) conditions using a microfluidic device (Fig. 1(a)). In this study, we focused on the preparation of liposomes with different lamellar properties and compared their physicochemical properties. Furthermore, we confirmed the effect of the liposome lamellar structure on the in vitro release kinetics and in vitro activity of PTX.
2. Results and discussion
2.1 Investigation of the physicochemical properties of the PTX-loaded liposomes
First, we investigated the physicochemical properties of the PTX-loaded liposomes. The particle size of the liposomes decreased with decreasing lipid concentration and increasing FRR (Fig. 1(b)). These trends were comparable to those of placebo liposomes and other publications.28,29 The polydispersity index (PDI) of the liposomes was lower than 0.2, except at the lowest lipid concentration (Fig. 1(c)). Indeed, at a lipid concentration of 10 mM, the liposome sizes were smaller than 50 nm, which might have contributed to the higher PDI values compared to those of the larger liposomes. The FRR affected both the recovery (recovery%) and drug loading (DL%) percentages. Thus, the liposomes prepared at an FRR of 9 showed a higher recovery% than those prepared at an FRR of 3 (Fig. 1(d)). Notably, Zheng et al. reported the same trend using erythromycin as the model compound for the hydrophobic drug.30 The DL% showed a similar trend to that of the recovery% (Fig. 1(e)). The PTX in the ethanol phase was precipitated once the ethanol phase made contact with the aqueous phase and the PTX concentration reached the supersaturated concentration. Hydrophobic PTX was incorporated into the lipid bilayer of liposomes at the interface of the aqueous and ethanol phases. A higher FRR induced more rapid ethanol dilution. Therefore, the faster liposome formation rate allowed for the incorporation of PTX into the lipid bilayer rather than the crystallization of PTX.30 The EE% of PTX into the liposomes was almost 100%, indicating that almost all the PTX was loaded into the liposomes (Fig. 1(f)).2.2 Evaluation of the lamellar structure of liposome
Liposomes of different sizes and physicochemical properties were prepared with the same lipid compositions, as shown in Fig. 1. The liposomes were then analyzed by small-angle X-ray scattering (SAXS) and transmission electron microscopy (TEM) techniques to elucidate their internal structure, especially their lamellarity. For the SAXS measurements, peaks derived from the lamellar structure were observed in the liposomes prepared at lipid concentrations of 100 mM and 50 mM (Fig. 2(a) and (b), respectively). Comparing the two liposomes prepared with the latter lipid concentration, the liposomes prepared with an FRR of 9 presented peaks with a weaker peak intensity than those prepared with an FRR of 3. This indicated that the liposomes prepared with an FRR of 3 formed more multi-lamellar structures than those prepared with an FRR of 9.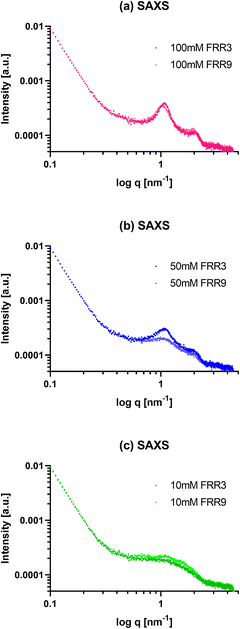 | ||
| Fig. 2 SAXS profiles of PTX-loaded liposomes prepared with (a) 100 mM, (b) 50 mM, and (c) 10 mM concentrations at FRR values of 3 and 9. | ||
In contrast, the two liposomes prepared with 100 mM lipid showed comparable peak intensities. These results suggested that high lipid concentrations (e.g., 100 mM) can form multi-lamellar liposomes, regardless of the FRR. At moderate lipid concentrations (e.g., 50 mM), the FRR may affect the lamellarity of the liposomes. At such concentrations, the lower FRR could induce the formation of multi-lamellar liposomes, whereas the higher FRR could form liposomes with less lamellae (Fig. 2(b)). In addition, from the results of Fig. 1(a), the liposomes that showed a stronger peak intensity in the SAXS results had a larger mean hydrodynamic size of more than 50 nm. Based on these results, for the same lipid composition and preparation method, the hydrodynamic size of the liposomes could be closely related to their lamellar structures. Moreover, these results proved that the liposomes prepared from a 10 mM lipid concentration consisted of uni-lamellar liposomes because they showed almost no peaks derived from the lamellar structure (Fig. 2(c)).
TEM analysis was also carried out to confirm the SAXS results. In the TEM images, the liposomes prepared with 100 mM and 50 mM lipid concentration showed multi-lamellar vesicles inside the liposomes (Fig. 3(b), (c), (e), and (f)). In contrast, the liposomes prepared at a lipid concentration of 10 mM showed only homogeneous particles, which indicated that these liposomes consisted mainly of uni-lamellar liposomes (Fig. 3(a) and (d)). These TEM images were consistent with the SAXS results, and we therefore concluded that the liposome lamellarity can be changed by adjusting the lipid concentration and flow conditions.
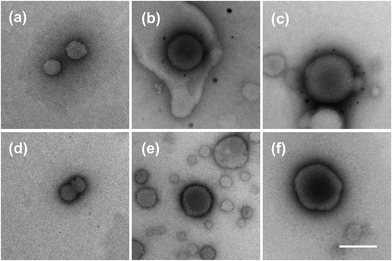 | ||
| Fig. 3 TEM images of the PTX-loaded liposomes: (a) 10 mM FRR = 3, (b) 50 mM FRR = 3, (c) 100 mM FRR = 3, (d) 10 mM FRR = 9, (e) 50 mM FRR = 9, and (f) 100 mM FRR = 9 (scale bar: 100 nm). | ||
2.3 Investigation of the release profiles of PTX from liposomes
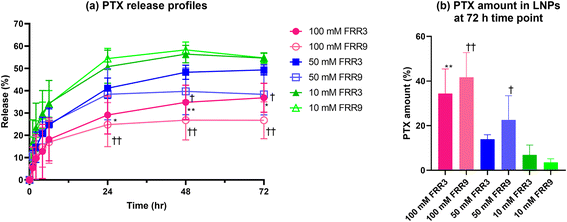
We next investigated the release profiles of PTX from liposomes using dialysis,31 to evaluate the effect of the physicochemical properties on drug release behavior. The PTX release profile from liposomes produced from the lowest (10 mM) lipid concentration showed the fastest release kinetics compared to the liposomes prepared with the higher lipid concentration (50 mM and 100 mM) solutions (Fig. 4(a)). The liposomes with higher lamellarity released PTX more slowly because the presence of several lamellae inside the liposomes delayed the transport of PTX from the inter- to the outer layers and the release of PTX to the outer phases of the liposomes.16The residual PTX in the dialysis membrane bag also showed an extended-release trend. Indeed, a significantly higher amount of PTX was present at the end of the release test in the liposomes prepared with 100 mM lipid than in those prepared from the other two concentrations (Fig. 4(b)).
The total amount of PTX at the time point of 72 h decreased to 58–71% that of the initial PTX amount. We anticipated that the Tween 80 (TW80) present in the release medium would degrade the PTX during the release test, and indeed, the total amount of PTX decreased after 72 h of the release study. Abouelmagd et al. reported that PTX was decomposed by TW80, and the assay value became lower than 75% after 3 d of incubation at 37 °C.31 Notably, their reported value was almost equivalent to our assay decreasing ratio after 72 h of incubation.
At lipid concentrations of 50 mM and 100 mM, the liposomes prepared using an FRR of 3 showed a slightly faster release rate after 24 h than those prepared with an FRR of 9. According to the SAXS and TEM results, liposomes prepared with an FRR of 3 had an equal number or more lamellar structures than those prepared using an FRR of 9. We therefore supposed that these differences in the release rate might be derived from physicochemical properties other than the lamellar structure.
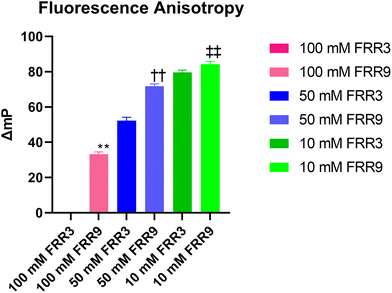
Hence, we proceeded to analyze these liposomes using a fluorescence polarization assay (FPA) to evaluate the fluidity of the lipid membrane. Liposomes with high lipid bilayer fluidity show low fluorescence polarization from 1,6-diphenyl-1,3,5-hexatriene (DPH) in the lipid bilayer. In contrast, liposomes with low lipid bilayer fluidity show high fluorescence polarization because the rigid lipid layer suppresses DPH rotational movement. Therefore, the degree of the change in the fluorescence polarization value (ΔP) is the index of the lipid membrane fluidity. In this study, the liposomes prepared with an FRR of 9 and lipid concentrations of 50 mM and 100 mM showed significantly higher ΔmP values than those prepared using an FRR of 3 (Fig. 5). These results revealed that for each lipid concentration, the liposomes prepared using an FRR of 3 displayed a higher membrane fluidity than those prepared with an FRR of 9. These differences could be attributed to the different loading ratios of PTX. It has been reported that the cholesterol content influences the membrane fluidity and phase transition temperature of liposomes.32 PTX, a hydrophobic drug, was therefore expected to be inserted into the lipid bilayers and to play a similar role to that of cholesterol. Some studies have also suggested that the membrane fluidity of liposomes affects the release rate of drugs loaded into the liposomes.33,34 In summary, the drug release performance can be controlled by tuning the physicochemical properties and liposome inner structure by changing the lipid concentration and flow conditions.
2.4 In vitro cytotoxicity assay
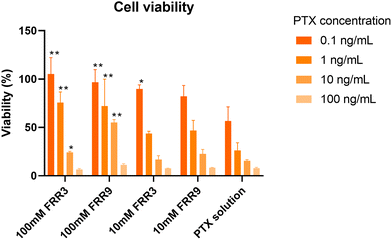
To confirm the effect of the PTX release profile on the PTX activity, we evaluated the cytotoxicity of the PTX-loaded liposomes in HeLa cells. As shown in Fig. 6, the liposomes prepared with a lipid concentration of 100 mM at FRR values of 3 and 9 showed significantly higher HeLa cell viability in the PTX concentration range of 0.1–10 ng mL−1 compared to the cell viability observed following treatment with the PTX solution. This was consistent with the results of the PTX release profiles. From these results, we concluded that multilamellar liposomes could regulate the release of PTX, and its activity in cultured cells could be moderate.3. Conclusions
We investigated the structural differences in PTX-loaded liposomes prepared using a microfluidic device. We observed that the lipid concentration and FRR affected the inner structure and physicochemical properties, such as the liposome size and DL%. More lamellar structures in the liposomes were associated with a more extended release of PTX from the liposomes. Furthermore, the differences in DL% affected the fluidity of the liposome membranes, leading to differences in the release kinetics of PTX from the liposomes 24 h after the in vitro PTX release study. These differences in the release kinetics of PTX were also reflected in the evaluation of the PTX activity in an in vitro cytotoxicity study. The extended release of drugs from liposomes may contribute to lower adverse side effects in patients and less frequent dosing, owing to prolonged drug activity.Few studies have focused on the lamellar nature of liposomes prepared by ethanol dilution using microfluidic technology. Our findings will be valuable for more detailed design and quality control of liposome-based nanomedicines and cosmetics. We anticipate that these findings will make a substantial contribution to the precise formulation of liposomes using microfluidic devices in the pharmaceutical and cosmetic fields.
4. Materials and methods
4.1 Materials
1-Palmitoyl-2-oleoyl-sn-glycero-3-phosphocholine (POPC) was purchased from the NOF AMERICA Corporation (White Plains, NY, US). Cholesterol, ethanol (≥99.5%, HPLC grade), Tween® 80 (TW80), and 1,6-diphenyl-1,3,5-hexatriene (DPH) were purchased from Sigma-Aldrich (St Louis, MO, US). Monohydrate, phosphate-buffered saline (PBS) was purchased from FUJIFILM Wako Pure Chemical Corporation (Osaka, Japan). Paclitaxel (PTX) was purchased from Tokyo Chemical Industry (Tokyo, Japan).4.2 Fabrication of microfluidic device with baffle structures
The microfluidic device was fabricated using standard photolithography.35 The detailed protocol has been described in the literature.29,36 Briefly, the master molds were made from SU-8 3050 (Nippon Kayaku, Tokyo, Japan) for the 100 μm thick layer on silicon wafers. Next, the SU-8 layer on the silicon wafer was exposed to UV light with a mask aligner after which replicated poly(dimethylsiloxane) (PDMS) pieces were bonded with a glass substrate by oxygen plasma treatment (CUTE-1MP/R, Femto Science, Gwangju, Korea). The channel structure and dimensions of the microfluidic device are illustrated in Fig. 1(a).4.3 Preparation of PTX-loaded liposomes
PTX-loaded liposomes were prepared by mixing an aqueous phase and lipid/ethanol (organic) phase in the microfluidic device. An ethanol solution containing certain amounts of POPC, cholesterol, and PTX (POPC/cholesterol/PTX = 90/7/3 molar ratio) was used as the organic solvent phase, while MilliQ water was used as the aqueous phase.These two solutions were placed in a liquid feeding pump (Mitos P-Pumps, Blacktrace Company, Royston, UK) and fed into the microfluidic device. The lipid solution was prepared with three concentrations (10, 50, and 100 mM) of the total components. The total flow rate (TFR) was maintained at 500 μL min−1 and the FRR was fixed at 3 or 9. The collected liposome suspensions were dialyzed with 10![[thin space (1/6-em)]](https://www.rsc.org/images/entities/char_2009.gif) 000 MWCO dialysis membrane tubing (SnakeSkin™ Dialysis Tubing, Thermo Fisher Scientific, Waltham, MA) overnight against a PBS solution. The dialyzed liposome suspension was then filtered through a 0.45 μm filter (DISMIC®, ADVANTEC MFS, California, US) to remove the crystalized/unincorporated PTX. The size of the LNPs was measured by dynamic light scattering (DLS) using a Zetasizer Ultra instrument (Malvern Instruments, Worcestershire, UK).
000 MWCO dialysis membrane tubing (SnakeSkin™ Dialysis Tubing, Thermo Fisher Scientific, Waltham, MA) overnight against a PBS solution. The dialyzed liposome suspension was then filtered through a 0.45 μm filter (DISMIC®, ADVANTEC MFS, California, US) to remove the crystalized/unincorporated PTX. The size of the LNPs was measured by dynamic light scattering (DLS) using a Zetasizer Ultra instrument (Malvern Instruments, Worcestershire, UK).
4.4 Evaluation of the encapsulation efficiencies, drug loading, and recovery ratios of PTX-loaded liposomes
The PTX EE% was expressed as the mass of PTX encapsulated over the total PTX amount in the PTX-loaded LNP suspension filtered through a 0.45 μm filter. The PTX-loaded liposome suspension was filtered through a 0.45 μm filter, diluted with a mixture of acetonitrile and water (50![[thin space (1/6-em)]](https://www.rsc.org/images/entities/char_2009.gif) :
:![[thin space (1/6-em)]](https://www.rsc.org/images/entities/char_2009.gif) 50), and subsequently measured by HPLC. The PTX-loaded liposome suspension filtered through a 0.45 μm filter was placed in a unit with a centrifugal filter (Amicon Ultra, MWCO 50 kDa, Merck, Darmstadt, Germany) and centrifuged for 10 min at 7500 rpm and 4 °C. The ultrafiltered solution was then collected and analyzed by HPLC using the method described above. The EE% was calculated as follows: EE% = ((PTX concentration in PTX-loaded liposome solution filtered through 0.45 μm filter) − (PTX concentration in the ultracentrifuged solution))/(PTX concentration in PTX-loaded liposome solution filtered through 0.45 μm filter) × 100.
50), and subsequently measured by HPLC. The PTX-loaded liposome suspension filtered through a 0.45 μm filter was placed in a unit with a centrifugal filter (Amicon Ultra, MWCO 50 kDa, Merck, Darmstadt, Germany) and centrifuged for 10 min at 7500 rpm and 4 °C. The ultrafiltered solution was then collected and analyzed by HPLC using the method described above. The EE% was calculated as follows: EE% = ((PTX concentration in PTX-loaded liposome solution filtered through 0.45 μm filter) − (PTX concentration in the ultracentrifuged solution))/(PTX concentration in PTX-loaded liposome solution filtered through 0.45 μm filter) × 100.
The drug loading (DL%) was expressed as the mass of the PTX loaded over the total weighted mass of the freeze-dried samples. The PTX-loaded liposomes filtered through a 0.45 μm filter were lyophilized by freeze dryers (EPSILON2-4LSCplus, Martin Christ, Germany) and the lyophilized powder was then weighted. The DL% was calculated as follows: DL% = (PTX amount in PTX-loaded liposome solution filtered through 0.45 μm filter per unit volume)/((Mass of PTX-loaded LNPs filtered through 0.45 μm filter after lyophilization per unit volume) − (Theoretical amount of PBS salt weight per unit volume)) × 100.
The percentage recovery (Recovery%) was expressed as the ratio of the PTX amount loaded in the liposome and the total theoretical amount of PTX added. The percentage recovery was calculated as follows: Recovery% = (PTX amount in PTX-loaded liposome solution filtered through 0.45 μm filter per unit volume)/(Theoretical PTX amount of PTX-loaded liposome solution before filtering through 0.45 μm filter per unit volume) × 100.
For the HPLC analysis, an Agilent 1200 Series high-performance liquid chromatograph (Agilent Technologies, Palo Alto, CA) equipped with a YMC-Pack Pro C8 column (4.6 × 50 mm; 5 μm bead diameter) and a UV detector were used to quantify the drug content in the samples. Samples were eluted with a mixture of acetonitrile and water (50![[thin space (1/6-em)]](https://www.rsc.org/images/entities/char_2009.gif) :
:![[thin space (1/6-em)]](https://www.rsc.org/images/entities/char_2009.gif) 50, v/v) for 5 min (retention time = 2.8 min), followed by acetonitrile and water (90
50, v/v) for 5 min (retention time = 2.8 min), followed by acetonitrile and water (90![[thin space (1/6-em)]](https://www.rsc.org/images/entities/char_2009.gif) :
:![[thin space (1/6-em)]](https://www.rsc.org/images/entities/char_2009.gif) 10, v/v) for 5 min. The elution flow rate, injection volume, and detection wavelength were set at 1.0 mL min−1, 20 μL, and 227 nm, respectively.
10, v/v) for 5 min. The elution flow rate, injection volume, and detection wavelength were set at 1.0 mL min−1, 20 μL, and 227 nm, respectively.
4.5 Evaluation of the lamellar structure of liposomes using SAXS and TEM analysis
Small-angle X-ray scattering (SAXS) measurements were performed on the beamline BL15A2 at the Photon Factory (Ibaraki, Japan). A wavelength of 1.2 Å was employed and the X-ray detector (PILATUS 2M, DECTRIS, Switzerland) distance was set to 1.5 m. SAXS data were collected with 1 s exposure time and integrated 300 images.The morphology and inner structure of the liposomes were observed by transmission electron microscopy (TEM, HITACHI H-7600) at an acceleration energy of 100 kV. Liposome suspensions were diluted with PBS at the appropriate concentration and added to carbon-coated copper grids (400 mesh), followed by staining with a 2% phosphotungstic acid solution. TEM images were collected using a CCD camera (XR16, AMT imaging).
4.6 In vitro release study
Each sample of PTX concentration was adjusted to 50 μg mL−1 of which 1 mL was placed in the 10![[thin space (1/6-em)]](https://www.rsc.org/images/entities/char_2009.gif) 000 MWCO dialysis membrane tubing. The tubing was inserted in 100 mL of PBS containing 0.1% of TW80 and incubated at 37 °C under constant agitation. At timed intervals, 0.5 mL of release medium was sampled and replaced with 0.5 mL of fresh PBS containing 0.1% TW80. The release medium was then analyzed by HPLC. At the endpoint, the samples remaining in the dialysis membrane tubing were also collected and analyzed by HPLC. The release ratio (Release%) was calculated as follows: Release% = (PTX amount in the release medium sampled at each time point)/(PTX amount in the initial sample) × 100.
000 MWCO dialysis membrane tubing. The tubing was inserted in 100 mL of PBS containing 0.1% of TW80 and incubated at 37 °C under constant agitation. At timed intervals, 0.5 mL of release medium was sampled and replaced with 0.5 mL of fresh PBS containing 0.1% TW80. The release medium was then analyzed by HPLC. At the endpoint, the samples remaining in the dialysis membrane tubing were also collected and analyzed by HPLC. The release ratio (Release%) was calculated as follows: Release% = (PTX amount in the release medium sampled at each time point)/(PTX amount in the initial sample) × 100.
4.7 Fluorescence polarization assay of liposomes
The membrane fluidity was evaluated by fluorescence polarization assay (FPA). At the liposome preparation process stage, 0.5 mol% DPH was added to each lipid mixture/ethanol sample to produce DPH-labeled PTX-loaded liposomes. Fluorescence polarization (P) values were obtained using a microplate reader (Infinite® 200 PRO, TECAN, Japan). The excitation/emission wavelengths were set to 360/430 nm, and the measurement temperature was maintained at 25 °C. After the FPA measurement, the degree of change in the fluorescence polarization value (ΔP) was calculated as follows: ΔP = (P values of each liposome suspension) − (P values of 100 mM FRR3 liposome suspension).4.8 Cell culture and in vitro assay
HeLa cells were obtained from ECACC. HeLa cells were cultured in cell-culture dishes (Corning) containing Dulbecco's Modified Eagle's medium (DMEM) supplemented with 10% Fetal Bovine Serum (FBS), penicillin (100 U mL−1), and streptomycin (100 μg mL−1) at 37 °C in 5% CO2. Cells were seeded at a concentration of 4 × 10³ cells per well in a 96-well microplate for 24 h prior to the liposome treatment for the cell viability assay. The cells were then treated with liposomes and incubated for 48 h at 37 °C in 5% CO2. After the incubation, the cell viability was measured using a Cell Counting Kit-8 (Dojindo, Kumamoto, Japan) according to the manufacturer's protocol.4.9 Statistical analysis
The results are expressed as mean ± standard deviation. For multiple comparisons, we performed one-way ANOVA, followed by Tukey's multiple comparison test.Author contributions
Conceptualization, Y.M., M.M., and M.T.; data curation, Y.M., S.U., and M.M.; formal analysis, Y.M., and M.M.; funding acquisition, Y.M., M.M., and M.T.; performed the experiments, Y.M., S.U., and M.M.; study design, Y.M., M.M., and M.T.; resources, M.M., K.W., and M.T.; supervision, M.M. and M.T.; writing of the original draft, Y.M. and M.M.; review and editing, Y.M., M.M., K.W., and M.T. All authors have reviewed and approved the final version of the manuscript for publication.Conflicts of interest
The authors declare no competing financial interest.Acknowledgements
This work was supported by the JST CREST (grant no. JPMJCR17H1, Japan) and JST PRESTO (grant no. JPMJPR19K8, Japan) grants provided by the Special Education and Research Expenses from the Ministry of Education, Culture, Sports, Science, and Technology; AMED (grant no. 22zf0127004h0002) and (grant no. JP21ak0101172) JSPS KAKENHI (grant no. JP19KK0140) grants provided by the Hokkaido University Support Program for Frontier Research. We thank Katsuyoshi Fujimoto, Masashi Mizoguchi and Roman Messerschmid for their kind support. SAXS measurements on beamline BL15A2 at the Photon Factory was performed under the approval of the Photon Factory Program Advisory Committee (Proposal No. 2018G562, 2020G668, and 2022G550). We would also like to thank Hanaichi UltraStructure Research Institute for the TEM measurements.References
- R. Tenchov, R. Bird, A. E. Curtze and Q. Zhou, ACS Nano, 2021, 15, 16982–17015 CrossRef CAS PubMed.
- K. Hörmann and A. Zimmer, J. Controlled Release, 2016, 223, 85–98 CrossRef PubMed.
- P. R. Cullis and M. J. Hope, Mol. Ther., 2017, 25, 1467–1475 CrossRef CAS PubMed.
- Y. Mirchandani, V. B. Patravale and S. Brijesh, J. Controlled Release, 2021, 335, 457–464 CrossRef CAS PubMed.
- Y. Matsuura-Sawada, S. Uno, M. Maeki, K. Wada and M. Tokeshi, ACS Appl. Eng. Mater., 2023, 1(1), 278–286 CrossRef CAS.
- L. M. Ickenstein and P. Garidel, Expert Opin. Drug Delivery, 2019, 16, 1205–1226 CrossRef CAS PubMed.
- Y. N. Lamb, Drugs, 2021, 81, 495–501 CrossRef CAS PubMed.
- L. Schoenmaker, D. Witzigmann, J. A. Kulkarni, R. Verbeke, G. Kersten, W. Jiskoot and D. Crommelin, Int. J. Pharm., 2021, 601, 120586 CrossRef CAS PubMed.
- M. E. R. O'Brien, N. Wigler, M. Inbar, R. Rosso, E. Grischke, A. Santoro, R. Catane, D. G. Kieback, P. Tomczak, S. P. Ackland, F. Orlandi, L. Mellars, L. Alland and C. Tendler, Ann. Oncol., 2004, 15, 440–449 CrossRef PubMed.
- N. R. H. Stone, T. Bicanic, R. Salim and W. Hope, Drugs, 2016, 76, 485–500 CrossRef CAS PubMed.
- A. Sharma, A. Kuhad and R. Bhandari, J. Tissue Viability, 2022, 31, 374–386 CrossRef PubMed.
- J. J. Moon, H. Suh, A. Bershteyn, M. T. Stephan, H. Liu, B. Huang, M. Sohail, S. Luo, S. H. Um, H. Khant, J. T. Goodwin, J. Ramos, W. Chiu and D. J. Irvine, Nat. Mater., 2011, 10, 243–251 CrossRef CAS PubMed.
- K.-I. Joo, L. Xiao, S. Liu, Y. Liu, C.-L. Lee, P. S. Conti, M. K. Wong, Z. Li and P. Wang, Biomaterials, 2013, 34, 3098–3109 CrossRef CAS PubMed.
- M. Al-Amin, F. Bellato, F. Mastrotto, M. Garofalo, A. Malfanti, S. Salmaso and P. Caliceti, Int. J. Mol. Sci., 2020, 21, 1611 CrossRef CAS PubMed.
- G. V. Betageri and D. L. Parsons, Int. J. Pharm., 1992, 81, 235–241 CrossRef CAS.
- S. L. Gosangari and K. L. Watkin, Pharm. Dev. Technol., 2010, 17, 103–109 CrossRef PubMed.
- D. Vorselen, M. Marchetti, C. López-Iglesias, P. J. Peters, W. H. Roos and G. J. L. Wuite, Nanoscale, 2018, 10, 5318–5324 RSC.
- A. Zgadzaj, J. Giebułtowicz, J. Gubernator, M. Podbielska, S. Sommer, M. Zaremba-Czogalla and G. Nałęcz-Jawecki, Eur. J. Pharm. Sci., 2019, 129, 181–189 CrossRef CAS PubMed.
- A. D. Sotto, P. Paolicelli, M. Nardoni, L. Abete, S. Garzoli, S. D. Giacomo, G. Mazzanti, M. A. Casadei and S. Petralito, Pharmaceutics, 2018, 10, 274 CrossRef PubMed.
- P. Kallinteri, S. G. Antimisiaris, D. Karnabatidis, C. Kalogeropoulou, I. Tsota and D. Siablis, Biomaterials, 2002, 23, 4819–4826 CrossRef CAS PubMed.
- V. Gómez-Murcia, B. R. D. Couto, J. C. Gómez-Fernández, M. V. Milanés, M. L. Laorden and P. Almela, Front. Pharmacol., 2019, 10, 1082 CrossRef.
- H. L. Scott, A. Skinkle, E. G. Kelley, M. N. Waxham, I. Levental and F. A. Heberle, Biophys. J., 2019, 117, 1381–1386 CrossRef CAS PubMed.
- L. Zhang, Q. Chen, Y. Ma and J. Sun, ACS Appl. Bio Mater., 2020, 3, 107–120 CrossRef CAS PubMed.
- M. Maeki, S. Uno, A. Niwa, Y. Okada and M. Tokeshi, J. Controlled Release, 2022, 344, 80–96 CrossRef CAS PubMed.
- C. Webb, S. Ip, N. V. Bathula, P. Popova, S. K. V. Soriano, H. H. Ly, B. Eryilmaz, V. A. N. Huu, R. Broadhead, M. Rabel, I. Villamagna, S. Abraham, V. Raeesi, A. Thomas, S. Clarke, E. C. Ramsay, Y. Perrie and A. K. Blakney, Mol. Pharmaceutics, 2022, 19, 1047–1058 CrossRef CAS PubMed.
- T. A. Balbino, N. T. Aoki, A. A. M. Gasperini, C. L. P. Oliveira, A. R. Azzoni, L. P. Cavalcanti and L. G. de la Torre, Chem. Eng. J., 2013, 226, 423–433 CrossRef CAS.
- A. Ghazal, M. Gontsarik, J. P. Kutter, J. P. Lafleur, D. Ahmadvand, A. Labrador, S. Salentinig and A. Yaghmur, J. Phys. Chem. Lett., 2017, 8, 73–79 CrossRef CAS PubMed.
- Y. Matsuura-Sawada, M. Maeki, T. Nishioka, A. Niwa, J. Yamauchi, M. Mizoguchi, K. Wada and M. Tokeshi, ACS Appl. Nano Mater., 2022, 5, 7867–7876 CrossRef CAS.
- N. Kimura, M. Maeki, Y. Sato, Y. Note, A. Ishida, H. Tani, H. Harashima and M. Tokeshi, ACS Omega, 2018, 3, 5044–5051 CrossRef CAS PubMed.
- H. Zheng, H. Tao, J. Wan, K. Y. Lee, Z. Zheng and S. S. Y. Leung, Pharmaceutics, 2022, 14, 1223 CrossRef CAS PubMed.
- S. A. Abouelmagd, B. Sun, A. C. Chang, Y. J. Ku and Y. Yeo, Mol. Pharmaceutics, 2015, 12, 997–1003 CrossRef CAS PubMed.
- S. Kaddah, N. Khreich, F. Kaddah, C. Charcosset and H. Greige-Gerges, Food Chem. Toxicol., 2018, 113, 40–48 CrossRef CAS PubMed.
- B. Maherani, E. Arab-Tehrany, A. Kheirolomoom, D. Geny and M. Linder, Biochimie, 2013, 95, 2018–2033 CrossRef CAS PubMed.
- T. Shimanouchi, H. Ishii, N. Yoshimoto, H. Umakoshi and R. Kuboi, Colloids Surf., B, 2009, 73, 156–160 CrossRef CAS PubMed.
- J. C. McDonald and G. M. Whitesides, Acc. Chem. Res., 2002, 35, 491–499 CrossRef CAS PubMed.
- M. Maeki, Y. Okada, S. Uno, A. Niwa, A. Ishida, H. Tani and M. Tokeshi, J. Visualized Exp., 2022, 181, e62999 Search PubMed.
Footnote |
| † Y.M. and M.M contributed equally to this work. |
| This journal is © The Royal Society of Chemistry 2023 |

