 Open Access Article
Exceptionally enhanced Raman optical activity (ROA) of amyloid fibrils and their prefibrillar states†
Aleksandra
Kolodziejczyk
 ab,
Laurence A.
Nafie
 c,
Aleksandra
Wajda
 *a and
Agnieszka
Kaczor
 *a
*a
aFaculty of Chemistry, Jagiellonian University, Gronostajowa 2, Krakow 30-387, Poland. E-mail: aleksandra.wajda@uj.edu.pl; agnieszka.kaczor@uj.edu.pl
bDoctoral School of Exact and Natural Sciences, Jagiellonian University, Lojasiewicza 11, Krakow 30-348, Poland
cDepartment of Chemistry, Syracuse University, Syracuse, New York 13244, USA
First published on 18th August 2023
Abstract
Amyloid fibrils form remarkable, multi-layered chiral supramolecular architectures. The proximity of interacting oscillators in the chiral fibril supramolecules is responsible for the unusual sensitivity of vibrational circular dichroism (VCD) for fibril formation. Surprisingly, up to now, such characteristics have not been shown for ROA, although it displays the same vibrational markers of fibrils as VCD, including the amide I band. Here, we report an exceptionally large enhancement of the ROA signal detected for mature amyloid fibrils and their prefibrillar states. Remarkably, the same ROA signal has been obtained for fibrils of homologous lysozymes and the dissimilar protein, insulin, indicating a possible common enhanced ROA spectrum, analogous to that for VCD for all amyloid fibrils investigated to date. The ROA signal is observed at earlier stages of fibril formation than VCD and provides access to a considerably broader range of vibrations. Further studies are necessary to verify the applicability of ROA for the analysis of amyloid fibrils.
The process of formation of amyloid fibrils has a characteristic sigmoidal kinetics and starts from the lag phase corresponding to the assembly of the peptide chains into small nuclei, growing into oligomers with ordered, typically β-sheet structures, that finally reorganize into mature fibrils.1 Mature amyloid fibrils show several levels of chiral ordering, including the secondary protein arrangement as well as intra- and inter protofilament organization.2 Exciton coupling of interacting oscillators in highly ordered supramolecular fibril architectures results in unusually strong VCD.3 However, for VCD, the spectra are practically limited to the amide I band region, derived from the excitonically coupled C
![[double bond, length as m-dash]](https://www.rsc.org/images/entities/char_e001.gif) O stretching vibrations. The sign of the couplet is attributed to the protofilament twist and can be reversed by the application of some factors, including pH4–6 and, as recently shown, agitation.7
O stretching vibrations. The sign of the couplet is attributed to the protofilament twist and can be reversed by the application of some factors, including pH4–6 and, as recently shown, agitation.7
Although ROA of amyloid fibrils and their prefibrillar states has been reported, the signal enhancement was not observed8,9 (the discussion regarding this point is given in the ESI,† see also Fig. S1), although the coupling of the C![[double bond, length as m-dash]](https://www.rsc.org/images/entities/char_e001.gif) O oscillators providing enhanced VCD could be also expected to lead to enhanced ROA, that is, like VCD, very sensitive to supramolecular chirality.2
O oscillators providing enhanced VCD could be also expected to lead to enhanced ROA, that is, like VCD, very sensitive to supramolecular chirality.2
To account for this inconsistency, i.e., the unexpected insensitivity of ROA on fibril formation, we have undertaken a systematic study on amyloid formation pathways for two lysozymes, i.e., hen egg white lysozyme (HEWL) and human lysozyme (HL) and, additionally, confirmed the same enhanced ROA spectrum for insulin fibrils. For all three proteins, significant enhancement of VCD was previously reported.3,7
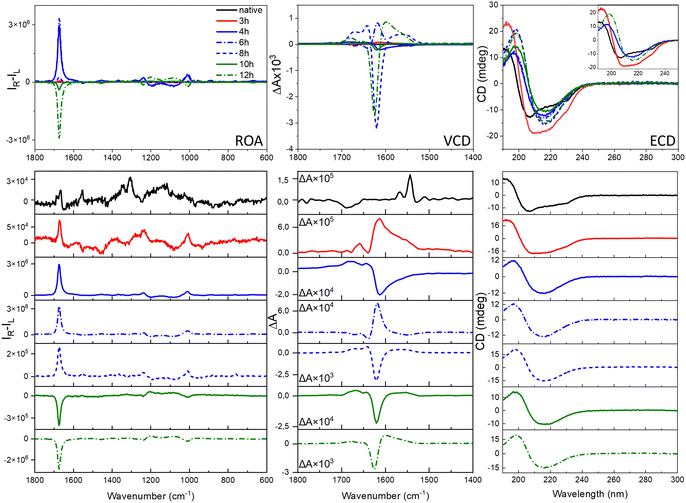
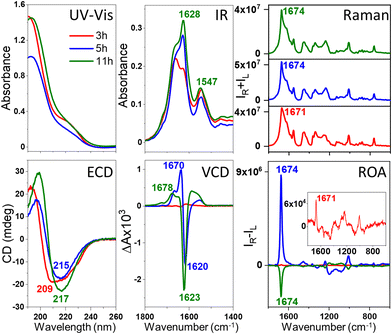
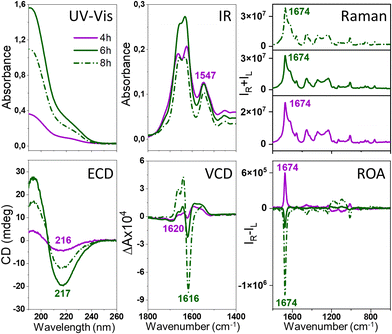
We decided to explore and directly compare the ROA with VCD, electron circular dichroism (ECD) and transmission electron microscopy (TEM) data to control and characterize the amyloid fibril formation. The experimental details are given in the ESI;† briefly, the fibrils were prepared under the previously reported conditions, i.e., at pH of 2.0 and at the elevated temperature of 60 °C.3,7 The lysozyme fibrils were obtained using agitation at 1400 rpm, resulting in the formation of thicker (HEWL, HL) and shorter (HEWL) fibrils compared with non-agitated samples,7 presumably increasing the signal intensity and minimizing the anisotropy that could lead to artifacts in the ROA spectra. For both homologous lysozymes, ROA was measured at various time points from the onset of protein fibrilization. Separate fibril samples were used for different time points keeping the temperature of the fibrilization constant (details in the ESI†). At the same time points, ECD and VCD were recorded to account for different levels of fibril architectures, i.e., the secondary protein structures and protofilaments, respectively. For the selected time points, TEM was also used to image the morphology of the samples. The exceptional enhancement of the ROA spectra of the prefibrillar state for HEWL and fibrils for HEWL and HL was observed (Fig. 1 and 2, respectively), particularly for the amide I band at ca. 1673 cm−1. The HEWL signal recorded after 3 h of incubation is attributed to the prefibrillar state rather than developed fibrils based on the parallel ECD, VCD and TEM data (vide infra). According to the ECD spectra, we also distinguish early-stage (4–8 h) and mature fibrils (10–12 h), which we elaborate further on. For HEWL, the ROA intensity increases with time, and initially the signal is positive (3–8 h of incubation) and for longer incubation times (10–12 h), negative. For HL also, both positive and negative ROA is observed, although the evolution of the signal with time is considerably more complicated. Overall, the circular intensity difference (CID), i.e., the ROA to Raman intensity ratio of the amide I band at ca. 1673 cm−1 is up to 0.5 × 10⁻²–1.5 × 10⁻¹ (Table S1, ESI†), and slightly smaller for insulin fibrils (−8.6 × 10⁻³) and prefibrillar states of HEWL (−1.5 × 10⁻³). The lysozyme enhancement value is ca. 100–1000-fold for early-stage/mature fibrils compared to the typical native protein ROA. This level of enhancement has not been reported for ROA to date.
The comparison with the VCD spectra measured for the same stages of samples’ oligomerization and fibrilization (Fig. 1 and 2) reveals that the ROA precedes the VCD signal, i.e., the enhanced ROA appears after 3–4 h of the onset of the incubation, at the time when VCD is not enhanced. Additionally, the VCD is an exciton couplet at significantly lower wavenumbers, ∼1620 cm−1, compared to the ROA, that appears at ca. 1674 cm−1, where vibrations due to β-sheets and β-turns are observed.10,11 Such assignment is confirmed by the analysis of the ECD spectra. As HEWL and HL are natively rich in the α-helix structure, the α-helix → β-sheet rearrangement is clearly observed in ECD of fibrils obtained after prolonged incubation. For HEWL, the ECD spectral changes are continuous (directional), and for the samples incubated for 3 h (prefibrillar states) only a slight change of the secondary structure from α-helix → β-sheet is observed. In contrast, the ECD of early-stage fibrils and mature fibrils clearly differs from the ECD of the protofibrillar state. Therefore, the ECD results agree very well with the ROA spectra, despite the fact that they provide information about different levels of the fibril organization. The ROA refers to the higher levels of the fibril architectures as confirmed by its considerable amplification due to the formation of the supramolecular organization of a higher order than the secondary structure protein motif. TEM images (Fig. S2, ESI†) indicate that oligomeric structures are formed after 3 and 4 h of incubation for HL and HEWL, respectively, that subsequently rearrange into different morphologies. To prove that the spectra are genuine ROA and not artifacts, we undertook several additional analyses.
For ECD, the cuvette was rotated perpendicularly to the light beam and linear dichroism (LD) was also measured (Fig. S3, ESI†), confirming that the analyzed samples are isotropic in the studied scale and concentration. Additionally, the analysis of the separate spectral blocks (Fig. S4, ESI†) demonstrates that the ROA sign does not change for different blocks in the case of the protofibrils (always positive) and mature fibrils (always negative). For the fibrils incubated for 7–8 h, the signal intensity shows slightly larger fluctuations, most probably due to their structural reorganizations. The consistent and repeatable switch of the ROA sign with the ordering of the HEWL protofibrils into mature fibrils is also a confirmation of the genuine nature of the ROA, although the interpretation of this very interesting feature requires further analysis on a significantly larger number of amyloid fibrils of different proteins.
The ROA, VCD and ECD spectral evolution recorded at 2-hour intervals is presented for HEWL in Fig. 3 (for HL in Fig. S5, ESI†). Raman, IR and electronic absorption spectra are provided in Fig. S6 and S7, ESI.† Although both Raman and IR spectra show some differences indicating changes of the molecular structures, and ECD provides data on the secondary structure rearrangement, the overall sensitivity of these methods on fibril formation is rather limited. VCD shows indeed unprecedented sensitivity to fibrilization with the anisotropy factors g (the VCD to IR ratio) up to 10−2–10−3, i.e., 2–3 orders of magnitude larger than observed for the native proteins.3,6,7 For ROA, the CIDs are up to the 10−1–10−2 range for fibrils and 10−3 for prefibrillar states. This enormous enhancement of the vibrational optical activity (VOA) signal is the feature responsible for the potential of VCD and, as here reported, also ROA for following fibril formation and modifications. The interpretation of the ROA signal of fibrils is hindered by the lack of corresponding aggregate systems to compare. Apart from proteins12,13 and nucleic acids,14 ROA spectra of supramolecular bioassemblies of carotenoid aggregates have been studied,15–17 yet for these systems the amplification is caused by the resonance enhancement rather than by aggregation itself.17 Comparing the fibril signal with the signal of proteins, it is clear that fibril ROA, particularly the amide I band, is exceptionally intense, similar to what is also characteristic for VCD, indicating that they are both derived from higher order motifs in fibril architectures. Yet, ROA has a considerable advantage in fibril studies, as water is a natural solvent for Raman and ROA measurements. ROA provides also access to a considerably broader measurement range, including the low-frequency vibrations. Additionally, our results show that ROA detects earlier stages of fibril formation than VCD. A very important issue is the fact that the sign of the ROA changes as a result of prolonged incubation. Therefore, three types of spectra can be clearly observed: ROA spectra after 3 h of incubation with relatively small CID (Fig. 3, in red), ROA with a positive 1674 cm−1 band (CIDs ca. 10−2, 3–8 h, in blue) and ROA with the negative 1674 cm−1 band (CIDs ca. 10−2, 9–12 h, in green). The three repetitions of the experiment (Fig. S8, ESI†) resulted in the same sequence of the sign change (positive and negative for early-stage and mature fibrils, respectively). Between 6–10 h of incubation, i.e., before and just after the signal reverses, its intensity decreases. Likewise, the ECD spectra can also be classified into three groups according to the shape associated with the protein secondary structure (Table S2, ESI†). The early-stage fibrils showing a slightly lower level of β-sheet structure and positive ROA, rearrange with time into the more thermodynamically stable mature fibrils exhibiting negative ROA, richer in parallel β-sheet structures. The tendency of kinetic stabilization of the antiparallel β-sheet following their rearrangement into parallel β-sheets appears recently a typical feature of fibril formation.18 Yet, the most apparent alteration, related with the ROA sign change is the reverse of the handedness at some level of fibril architectures, that may be accompanied by the reorganization of the secondary protein structures.
 | ||
| Fig. 3 Evolution of the ROA, VCD and ECD spectra during formation of HEWL fibrils. For clarity, the selected ECD spectra are shown in the inset. The respective Raman, IR and electronic absorption spectra are provided in Fig. S6, ESI.† | ||
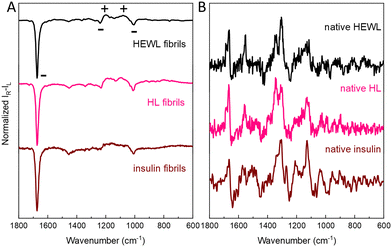
Intense ROA was also recorded for mature insulin fibrils obtained under quiescent conditions (Fig. 4 and Fig. S9, ESI†), which are rather thick and short,3 but not for considerably longer and thinner HL fibrils7 formed in the same conditions (Fig. S10, ESI†). Importantly, comparison of ROA of HEWL, HL and insulin fibrils shows that although the ROA of native proteins are considerably different, the enhanced (− − + + −) ROA pattern (decreasing wavenumber direction, Fig. 4, Raman spectra in Fig. S11, ESI†) or the opposite is a common feature for amyloid fibrils (see Fig. S12, ESI† for the lower frequency range). The observation of the same enhanced ROA spectrum across three different proteins and different preparation conditions (see ESI†) eliminates the possibility that the enhanced ROA is an artifact arising for example from fibril alignment conditions or fluorescence.
 | ||
| Fig. 4 Comparison of amyloid fibril ROA spectra (A) insulin (0 rpm), HEWL (1400 rpm) and HL (1400 rpm). Respective ROA spectra of native proteins are given for reference (B). | ||
The essential general conclusion is that although VCD and ROA are significantly enhanced for amyloid fibrils, they do not share the same sensitivity to stages of amyloid supramolecular chirality development, indicating that they reflect, at least partially, different levels of chiral fibril architectures. An important overall observation is the uniformity of the single enhanced ROA spectrum (relative intensities) that persists across three different proteins under various preparation conditions, sign signatures and time evolution. Of particular interest is the difference in sign between early and late-stage fibril development for HEWL (Fig. S8, ESI†) where some level of supramolecular chirality is being revealed that does not have a counterpart in VCD. These various phenomena require further attention. Although implications of the exceptional sensitivity of ROA for fibril formations are yet difficult to predict, our research opens new perspectives for using ROA as an ultrasensitive tool in studies of amyloid fibrils and prefibrillar states, that is crucial, among others, in light of amyloidosis diagnostics and prevention.
Conceptualization and methodology – AKo, LN, AW, AKa, validation, investigation and data curation – AKo, AW, writing – original draft – AKa, writing – review & editing – AKo, LN, AW visualization – AKo, AW, supervision, project administration and funding acquisition – AKa.
This work was supported by the National Science Centre Poland (project 2020/37/B/ST4/01168). Eryk Tarka is acknowledged for help with the preparation and measurements of fibril samples and Dr Olga Barczyk-Woźnicka for TEM measurements.
Conflicts of interest
There are no conflicts to declare.References
- J. Adamcik and R. Mezzenga, Angew. Chem., Int. Ed., 2018, 57, 8370–8382 CrossRef CAS PubMed.
- A. Kaczor, Phys. Chem. Chem. Phys., 2023, 25, 19371–19379 RSC.
- S. L. Ma, X. L. Cao, M. Mak, A. Sadik, C. Walkner, T. B. Freedman, I. K. Lednev, R. K. Dukor and L. A. Nafie, J. Am. Chem. Soc., 2007, 129, 12364–12365 CrossRef CAS PubMed.
- D. Kurouski, R. K. Dukor, X. F. Lu, L. A. Nafie and I. K. Lednev, Biophys. J., 2012, 103, 522–531 CrossRef CAS PubMed.
- D. Kurouski, J. D. Handen, R. K. Dukor, L. A. Nafie and I. K. Lednev, Chem. Commun., 2015, 51, 89–92 RSC.
- D. Kurouski, X. Lu, L. Popova, W. Wan, M. Shanmugasundaram, G. Stubbs, R. K. Dukor, I. K. Lednev and L. A. Nafie, J. Am. Chem. Soc., 2014, 136, 2302–2312 CrossRef CAS PubMed.
- N. Hachlica, M. Rawski, M. Górecki, A. Wajda and A. Kaczor, Chem. – Eur. J., 2023, 29, e202203827 CrossRef CAS PubMed.
- E. W. Blanch, L. A. Morozova-Roche, D. A. E. Cochran, A. J. Doig, L. Hecht and L. D. Barron, J. Mol. Biol., 2000, 301, 553–563 CrossRef CAS PubMed.
- S. Yamamoto and H. Watarai, Chirality, 2012, 24, 97–103 CrossRef CAS PubMed.
- A. Barth and C. Zscherp, Q. Rev. Biophys., 2002, 35, 369–430 CrossRef CAS PubMed.
- J. T. Pelton and L. R. McLean, Anal. Biochem., 2000, 277, 167–176 CrossRef CAS PubMed.
- L. D. Barron, Z. Q. Wen and L. Hecht, J. Am. Chem. Soc., 1992, 114, 784–786 CrossRef CAS.
- Z. Q. Wen, L. Hecht and L. D. Barron, Protein Sci., 1994, 3, 435–439 CrossRef CAS PubMed.
- A. F. Bell, L. Hecht and L. D. Barron, Biospectroscopy, 1998, 4, 107–111 CrossRef CAS PubMed.
- M. Dudek, E. Machalska, T. Oleszkiewicz, E. Grzebelus, R. Baranski, P. Szcześniak, J. Mlynarski, G. Zajac, A. Kaczor and M. Baranska, Angew. Chem., Int. Ed., 2019, 58, 8383–8388 CrossRef CAS PubMed.
- A. Orlef, E. Stanek, K. Czamara, A. Wajda and A. Kaczor, Chem. Commun., 2022, 58, 9022–9025 RSC.
- G. Zajac, A. Kaczor, A. Pallares Zazo, J. Mlynarski, M. Dudek and M. Baranska, J. Phys. Chem. B, 2016, 120, 4028–4033 CrossRef CAS PubMed.
- A. A. H. Zanjani, N. P. Reynolds, A. Zhang, T. Schilling, R. Mezzenga and J. T. Berryman, Biophys. J., 2020, 118, 2526–2536 CrossRef CAS PubMed.
Footnote |
| † Electronic supplementary information (ESI) available: Experimental details, secondary structure analysis, additional ECD/UV-vis, VCD/IR and ROA/Raman spectra, evaluation of anisotropy in fibril samples, TEM images of fibrils, and Circular Intensity Difference (CID) values. See DOI: https://doi.org/10.1039/d3cc03216g |
| This journal is © The Royal Society of Chemistry 2023 |


