DOI:
10.1039/D2CE01642G
(Paper)
CrystEngComm, 2023,
25, 2038-2051
Terahertz spectroscopic characterization and DFT calculations of vanillin cocrystals with nicotinamide and isonicotinamide†
Received
9th December 2022
, Accepted 3rd March 2023
First published on 3rd March 2023
Abstract
To explore the effects of lattice vibration and molecular interaction on their formation and structure, as well as their mechanical properties, vanillin cocrystals with nicotinamide and isonicotinamide were synthesized and characterized by time-domain Terahertz spectroscopy. The lattice vibrations of these cocrystals, as well as their individual components, were investigated using the dispersion-corrected density functional theory. The simulated terahertz spectra successfully were highly consistent with their experimental spectra. Typical intensive modes of vanillin and the cocrystals were discussed in terms of the motions of hydrogen bonds. The effect of lattice vibration on cocrystal structures was further studied to gain insights into their thermodynamic stability. Geometrical values of the computationally optimized structure were calculated using density functional theory at B3LYP/6-31(d,p) to obtain the highest occupied molecular orbitals and lowest unoccupied molecular orbitals of the cocrystal. The Hirshfeld surface and the molecular electrostatic potential were explored to study the interactions between the individual component of the cocrystals. The mechanical properties of the cocrystals were also calculated using modern quantum chemical methods. This study further highlights the consistency of computational results with crystallographic values, ensuring that the computational modeling of the cocrystals is equally important for predicting their stable geometries and applications.
1. Introduction
Cocrystallization is one effective crystal engineering method to modify the crystal structure and properties of pharmaceuticals, such as solubility, dissolute rate, stability and mechanical properties.1,2 Pharmaceutical cocrystals have homogenous crystalline structures composed of one active pharmaceutical ingredient (API) and other coformers connected through noncovalent bonds in a fixed stoichiometric ratio.3,4 In most cases,5–7 cocrystal formation relies largely on the intermolecular interaction between API and coformers, and cocrystals usually have more favorable stability in terms of potential energy compared to individual components. Although the contribution from electronic energy is generally considered to be the driving force for cocrystal formation, it is also worth noting that vibrational energy may play an important role, since it has been revealed to determine the polymorph stability under certain circumstances.8
Commercial terahertz (THz) spectroscopy typically deals with radiation frequencies between 0.1 and 3.0 THz, which cover part of the far-infrared region of the electromagnetic spectrum.9 It is mainly used to characterize intermolecular vibrational modes. Therefore, THz spectroscopy has wide applications in distinguishing various polymorphs of pharmaceutical and agricultural samples.10 Computational modeling helps interpret experimental observations in the THz vibrational spectrum.11 Not only is the distribution of absorption peaks attractive to experimental researchers, but the thermodynamic effects of lattice vibrations on crystal stability have also received increasing attention in the theoretical field.11 Some theoretical results show that when considering lattice vibration energy, the calculated data is consistent with the experimental results in terms of the stability of API polymorphism.12,13 However, there have been few studies investigating how lattice vibrations affect the stability of cocrystals.
Mechanical properties play an important role in the manufacturing and performance of pharmaceutical crystals, further impacting the tableting process by influencing stress transmission and ejection force during the molding process.14 The elastic stiffness tensor provides the link between an external force and the resultant stress for small deformations.15 Using structural data from atomic models to reliably predict elastic stiffness tensors is attractive and has been the focus of many studies in the past.15–17 Currently, in terms of the widely used pseudo-potential/planar wave implementation of DFT, the most efficient calculation method for van der Waals interactions is to use paired additive correction terms, which is referred to as the DFT-D method.18 And the dispersion corrected DFT calculations have been widely used to study the structure–property relationship of molecular compounds, as well as their compressibility.19,20
The aim of the current study is to gain insights into the role of vibrational energy in the cocrystal formation of vanillin (VAN) with nicotinamide (NIC) and isonicotinamide (INM) through THz spectroscopy and DFT calculations. NIC has four polymorphs, and form I is the thermodynamically stable form. INM has five polymorphs, while form I is more stable than the other forms under ambient conditions. VAN has four different forms, and form I is the most stable form. The thermodynamic stability of the cocrystals was discussed on the basis of DFT calculations. The intermolecular interaction between VAN and NIC/INM was explored through analysis of the Hirshfeld surface, molecular electrostatic potential (MEP) and HOMOs/LUMOs. The mechanical properties of the cocrystals were also calculated and predicted, and elastic stiffness coefficients such as elastic Young's modulus (E), Poisson's ratio (ν), shear modulus (G), and linear compressibility (β) were obtained using modern quantum chemical methods.
2. Experimental
2.1. Materials
Vanillin (VAN, mass purity ≥98%), nicotinamide (NIC, mass purity ≥99%), isonicotinamide (INM, mass purity ≥99%), and ethanol (analytical grade purity) were purchased from Nanchang Jingke Instrument Co., Ltd and used without further purification. Deionized water was prepared by using a Millipore-Q system in our laboratory.
2.2. Cocrystal synthesis
The synthesis method has been reported in our previous article.1 About 1.07 g of VAN was added into 6 mL of ethanol with continuous stirring to obtain a transparent solution at 20 °C. Then, about 0.44 g of NIC was slowly added into the above solution, and after reacting for 10 min, the transparent solution turned into white turbid slurry and needle-like crystals. The preparation of VAN–INM was similar to that of VAN–NIC. About 1.05 g of VAN was added to 5 mL of ethanol to form a clear solution at 20 °C, followed by the addition of 0.12 g of INM, and flaky crystals were obtained after 24 h stirring.
2.3. XRD
PXRD measurements were performed on a Rigaku D/MAX-2500 diffractometer (Rigaku, Japan) using Cu Kα radiation (1.54184 Å) at 40 kV and 200 mA, and the diffraction data were obtained in the 2θ range of 2–50° with a scanning rate of 5° min−1. Single crystal structures were solved using direct methods and refined on F2 through full-matrix least-squares using the SHELXL-2017 program package.
2.4. Time-domain THz spectroscopy
A time-domain terahertz spectrometer (Batop THzTDS1008, Germany) was used to record the THz signals of the samples at room temperature. The samples were first ground and then pressed into pellets under 10 tons of pressure by using a hydraulic press machine, with the pellet thickness ranging from 1.0 mm to 1.2 mm. Dry air was continuously purged into the sample chamber before and during THz data acquisition to reduce the effect of humidity. The time-domain signals of the samples and reference were recorded in the presence and absence of the sample pellet, respectively. The absorption spectra of the samples in the frequency domain were calculated by the comparison between the sample and reference signals after FFT treatment.
2.5. Computational details
2.5.1. Molecular electrostatic potential (MEP).
The structures of VAN, NIC, INM, VAN–NIC and VAN–INM were optimized using the ORCA program21 at the RI-B3LYP-D3(BJ)/def2-TZVP level.22–24 The single point energy was calculated at the RI-wB97M-V/def2-TZVP level25 to obtain the wave function files, which were then applied to perform MEP surface analysis using Multiwfn 3.7,26 with the LIBRETA35 code.25,27 Visual Molecular Dynamics (VMD)28 was used to visualize the simulation results.
2.5.2. Hirshfeld surface.
The crystallographic information files (CIF) of VAN, NIC, INM, VAN–NIC and VAN–INM were inputted to CrystalExplorer to generate the Hirshfeld surfaces.29,30 The Hirshfeld surfaces were mapped with dnorm, the shape index, and curvedness, respectively. In addition, the 2D fingerprint plots were generated via the combination of de and di and then filtered by element to quantify the intermolecular interactions.
2.5.3. HOMOs–LUMOs.
A DFT method was used to optimize the coordinates of the cocrystals, and then HOMO and LUMO energy calculations were performed through the Becke-3–Lee–Yang–Parr (B3LYP) functional with the 6-31+G(d,p) basis set using the GAUSSIAN software.30,31 The optimized structures and the results were visualized using GAUSSVIEW without any constraint on the geometry.
2.5.4. Crystal morphology prediction.
The crystal structures of VAN–NIC and VAN–INM (CCDC 2156730 and 2156728) were used to conduct MD simulations. All the MD simulations were conducted with Materials Studio 6.0. The morphology in a vacuum can be calculated using the Bravais–Friedel–Donnay–Harker (BFDH) model,32 which uses the crystal lattice and symmetry to generate a list of possible growth faces and their relative growth rates.33 This method assumes an inversely proportional relationship between the growth rate and the interplanar distance, and the crystal habit depends on the relative growth rates of each crystal face.
2.5.5. Mechanical properties.
The modern quantum chemical methods and VASP software allow us to get the components of the stiffness tensor and the related mechanical characteristics by calculation, without the necessity for the synthesis of large perfect crystals of all the studied compounds and acoustic experiments. From this point of view, the mechanical properties of VAN–NIC and VAN–INM were calculated using the VASP software.34 Elastic constants are determined by the relationship between strain and stress, and bulk modulus and shear modulus are derived from the Voigt–Reuss–Hill averaging scheme.35,36 These calculations are implemented in the ELATE code.37
2.5.6. THz spectrum calculation.
The initial structures of VAN–NIC and VAN–INM were both obtained from the experimental results deposited in the Cambridge Crystallographic Data Centre (CCDC 2156730 and 2156728).1 They were optimized using PBE functional with PAW pseudopotentials in the VASP package. Grimme-D3 correction38 was used for involving London dispersion during geometry optimizations. The cutoff energy of the pseudopotential was set as 900 eV. The convergence criterion of self-consistent field calculation in the electronic step was set to 1 × 10⁻⁸ eV. The k-point sampling in the Brillouin zone was centered at the Γ point with a k-point spacing of 0.3/2π Å−1. Phonon calculations were carried out at the Γ point in the Phonopy code39 based on a finite displacement method. THz absorption spectra were generated using the Phonopy-Spectroscopy code40 based on the frequency and Born effective charge tensor. The structures and vibrational modes were visualized using the Xcrysden code.41
2.5.7. Thermodynamic energy calculation.
The Helmholtz free energy of one unit cell at any temperature T is calculated using a harmonic approximation method via the following equation:
Here, Epot refers to the electronic potential energy. Fvib is the vibrational contribution, which is expressed as follows:
where
EZPE refers to the vibrational energy at 0 K, namely, zero-point energy:
| |  | (3) |
where
q and
j refer to the wave vector and band index, respectively,
ħ is the reduced Planck constant, and
ωqj refers to the frequency of a mode labeled by a set [
q,
j].
F
vib(T) refers to the temperature-dependent thermal energy, which is caused by the excitation of vibrational modes:
| |  | (4) |
Vibrational energy Evib(T) and vibrational entropy Svib(T) can be calculated through the following equations:
| |  | (5) |
| |  | (6) |
where
q and
j refer to the wave vector and band index, respectively.
ωqj refers to the frequency of a mode labeled by a set [
q,
j].
ħ,
kB and
T are the reduced Planck constant, Boltzmann constant and temperature, respectively.
3. Results and discussion
3.1. Crystal structure analysis
Fig. 1 shows the PXRD patterns of VAN, NIC, INM, VAN–NIC and VAN–INM. We can observe that the characteristic peaks of VAN–NIC and VAN–INM are significantly different from those of VAN and NIC/INM, which confirmed the formation of new crystalline phases. The crystal structures of VAN–NIC and VAN–INM were determined and reported in our previous research.1 Both of them belong to the triclinic system, with the P![[1 with combining macron]](https://www.rsc.org/images/entities/char_0031_0304.gif) (2) space group. Fig. 2 shows the molecular packing modes and hydrogen bonds of the unit cell of VAN–NIC and VAN–INM, respectively. Each asymmetric unit of VAN–NIC contains one VAN and one NIC, which are connected with each other through strong hydrogen bonds (O2–H2A⋯N1, N2–H2A⋯O3, and N2–H2B⋯O1). For VAN–INM, there are one VAN and one INM in the asymmetric unit, in which the VAN is connected to INM via strong hydrogen bonds (N2–H2A⋯O4 and O1–H1A⋯N1). Inside the VAN–NIC crystal structure, two NIC molecules are connected to two VAN molecules through hydrogen bonds (N2–H2A⋯O3 and N2–H2B⋯O1) to form a tetracyclic unit structure, and these units are linked together by a hydrogen bond (O2–H2A⋯N1) involved between NIC molecules to construct a 1D chain structure. As for VAN–INM, two INM molecules are connected via a hydrogen bond (N2–H2A⋯O4) to form a homodimer, in which the VAN molecules are combined at both ends via O1–H1A⋯N1, and infinite homodimers construct a 1D chain structure through weak interactions. The 1D chains were stacked into a three-dimensional (3D) structure through π⋯π interactions and a weak hydrogen bond (C–H⋯O).
(2) space group. Fig. 2 shows the molecular packing modes and hydrogen bonds of the unit cell of VAN–NIC and VAN–INM, respectively. Each asymmetric unit of VAN–NIC contains one VAN and one NIC, which are connected with each other through strong hydrogen bonds (O2–H2A⋯N1, N2–H2A⋯O3, and N2–H2B⋯O1). For VAN–INM, there are one VAN and one INM in the asymmetric unit, in which the VAN is connected to INM via strong hydrogen bonds (N2–H2A⋯O4 and O1–H1A⋯N1). Inside the VAN–NIC crystal structure, two NIC molecules are connected to two VAN molecules through hydrogen bonds (N2–H2A⋯O3 and N2–H2B⋯O1) to form a tetracyclic unit structure, and these units are linked together by a hydrogen bond (O2–H2A⋯N1) involved between NIC molecules to construct a 1D chain structure. As for VAN–INM, two INM molecules are connected via a hydrogen bond (N2–H2A⋯O4) to form a homodimer, in which the VAN molecules are combined at both ends via O1–H1A⋯N1, and infinite homodimers construct a 1D chain structure through weak interactions. The 1D chains were stacked into a three-dimensional (3D) structure through π⋯π interactions and a weak hydrogen bond (C–H⋯O).
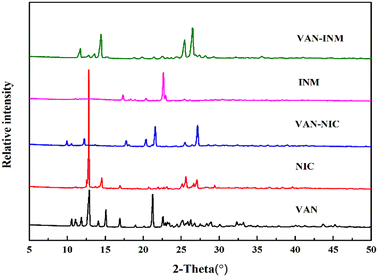 |
| | Fig. 1 PXRD patterns of vanillin (VAN, form I), nicotinamide (NIC, form I), isonicotinamide (INM, form I), vanillin–nicotinamide (VAN–NIC) and vanillin–isonicotinamide (VAN–INM). | |
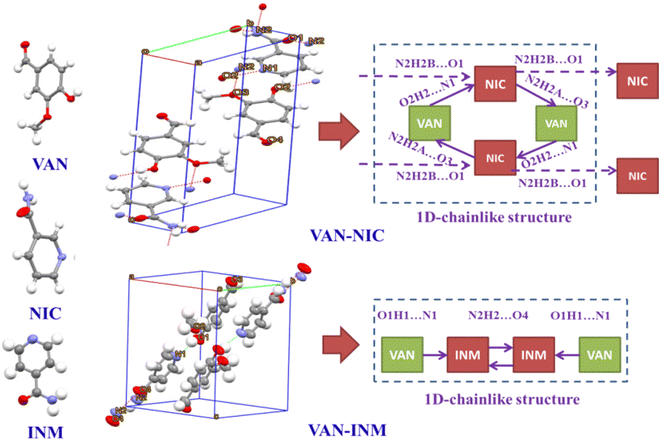 |
| | Fig. 2 Unit cell structures and 1D packing modes of vanillin–nicotinamide (VAN–NIC) and vanillin–isonicotinamide (VAN–INM). | |
The crystal morphology is also investigated to elaborate the different molecular packing modes of VAN–NIC and VAN–INM. The VAN–NIC crystals are rod-like, while the VAN–INM crystals are prismatic. Fig. 3 shows the details of the experimental morphologies related to the molecular packing modes of VAN–NIC and VAN–INM. The experimental morphologies of both cocrystals are compared with the BFDH prediction. Both images are drawn in the same crystallographic orientation, with the x axis close to vertical and the z axis perpendicular to the (001) face. It could be found that the BFDH predicted morphologies of VAN–NIC and VAN–INM are similar to the experimental morphologies. To gain more insights into the effects of molecular packing on morphology formation, the main crystal faces (001, 100) are cut, and the molecular groups exposed to these faces are discussed. For VAN–NIC, there are more hydrogen acceptor/donor sites available on the (100) face than the (001) face, which allows the (100) face to grow faster than the (001) face, with the crystals eventually appearing rod-like. However, in the case of VAN–INM, the (100) and (001) planes have almost equivalent hydrogen acceptor/donor sites, which allows molecules in solution to migrate to both planes at the same rate, allowing the formation of prismatic crystals.
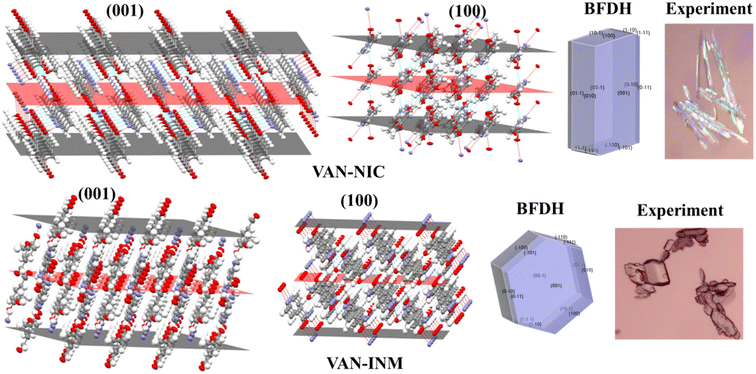 |
| | Fig. 3 Crystal morphologies and molecular packing of the (001) and (100) faces of vanillin–nicotinamide (VAN–NIC) and vanillin–isonicotinamide (VAN–INM). | |
3.2. Estimation of the mechanical properties
Mechanical properties refer to the mechanical behavior of a solid under external stress and are one of the essential properties of molecular crystals.42 The mechanical coefficients including elastic Young's modulus (E), Poisson's ratio (ν), shear modulus (G) and linear compressibility (β) of cocrystals were determined. Table 1 shows the elastic moduli of VAN–NIC and VAN–INM, and it can be seen that the anisotropy ratios for VAN–INM exceed those for VAN–NIC by 2–3 times in terms of Young's modulus and shear modulus. Besides, the maximum values of Young's and shear moduli for VAN–INM are higher, and the minimum values are lower, compared to those for VAN–NIC. The average properties of the two cocrystals are provided in Table S1–S4 of the ESI.† However, as to linear compressibility, the anisotropy ratio for VAN–NIC is about 3.5 times higher than that for VAN–INM. These results verify the larger flexibility of VAN–INM, and VAN–INM shows the elastic bending first and then the plastic strain when increasing the applied stress.43 Unlike VAN–INM, VAN–NIC is extremely brittle and fragile but easily compressed.
Table 1 Comparison of the calculated data of the elastic moduli for vanillin–nicotinamide (VAN–NIC) and vanillin–isonicotinamide (VAN–INM)
|
|
|
Young's modulus, GPa |
Linear compressibility, TPa−1 |
Shear modulus, GPa |
Poisson's ratio |
|
E
min
|
E
max
|
β
min
|
β
max
|
G
min
|
G
max
|
v
min
|
v
max
|
| The modulus value |
VAN–NIC |
5.4726 |
27.291 |
2.1887 |
59.227 |
1.911 |
13.12 |
−0.6335 |
1.3384 |
| VAN–INM |
2.9336 |
38.161 |
9.7875 |
69.616 |
0.9940 |
13.705 |
−1.0638 |
1.7048 |
| Modulus anisotropy ratio |
VAN–NIC |
4.987 |
27.060 |
6.866 |
∞ |
| VAN–INM |
13.01 |
7.1127 |
13.79 |
∞ |
Molecular fragments are bound into the 2D layer by relatively strong hydrogen bonds and form a 3D structure through weaker van der Waals interactions between the layers, which actually dictates the mechanical properties of many molecular crystals.44 This work discusses how the layered structures of the crystals correlate with the directions of the Emin and Emax values of Young's modulus. Undoubtedly, the common feature of VAN–NIC and VAN–INM is that the direction of Young's modulus maximum Emax is almost parallel to the layers (Fig. 4). The layer structure is caused by the rigidity of the planar hydrogen bonds (∼2.90 Å and ∼2.94 Å) for VAN–NIC and VAN–INM, respectively. The calculation results show that the values of Young's modulus along the directions parallel to the layers are greater than in all other directions, about 20 GPa for VAN–NIC and VAN–INM. The minimum values of Young's modulus, Emin, for VAN–NIC and VAN–INM are oriented at an angle to the planes of molecular layers and have lower values than 10 GPa. It is estimated that the shift of molecular fragments is hindered within the layers under external stress and is assisted at an angle to them.45
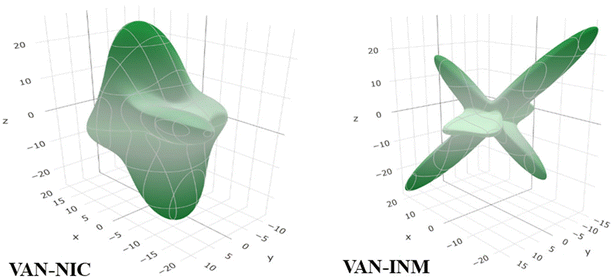 |
| | Fig. 4 3D spatial dependences of Young's moduli (GPa) for vanillin–nicotinamide (VAN–NIC) and vanillin–isonicotinamide (VAN–INM). | |
3.3. Experimental THz spectra
Fig. 5 shows the THz absorption spectra of VAN, NIC, INM, VAN–NIC and VAN–INM at room temperature. The characteristic peaks are marked with their frequencies. It can be found that VAN exhibits one absorption peak at 0.61 THz, while NIC and INM show absorption peaks at 1.125 and 1.94 THz and 1.49 and 1.87 THz, respectively. VAN was reported to have four polymorphs, among which monoclinic form I is the most stable one.46 Our VAN spectrum shows characterized peaks at 0.61, 1.10 and 1.17 THz, which is generally consistent with the observations by Chen and coworkers.47 Under our conditions, the curve shape becomes less clear when the frequency is above 1.25 THz. Fig. 5 also shows that the THz spectra of VAN–NIC (1.06 and 1.41 THz) and VAN–INM (1.45 and 1.62 THz) exhibit different features from their individual constituents. We can conclude that these features do not come from the superposition of the terahertz spectra of their respective components. This difference in the THz spectra provides important evidence for changes in the molecular arrangement after cocrystallization, which is confirmed by PXRD analysis and the crystal structure.
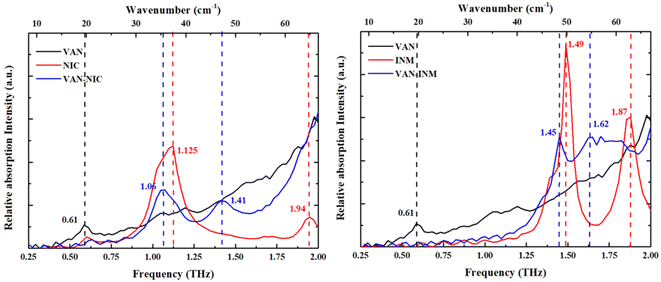 |
| | Fig. 5 Experimental THz absorption spectra of vanillin (VAN), nicotinamide (NIC), isonicotinamide (INM), vanillin–nicotinamide (VAN–NIC) and vanillin–isonicotinamide (VAN–INM). | |
3.4. Calculated THz spectra
Fig. 6 shows the calculated THz spectra of VAN–NIC and VAN–INM, and the vibrational modes are broadened using a Gaussian peak with a FWHM of about 0.1 THz. For VAN–NIC, DFT-FC calculation (Fig. 6a) suggests the absorption taking place at 1.29 and 1.65 THz. In the case of DFT-VC calculation (Fig. 6b), the absorption peaks appear at 1.27 and 1.67 THz, respectively. This good consistency originates from the very close volume of the unit cell after geometry optimization (Table 2). It should be noted that the experimental geometry of VAN–NIC was determined at 150 K,1 indicating that there is no significant anharmonicity for it at temperatures ranging from 0 to 150 K. Both two DFT calculations are close to the features in the experimental spectrum (1.06 and 1.41 THz) except for some blue shifts. It is because the measurements were carried out at room temperature, where the effect of anharmonicity is obvious.
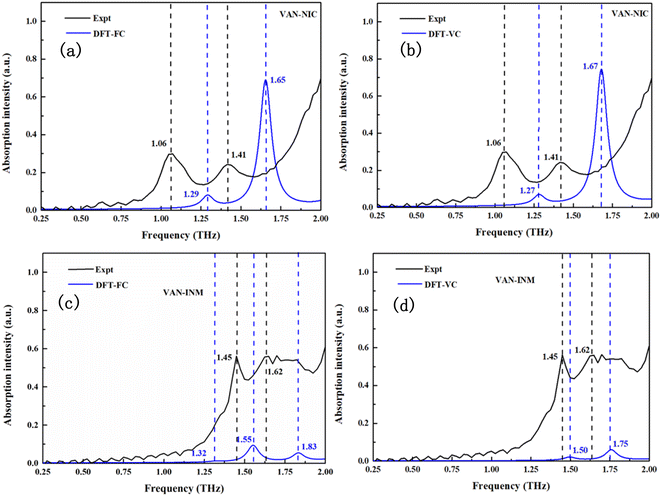 |
| | Fig. 6 Experimental and calculated THz absorption spectra of vanillin–nicotinamide (VAN–NIC) and vanillin–isonicotinamide (VAN–INM). | |
Table 2 The parameters of experimental and optimized unit cells of vanillin–nicotinamide (VAN–NIC) and vanillin–isonicotinamide (VAN–INM)
|
|
|
a (Å) |
b (Å) |
c (Å) |
α (°) |
β (°) |
γ (°) |
V (Å3) |
ΔV |
| VAN–NIC |
Expt |
4.905 |
8.598 |
15.510 |
98.22 |
92.49 |
95.03 |
643.813 |
— |
| DFT-VC |
4.885 |
8.585 |
15.514 |
98.24 |
91.94 |
95.02 |
640.741 |
−0.48% |
| VAN–INM |
Expt |
7.909 |
8.305 |
11.521 |
91.43 |
94.31 |
115.37 |
680.460 |
— |
| DFT-VC |
8.033 |
8.268 |
11.030 |
91.70 |
92.07 |
117.31 |
649.647 |
−4.53% |
Fig. 6c and d display the calculated THz spectra of VAN–INM obtained by DFT-FC and DFT-VC calculations, respectively. The DFT-FC calculation suggests three absorption peaks located at 1.32, 1.55 and 1.83 THz in the spectral range, while the DFT-VC calculation suggests only two absorption peaks located at 1.50 and 1.75 THz. The optimized geometries obtained by these two calculations have a relatively large deviation in the volume of the unit cell (Table 2). The volume of the unit cell shrinks remarkably if the constraint of cell parameters is eliminated. This is because the experimental geometry of the VAN–INM cocrystal was determined at 296 K in which the anharmonicity is significant.1 Theoretically, the calculated frequency of these vibrational modes should match well with the positions of the absorption peaks observed at room temperature. The presence of a blue shift shown in Fig. 6c suggests that there is intrinsic anharmonicity of these modes, for which the harmonic approximation theory cannot handle.
It is interesting to study features of the vibrational modes corresponding to the absorption peaks in the THz spectra. In Fig. 7, we present the drawings of these modes obtained in DFT-FC calculations together with their frequencies. For VAN–NIC, the modes at 1.29 THz and 1.65 THz share some commons. For example, in both modes, the distortions of hydrogen bonds formed between VAN and NIC molecules are mainly triggered by the motion of the carboxamide group of the NIC molecule, while the related oxygen atoms of the VAN molecule almost stand still. The motions of the pyridine ring of the NIC molecule and the benzene ring of the VAN molecule for both modes are obviously different. For the mode at 1.29 THz, the atoms in both rings move out of the ring planes, resulting in the translation or rotation of the rings. For the mode at 1.65 THz, these atoms move in the ring planes, giving rise to distortions.
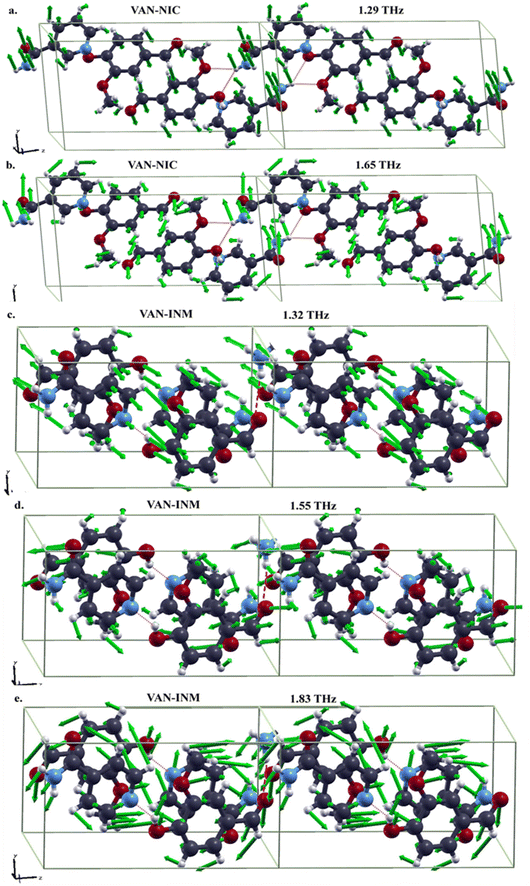 |
| | Fig. 7 Drawings of vibrational modes in the THz range of vanillin–nicotinamide (VAN–NIC, a-1.29 THz, b-1.65 THz) and vanillin–isonicotinamide (VAN–INM, c-1.32 THz, d-1.55 THz, e-1.83 THz) (the green arrows in each mode represent the directions and amplitudes of the atomic movement). | |
For VAN–INM, the mode at 1.32 THz (Fig. 7c) mainly involves the out-of-plane rotations of VAN and INM molecules on their own axes. It can be seen that the hydrogen bond formed between the hydroxyl group of the VAN molecule and the nitrogen atom in the pyridine ring of the INM molecule doesn't distort intensively because all these groups or atoms move almost in the same direction. Similar situation can be found for the hydrogen bonds formed between the carbonyl group of the VAN molecule and the amide group of the INM molecule. For the mode at 1.55 THz (Fig. 7d), the former hydrogen bonds show translational motion, rotation and distoration, but the latter ones are mainly distorted within carbonyl groups of the VAN molecules. For the mode at 1.83 THz (Fig. 7e), in-plane rotations of VAN and INM molecules can be clearly recognized, resulting in distortions of both kinds of hydrogen bonds.
3.5. Hirshfeld surface analysis
The Hirshfeld surface is used to define the space occupied by different parts of a molecule in a crystal and is designed to divide electron density into molecular fragments.48 Hirshfeld surfaces with different types of intermolecular interactions can be identified by color coding the closest atomic distance from the surface to the outside (or inside) of the surface. Fig. 8 shows the Hirshfeld surfaces of VAN–NIC, VAN–INM in the dnorm range of −0.5 to 1.5 Å, and the curvature mapping and shape-index mapping Hirshfeld surfaces were also provided. The Hirshfeld surface of VAN was presented in a transparent mode in order to observe the interactions with adjacent molecules. The three bright red regions (dnorm less than the sum of vdW radii) displayed on the Hirshfeld surface of VAN–NIC represented the three intermolecular interactions, which belong to the hydrogen bonds (N2–H2A⋯O3 and N2–H2B⋯O1) formed between the VAN and NIC quaternion ring and hydrogen bond (O2–H2A⋯N1) involved between the NIC molecules. There are also three bright red regions on the Hirshfeld surface of VAN–INM, with two left sides and one right side, which belong to two strong hydrogen bonds (N2–H2A⋯O4) formed between the INM–INM homodimers and one hydrogen bond (O1–H1A⋯N1) between VAN and INM. In addition, the light red and white spots (dnorm slightly less than and equal to the sum of vdW radii, respectively) were caused by weak C–H⋯O hydrogen bonds involved in the 2D layer packing within the VAN–NIC and VAN–INM crystal structures. The largest blue regions (dnorm greater than the sum of vdW radii) correspond to the subtle H⋯H interactions in the crystal.
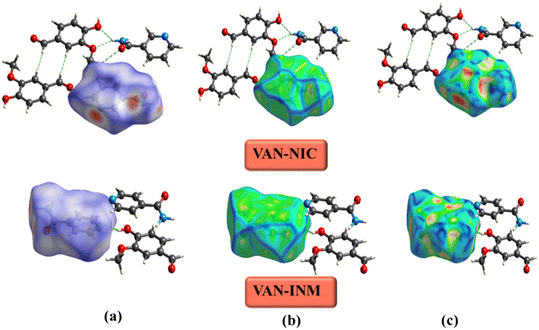 |
| | Fig. 8 Hirshfeld surface of vanillin–nicotinamide (VAN–NIC) and vanillin–isonicotinamide (VAN–INM): (a) dnorm mapping, (b) curvature mapping, and (c) shape-index mapping. | |
Fig. 9 shows the 2D fingerprint plots of VAN–NIC and VAN–INM, which were used to quantitatively analyze the close contact of specific atom pairs. The results showed that the H⋯H interaction occupied the main part of the 2D fingerprint plots and contributed the most to all interactions in the proportion of 34 and 40% for VAN–NIC and VAN–INM, respectively. In addition, the interactions contributed by conventional hydrogen bonds N–H⋯O and O–H⋯N accounted for 40% and 35% of the total interactions for VAN–NIC and VAN–INM, and these two conventional hydrogen bonds showed two sharp spikes in the 2D fingerprint plots, where the upper left spike (di < de) corresponded to the points on the Hirshfeld surface around the hydrogen bond donor and the lower right spike (di > de) corresponded to the points on the Hirshfeld surface around the hydrogen-bond acceptor. Weak interactions such as C⋯H occupied about 16% and 10% of the total interactions, while other interactions such as π–π interaction and Van der Waals forces accounted for 10% and 15% for VAN–NIC and VAN–INM, respectively.
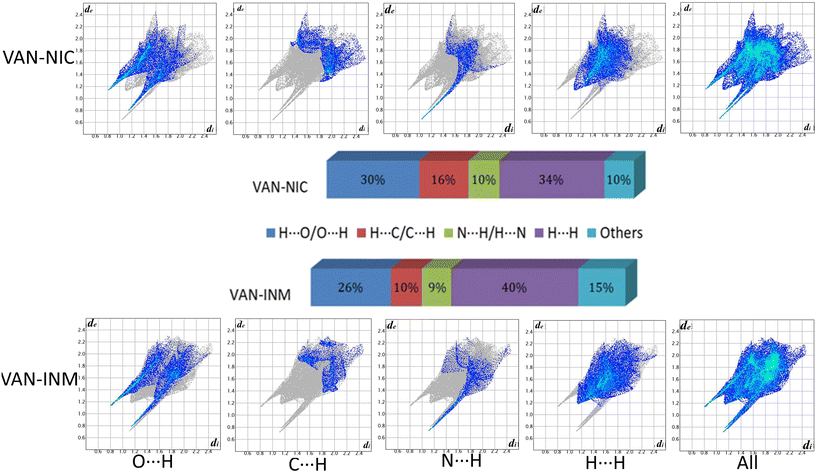 |
| | Fig. 9 2D fingerprint plots of the Hirshfeld surface area and various intermolecular contacts within vanillin–nicotinamide (VAN–NIC) and vanillin–isonicotinamide (VAN–INM). | |
3.6. Molecular electrostatic potential (MEP) analysis
It is well known that molecules always approach each other in the way of molecular electrostatic potential complementation.27 Therefore, by calculating the electrostatic potential on the surface of molecules, it is possible to analyze and predict the nucleophilic and electrophilic points of molecules and the non-covalent interactions between molecules. Fig. 10 shows the MEP of VAN, NIC, INM, VAN–NIC, VAN–INM, where the red regions represent the positive potential of electrophilic sites, and blue regions refer to negative potential of nucleophilic sites. The maximum and minimum values of the local electrostatic potential on the MEP surface are represented by orange and cyan spheres, respectively. According to the crystal structures of VAN–NIC and VAN–INM, there was one type of hydrogen bond donor of VAN (O–H), which has the highest local electrostatic potential (+4.21 kcal mol−1) and favors the formation of hydrogen bonds between VAN and NIC (N2 of the benzene ring, −37.5 kcal mol−1) and INM (N2 of benzene ring, −35.6 kcal mol−1) molecules, respectively. There were two types of hydrogen bond donors of NIC (N2–H2A, N2–H2B), which possess two highest electrostatic potentials (+40.42 kcal mol−1, +51.19 kcal mol−1) and contribute to the formation of N2–H2B⋯O1 and N2–H2A⋯O3 with NIC itself (O1, −40.36 kcal mol−1) and VAN (O3, −40.16 kcal mol−1), respectively. For INM, there was one type of hydrogen bond donor (N2–H2, +51.57 kcal mol−1) and acceptor (O1, −37.31 kcal mol−1), which formed hydrogen bonds N2–H2⋯O4 and N1⋯H1–O1 between INM itself and VAN, respectively. According to the MEP of the VAN–NIC and VAN–INM molecular pairs, the highest electrostatic potential part (O–H, +4.21 kcal mol−1) of VAN is combined with the lowest electrostatic potential part (C![[double bond, length as m-dash]](https://www.rsc.org/images/entities/char_e001.gif) O, −40.36 kcal mol−1) of NIC and the second lowest electrostatic potential part (N of the benzene ring, −35.6 kcal mol−1) of INM. It is obviously that the computationally predicted molecular binding mode differs slightly from that determined by the SCXRD analysis, in which VAN is combined with NIC via an OH⋯N hydrogen bond. The possible reason is that the positive potential of the amine group of NIC hinders the binding of nearby carbonyl oxygen (negative potential) to the hydroxyl group of VAN (positive potential) during the co-crystallization process. Furthermore, VAN–NIC was formed via solution crystallization, and the solvent can influence the binding modes between VAN and NIC. However, we ignored the solvent effect during MEP calculation and analysis, and this is why the theoretical result is a little different from the SCXRD data.
O, −40.36 kcal mol−1) of NIC and the second lowest electrostatic potential part (N of the benzene ring, −35.6 kcal mol−1) of INM. It is obviously that the computationally predicted molecular binding mode differs slightly from that determined by the SCXRD analysis, in which VAN is combined with NIC via an OH⋯N hydrogen bond. The possible reason is that the positive potential of the amine group of NIC hinders the binding of nearby carbonyl oxygen (negative potential) to the hydroxyl group of VAN (positive potential) during the co-crystallization process. Furthermore, VAN–NIC was formed via solution crystallization, and the solvent can influence the binding modes between VAN and NIC. However, we ignored the solvent effect during MEP calculation and analysis, and this is why the theoretical result is a little different from the SCXRD data.
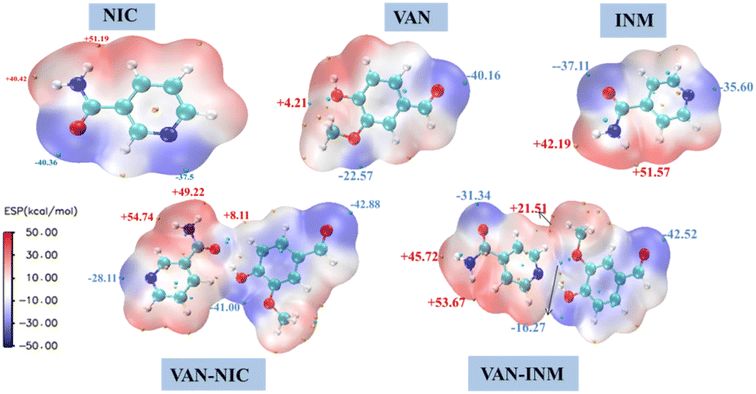 |
| | Fig. 10 Molecular electrostatic potential surface of vanillin–nicotinamide (VAN–NIC) and vanillin–isonicotinamide (VAN–INM). | |
3.7. HOMO–LUMO analysis
The frontier molecular orbital provides theoretical insights into understanding the chemical stability, reactivity, and interactions between the given molecules. We use DFT (B3LYP/6-31(d,p) level) to calculate the highest occupied molecular orbitals (HOMOs) and lowest unoccupied molecular orbitals (LUMOs) of VAN–NIC and VAN–INM, which are shown in Fig. 11. For VAN–NIC, the HOMO electrons are mainly located on the amino moiety that acts as a hydrogen bond donor (N–H), while the LUMOs extended along the carbonyl skeleton act as a hydrogen bond acceptor (O). The observed hydrogen bonding interactions between amino and carbonyl resulting in electron transfer may have influenced the bond angles and lengths. The HOMO–LUMO gap (ΔEgap = EHOMO – ELUMO) describes the polarizability and reactivity of molecules, and it predicts the reactivity between species by providing the electrical transport properties as well as electron carrier mobility in molecules.49 VAN–NIC and VAN–INM were characterized by energy gaps ΔEgap of 0.133 eV and 0.135 eV, indicating that the two cocrystals have similar polarizability and reactivity.
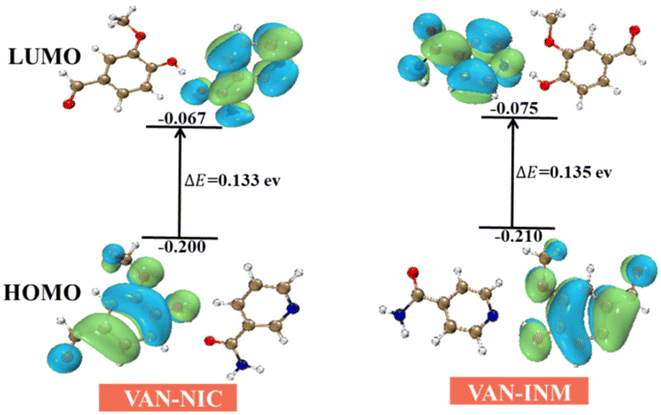 |
| | Fig. 11 HOMO and LUMO energy gap of vanillin–nicotinamide (VAN–NIC) and vanillin–isonicotinamide (VAN–INM). | |
3.8. Thermodynamic analysis
To gain more insights into the cocrystallization mechanism of VAN–NIC and VAN–INM, the thermodynamic stability of these two cocrystals relative to their individual components was discussed on the basis of energy calculations. Our previous work34 has demonstrated that in addition to the enthalpy contribution, the entropy contribution from lattice vibrations has also been shown to be an important factor in controlling cocrystal stability. Therefore, when discussing the thermodynamics of these cocrystal formations, we considered electronic energy (Eelec) and vibrational energies, including zero-point energy (EZPE) and thermal energy (ETE) calculated at 300 K. Table 3 shows the thermodynamic energies of all the crystals. We studied the energies of cocrystals with respect to their individual components, and the results are summarized in Table 4.
Table 3 Thermodynamic energies of vanillin (VAN), nicotinamide (NIC), isonicotinamide (INM), vanillin–nicotinamide (VAN–NIC) and vanillin–isonicotinamide (VAN–INM) (per molecule)
| Sample |
E
elec
|
E
elec + EZPE |
E
elec + EZPE + ETE |
E
elec
|
E
elec + EZPE |
E
elec + EZPE + ETE |
| FC method (kJ mol−1) |
VC method (kJ mol−1) |
| VAN |
−11![[thin space (1/6-em)]](https://www.rsc.org/images/entities/char_2009.gif) 814.03 814.03 |
−11![[thin space (1/6-em)]](https://www.rsc.org/images/entities/char_2009.gif) 435.29 435.29 |
−11![[thin space (1/6-em)]](https://www.rsc.org/images/entities/char_2009.gif) 465.65 465.65 |
−11![[thin space (1/6-em)]](https://www.rsc.org/images/entities/char_2009.gif) 814.03 814.03 |
−11![[thin space (1/6-em)]](https://www.rsc.org/images/entities/char_2009.gif) 435.28 435.28 |
−11![[thin space (1/6-em)]](https://www.rsc.org/images/entities/char_2009.gif) 465.61 465.61 |
| NIC |
−9725.03 |
−9423.26 |
−9447.45 |
−9727.03 |
−9424.82 |
−9448.12 |
| INM |
−9723.49 |
−9421.75 |
−9445.34 |
−9730.10 |
−9427.89 |
−9451.39 |
| VAN–NIC |
−10![[thin space (1/6-em)]](https://www.rsc.org/images/entities/char_2009.gif) 775.62 775.62 |
−10![[thin space (1/6-em)]](https://www.rsc.org/images/entities/char_2009.gif) 436.46 436.46 |
−10![[thin space (1/6-em)]](https://www.rsc.org/images/entities/char_2009.gif) 463.83 463.83 |
−10![[thin space (1/6-em)]](https://www.rsc.org/images/entities/char_2009.gif) 775.68 775.68 |
−10![[thin space (1/6-em)]](https://www.rsc.org/images/entities/char_2009.gif) 436.43 436.43 |
−10![[thin space (1/6-em)]](https://www.rsc.org/images/entities/char_2009.gif) 463.56 463.56 |
| VAN–INM |
−10![[thin space (1/6-em)]](https://www.rsc.org/images/entities/char_2009.gif) 774.16 774.16 |
−10![[thin space (1/6-em)]](https://www.rsc.org/images/entities/char_2009.gif) 435.411 435.411 |
−10![[thin space (1/6-em)]](https://www.rsc.org/images/entities/char_2009.gif) 460.62 460.62 |
−10![[thin space (1/6-em)]](https://www.rsc.org/images/entities/char_2009.gif) 775.54 775.54 |
−10![[thin space (1/6-em)]](https://www.rsc.org/images/entities/char_2009.gif) 435.76 435.76 |
−10![[thin space (1/6-em)]](https://www.rsc.org/images/entities/char_2009.gif) 462.82 462.82 |
Table 4 Energy differences of vanillin–nicotinamide (VAN–NIC) and vanillin–isonicotinamide (VAN–INM) relative to their individual components
| Energy/molecule (kJ mol−1) |
VAN–NIC |
VAN–INM |
| FC |
VC |
FC |
VC |
|
E
elec
|
−6.09 |
−5.15 |
−5.40 |
−3.48 |
|
E
elec + EZPE |
−7.18 |
−6.38 |
−6.89 |
−4.17 |
|
E
elec + EZPE + ETE |
−7.29 |
−6.69 |
−5.13 |
−4.32 |
Not surprisingly, both DFT calculations suggest that the VAN–NIC and VAN–INM cocrystals are more thermodynamically favorable compared to their individual components in the crystal form in terms of their electronic energy. For VAN–NIC, the inclusion of vibrational energies favors its cocrystal formation as revealed by both DFT-FC and DFT-VC calculations. For VAN–INM, the DFT-FC calculation indicates that EZPE favors the cocrystal formation while ETE disfavors it. The total effect of vibrational energy is to slightly lower the stability of the VAN–INM cocrystal. But the DFT-VC calculation suggests that both EZPE and ETE are beneficial to cocrystal formation. In general, VAN–NIC is always more stable than VAN–INM. The inclusion of vibrational energies including EZPE and ETE doesn't change their energy ranking but enlarges their difference.
4. Conclusions
Cocrystals of vanillin with nicotinamide and isonicotinamide were successfully prepared, and the vanillin–nicotinamide crystal shows a tetracyclic unit structure, while vanillin–isonicotinamide forms a homodimer unit within the lattice. The BFDH model successfully predicted the morphology of vanillin–nicotinamide and vanillin–isonicotinamide. The mechanical properties calculated using the VASP software show that the mechanical difference between vanillin–nicotinamide and vanillin–isonicotinamide originates from molecular packing and interaction. We have also simulated terahertz spectra via DFT calculation on the basis of fixed and variable cells, respectively. Both calculations predicted the observed characteristics in the THz spectra of vanillin–nicotinamide and vanillin–isonicotinamide, and DFT with the fixed cell shows a better agreement in terms of the vibrational peak position. Analysis on the most intensive modes of the vanillin crystal and cocrystals shows that the carboxyl group of the vanillin molecule is responsible for intermolecular interactions. Thermodynamic analyses demonstrate that the vibrational energies including zero-point energy and thermal energy play significant roles in these cocrystal formations. This work provides insight into how we can use DFT simulation to understand molecular vibration, packing, morphology and mechanical properties after cocrystal formation.
Author contributions
Jinbo Ouyang: writing – review& editing, resources, and project administration. Xiaohong Xing: investigation and writing – original draft. Bo Yang: investigation. Yin Li: writing – review& editing. Li Xu: methodology. Limin Zhou: supervision. Zongbo Xie: conceptualization. Dandan Han: software.
Conflicts of interest
The authors declare that they have no known competing financial interests or personal relationships that could have appeared to influence the work reported in this paper.
Acknowledgements
The authors acknowledge the financial supports from the National Natural Science Foundation of China (Project No.: 22178054, 22068002), the Training Plan for Academic and Technical Leaders of Major Disciplines in Jiangxi Province (Project No. 20212BCJ23001), the Jiangxi Province Outstanding Youth Fund Project (20224ACB213007), and the Jiangxi Province Key Laboratory of Synthetic Chemistry (JXSC202209).
References
- J. Ouyang, X. Xing, L. Zhou, C. Zhang and J. Y. Y. Heng, Cocrystal design of vanillin with amide drugs: Crystal structure determination, solubility enhancement, DFT calculation, Chem. Eng. Res. Des., 2022, 183, 170–180 CrossRef CAS.
- P. T. Edwards, L. K. Saunders, A. R. Pallipurath, A. J. Britton, E. A. Willneff, E. J. Shotton and S. L. M. Schroeder, Proton Transfer on the Edge of the Salt/Cocrystal Continuum: X-Ray Photoelectron Spectroscopy of Three Isonicotinamide Salts, Cryst. Growth Des., 2021, 21, 6332–6340 CrossRef CAS.
- B. Zhu, Q. Zhang, J.-R. Wang and X. Mei, Cocrystals of Baicalein with Higher Solubility and Enhanced Bioavailability, Cryst. Growth Des., 2017, 17, 1893–1901 CrossRef CAS.
- C. Wang, S. Paul, D. J. Sun, S. O. Nilsson Lill and C. C. Sun, Mitigating Punch Sticking Propensity of Celecoxib by Cocrystallization: An Integrated Computational and Experimental Approach, Cryst. Growth Des., 2020, 20, 4217–4223 CrossRef CAS.
- J. Y. Chen, X. Y. Wang, M. H. Hong, D. X. Yi, M. H. Qi and G. B. Ren, Structure properties of scoparone: Polymorphs and cocrystals, J. Mol. Struct., 2019, 1191, 323–336 CrossRef CAS.
- J. P. Yadav, R. N. Yadav, P. Uniyal, H. Chen, C. Wang, C. C. Sun, N. Kumar, A. K. Bansal and S. Jain, Molecular Interpretation of Mechanical Behavior in Four Basic Crystal Packing of Isoniazid with Homologous Cocrystal Formers, Cryst. Growth Des., 2019, 20, 832–844 CrossRef.
- M. Sowa, K. Slepokura and E. Matczak-Jon, A 1:2 cocrystal of genistein with isonicotinamide: crystal structure and Hirshfeld surface analysis, Acta Crystallogr., Sect. C: Cryst. Struct. Commun., 2013, 69, 1267–1272 CrossRef CAS PubMed.
- L. Xu, Y. Li, P. Jing, G. Xu, Q. Zhou, Y. Cai and X. Deng, Terahertz spectroscopic characterizations and DFT calculations of indomethacin cocrystals with nicotinamide and saccharin, Spectrochim. Acta, Part A, 2021, 249, 119309 CrossRef CAS PubMed.
- J. Hisazumi, T. Suzuki, N. Wakiyama, H. Nakagami and K. Terada, Chemical Mapping of Hydration and Dehydration Process of Theophylline in Tablets Using Terahertz Pulsed Imaging, Chem. Pharm. Bull., 2012, 60, 831–836 CrossRef CAS PubMed.
- Q. Zhou, Y. Shen, Y. Li, L. Xu, Y. Cai and X. Deng, Terahertz spectroscopic characterizations and DFT calculations of carbamazepine cocrystals with nicotinamide, saccharin and fumaric acid, Spectrochim. Acta, Part A, 2020, 236, 118346 CrossRef CAS PubMed.
- X. S. Wu, Y. G. Wang, J. D. Xue, J. J. Liu, J. Y. Qin, Z. Hong and Y. Du, Solid phase drug-drug pharmaceutical co-crystal formed between pyrazinamide and diflunisal: Structural characterization based on terahertz/Raman spectroscopy combining with DFT calculation, Spectrochim. Acta, Part A, 2020, 234, 118265 CrossRef CAS PubMed.
- N. R. Rexrode, J. Orien and M. D. King, Effects of Solvent Stabilization on Pharmaceutical Crystallization: Investigating Conformational Polymorphism of Probucol Using Combined Solid-State Density Functional Theory, Molecular Dynamics, and Terahertz Spectroscopy, J. Phys. Chem. A, 2019, 123, 6937–6947 CrossRef CAS PubMed.
- Y. Du, J. Xue and Z. Hong, Raman and Terahertz Spectroscopic Characterization of Solid-state Cocrystal Formation within Specific Active Pharmaceutical Ingredients, Curr. Pharm. Des., 2020, 26, 4829–4846 CrossRef CAS PubMed.
- S. Paul, C. Wang, K. Wang and C. C. Sun, Reduced Punch Sticking Propensity of Acesulfame by Salt Formation: Role of Crystal Mechanical Property and Surface Chemistry, Mol. Pharmaceutics, 2019, 16, 2700–2707 CrossRef CAS PubMed.
- B. Winkler and V. Milman, Accuracy of Dispersion-Corrected Density Functional Theory Calculations of Elastic Tensors of Organic Molecular Structures, Cryst. Growth Des., 2019, 20, 206–213 CrossRef.
- B. P. A. Gabriele, C. J. Williams, M. E. Lauer, B. Derby and A. J. Cruz-Cabeza, Nanoindentation of Molecular Crystals:
Lessons Learned from Aspirin, Cryst. Growth Des., 2020, 20, 5956–5966 CrossRef CAS PubMed.
- K. Zhang, C. C. Sun, Y. Liu, C. Wang, P. Shi, J. Xu, S. Wu and J. Gong, Structural Origins of Elastic and 2D Plastic Flexibility of Molecular Crystals Investigated with Two Polymorphs of Conformationally Rigid Coumarin, Chem. Mater., 2021, 33, 1053–1060 CrossRef CAS.
- Y. V. Matveychuk, E. V. Bartashevich and V. G. Tsirelson, How the H-Bond Layout Determines Mechanical Properties of Crystalline Amino Acid Hydrogen Maleates, Cryst. Growth Des., 2018, 18, 3366–3375 CrossRef CAS.
- N. Marom, A. Tkatchenko, M. Rossi, V. V. Gobre, O. Hod, M. Scheffler and L. Kronik, Dispersion Interactions with Density-Functional Theory: Benchmarking Semiempirical and Interatomic Pairwise Corrected Density Functionals, J. Chem. Theory Comput., 2011, 7, 3944–3951 CrossRef CAS PubMed.
- M. M. Budzevich, A. C. Landerville, M. W. Conroy, Y. Lin, I. I. Oleynik and C. T. White, Hydrostatic and uniaxial compression studies of 1,3,5-triamino-2,4,6-trinitrobenzene using density functional theory with van der Waals correction, J. Appl. Phys., 2010, 107, 113524 CrossRef.
- F. Neese, F. Wennmohs, U. Becker and C. Riplinger, The ORCA quantum chemistry program package, J. Chem. Phys., 2020, 152, 224108 CrossRef CAS PubMed.
- N. Mardirossian and M. Head-Gordon, OmegaB97M-V: A combinatorially optimized, range-separated hybrid, meta-GGA density functional with VV10 nonlocal correlation, J. Chem. Phys., 2016, 144, 214110 CrossRef PubMed.
- A. D. Becke, Density-functional thermochemistry. III. The role of exact exchange, J. Chem. Phys., 1993, 98, 5648–5652 CrossRef CAS.
- K. Eichkorn, F. Weigend, O. Treutler and R. Ahlrichs, Auxiliary basis sets for main row atoms and transition metals and their use to approximate Coulomb potentials, Theor. Chem. Acc., 1997, 97, 119–124 Search PubMed.
- S. Grimme, S. Ehrlich and L. Goerigk, Effect of the damping function in dispersion corrected density functional theory, J. Comput. Chem., 2011, 32, 1456–1465 CrossRef CAS PubMed.
- T. Lu and F. Chen, Multiwfn: A multifunctional wavefunction analyzer, J. Comput. Chem., 2012, 33, 580–592 CrossRef CAS PubMed.
- X. Ji, D. Wu, C. Li, J. Li, Q. Sun, D. Chang, Q. Yin, L. Zhou, C. Xie, J. Gong and W. Chen, Enhanced Solubility, Dissolution, and Permeability of Abacavir by Salt and Cocrystal Formation, Cryst. Growth Des., 2021, 22, 428–440 CrossRef.
- W. Humphrey, A. Dalke and K. Schulten, VMD: Visual Molecular Dynamics, J. Mol. Graphics, 1996, 14, 33–38 CrossRef CAS PubMed.
- J. J. McKinnon, M. A. Spackman and A. S. Mitchell, Novel tools for visualizing and exploring intermolecular interactions in molecular crystals, Acta Crystallogr., Sect. B: Struct. Sci., 2004, 60, 627–668 CrossRef PubMed.
- D. Yang, R. Wang, G. Jin, B. Zhang, L. Zhang, Y. Lu and G. Du, Structural and Computational Insights into Cocrystal Interactions: A Case on Cocrystals of Antipyrine and Aminophenazone, Cryst. Growth Des., 2019, 19, 6175–6183 CrossRef CAS.
- T. Lu and F. Chen, Quantitative analysis of molecular surface based on improved Marching Tetrahedra algorithm, J. Mol. Graphics Modell., 2012, 38, 314–323 CrossRef CAS PubMed.
- J. C. Givand, R. W. Rousseau and P. J. Ludovice, Characterization of L-isoleucine crystal morphology from molecular modeling, J. Cryst. Growth, 1998, 194, 228–238 CrossRef CAS.
- Y. Park, S. X. M. Boerrigter, J. Yeon, S. H. Lee, S. K. Kang and E. H. Lee, New Metastable Packing Polymorph of Donepezil Grown on Stable Polymorph Substrates, Cryst. Growth Des., 2016, 16, 2552–2560 CrossRef CAS.
- Y. Li, Y. Sun, Q. Li, J. Lei, B. Yang, Y. Shen, Y. Cai and X. Deng, Temperature-Dependent Terahertz Spectra of Isonicotinamide in the Form I Studied Using the Quasi-Harmonic Approximation, ChemPhysChem, 2022, 23, e202100849 CAS.
- R. Hill, The Elastic Behaviour of a Crystalline Aggregate, Proc. Phys. Soc., London, Sect. A, 1952, 65, 349–354 CrossRef.
- R. Roundy, C. R. Krenn, M. L. Cohen and J. J. W. Morris, Ideal Shear Strengths of fcc Aluminum and Copper, Phys. Rev. Lett., 1999, 82, 2713–2716 CrossRef.
- R. Gaillac, P. Pullumbi and F. X. Coudert, ELATE: an open-source online application for analysis and visualization of elastic tensors, J. Phys.: Condens. Matter, 2016, 28, 275201 CrossRef PubMed.
- S. Grimme, J. Antony, S. Ehrlich and H. Krieg, A consistent and accurate ab initio parametrization of density functional dispersion correction (DFT-D) for the 94 elements H-Pu, J. Chem. Phys., 2010, 132, 154104 CrossRef PubMed.
- A. Togo and I. Tanaka, First principles phonon calculations in materials science, Scr. Mater., 2015, 108, 1–5 CrossRef CAS.
- J. M. Skelton, L. A. Burton, A. J. Jackson, F. Oba, S. C. Parker and A. Walsh, Lattice dynamics of the tin sulphides SnS2, SnS and Sn2S3: vibrational spectra and thermal transport, Phys. Chem. Chem. Phys., 2017, 19, 12452–12465 RSC.
- A. Kokalj, XCrySDen—a new program for displaying crystalline structures and electron densities, J. Mol. Graphics Modell., 1999, 17, 176–179 CrossRef CAS PubMed.
- C. Wang and C. C. Sun, Computational Techniques for Predicting Mechanical Properties of Organic Crystals: A Systematic Evaluation, Mol. Pharmaceutics, 2019, 16, 1732–1741 CrossRef CAS PubMed.
- A. J. Thompson, A. I. Chamorro Orue, A. J. Nair, J. R. Price, J. McMurtrie and J. K. Clegg, Elastically flexible molecular crystals, Chem. Soc. Rev., 2021, 50, 11725–11740 RSC.
- T. Pramanik, S. Sarkar and T. N. Guru Row, Halogen Bonded Network Modulating the Mechanical Property Elastic and Plastic Bending in Nonconventional Molecular Solid Solutions, Cryst. Growth Des., 2021, 22, 48–53 CrossRef.
- M. K. Mishra, K. Mishra, S. A. Syed Asif and P. Manimunda, Structural analysis of elastically bent organic crystals using in situ indentation and micro-Raman spectroscopy, Chem. Commun., 2017, 53, 13035–13038 RSC.
- J. Yang, S. Xu, J. Wang and J. Gong, Nucleation behavior of ethyl vanillin: Balance between chemical potential difference and saturation temperature, J. Mol. Liq., 2020, 303, 112609 CrossRef CAS.
- T. Chen, X. Zhong, Z. Li and F. Hu, Analysis of Intermolecular Weak Interactions and Vibrational Characteristics for Vanillin and Ortho-Vanillin by Terahertz Spectroscopy and Density Functional Theory, IEEE Trans. Terahertz Sci. Technol., 2021, 11, 318–329 CAS.
- D. Maddileti, B. Swapna and A. Nangia, Tetramorphs of the Antibiotic Drug Trimethoprim: Characterization and Stability, Cryst. Growth Des., 2015, 15, 1745–1756 CrossRef CAS.
- Q. Fu, Y. Han, Y. F. Xie, N. B. Gong and F. Guo, Carbamazepine cocrystals with several aromatic carboxylic acids in different stoichiometries: Structures and solid state characterization, J. Mol. Struct., 2018, 1168, 145–152 CrossRef CAS.
|
| This journal is © The Royal Society of Chemistry 2023 |
Click here to see how this site uses Cookies. View our privacy policy here.  *a,
Xiaohong
Xing
a,
Bo
Yang
b,
Yin
Li
*b,
Li
Xu
a,
Limin
Zhou
a,
Zongbo
Xie
 a and
Dandan
Han
 c
c


![[1 with combining macron]](https://www.rsc.org/images/entities/char_0031_0304.gif) (2) space group. Fig. 2 shows the molecular packing modes and hydrogen bonds of the unit cell of VAN–NIC and VAN–INM, respectively. Each asymmetric unit of VAN–NIC contains one VAN and one NIC, which are connected with each other through strong hydrogen bonds (O2–H2A⋯N1, N2–H2A⋯O3, and N2–H2B⋯O1). For VAN–INM, there are one VAN and one INM in the asymmetric unit, in which the VAN is connected to INM via strong hydrogen bonds (N2–H2A⋯O4 and O1–H1A⋯N1). Inside the VAN–NIC crystal structure, two NIC molecules are connected to two VAN molecules through hydrogen bonds (N2–H2A⋯O3 and N2–H2B⋯O1) to form a tetracyclic unit structure, and these units are linked together by a hydrogen bond (O2–H2A⋯N1) involved between NIC molecules to construct a 1D chain structure. As for VAN–INM, two INM molecules are connected via a hydrogen bond (N2–H2A⋯O4) to form a homodimer, in which the VAN molecules are combined at both ends via O1–H1A⋯N1, and infinite homodimers construct a 1D chain structure through weak interactions. The 1D chains were stacked into a three-dimensional (3D) structure through π⋯π interactions and a weak hydrogen bond (C–H⋯O).
(2) space group. Fig. 2 shows the molecular packing modes and hydrogen bonds of the unit cell of VAN–NIC and VAN–INM, respectively. Each asymmetric unit of VAN–NIC contains one VAN and one NIC, which are connected with each other through strong hydrogen bonds (O2–H2A⋯N1, N2–H2A⋯O3, and N2–H2B⋯O1). For VAN–INM, there are one VAN and one INM in the asymmetric unit, in which the VAN is connected to INM via strong hydrogen bonds (N2–H2A⋯O4 and O1–H1A⋯N1). Inside the VAN–NIC crystal structure, two NIC molecules are connected to two VAN molecules through hydrogen bonds (N2–H2A⋯O3 and N2–H2B⋯O1) to form a tetracyclic unit structure, and these units are linked together by a hydrogen bond (O2–H2A⋯N1) involved between NIC molecules to construct a 1D chain structure. As for VAN–INM, two INM molecules are connected via a hydrogen bond (N2–H2A⋯O4) to form a homodimer, in which the VAN molecules are combined at both ends via O1–H1A⋯N1, and infinite homodimers construct a 1D chain structure through weak interactions. The 1D chains were stacked into a three-dimensional (3D) structure through π⋯π interactions and a weak hydrogen bond (C–H⋯O).


![[double bond, length as m-dash]](https://www.rsc.org/images/entities/char_e001.gif) O, −40.36 kcal mol−1) of NIC and the second lowest electrostatic potential part (N of the benzene ring, −35.6 kcal mol−1) of INM. It is obviously that the computationally predicted molecular binding mode differs slightly from that determined by the SCXRD analysis, in which VAN is combined with NIC via an OH⋯N hydrogen bond. The possible reason is that the positive potential of the amine group of NIC hinders the binding of nearby carbonyl oxygen (negative potential) to the hydroxyl group of VAN (positive potential) during the co-crystallization process. Furthermore, VAN–NIC was formed via solution crystallization, and the solvent can influence the binding modes between VAN and NIC. However, we ignored the solvent effect during MEP calculation and analysis, and this is why the theoretical result is a little different from the SCXRD data.
O, −40.36 kcal mol−1) of NIC and the second lowest electrostatic potential part (N of the benzene ring, −35.6 kcal mol−1) of INM. It is obviously that the computationally predicted molecular binding mode differs slightly from that determined by the SCXRD analysis, in which VAN is combined with NIC via an OH⋯N hydrogen bond. The possible reason is that the positive potential of the amine group of NIC hinders the binding of nearby carbonyl oxygen (negative potential) to the hydroxyl group of VAN (positive potential) during the co-crystallization process. Furthermore, VAN–NIC was formed via solution crystallization, and the solvent can influence the binding modes between VAN and NIC. However, we ignored the solvent effect during MEP calculation and analysis, and this is why the theoretical result is a little different from the SCXRD data.


![[thin space (1/6-em)]](https://www.rsc.org/images/entities/char_2009.gif) 814.03
814.03![[thin space (1/6-em)]](https://www.rsc.org/images/entities/char_2009.gif) 435.29
435.29![[thin space (1/6-em)]](https://www.rsc.org/images/entities/char_2009.gif) 465.65
465.65![[thin space (1/6-em)]](https://www.rsc.org/images/entities/char_2009.gif) 814.03
814.03![[thin space (1/6-em)]](https://www.rsc.org/images/entities/char_2009.gif) 435.28
435.28![[thin space (1/6-em)]](https://www.rsc.org/images/entities/char_2009.gif) 465.61
465.61![[thin space (1/6-em)]](https://www.rsc.org/images/entities/char_2009.gif) 775.62
775.62![[thin space (1/6-em)]](https://www.rsc.org/images/entities/char_2009.gif) 436.46
436.46![[thin space (1/6-em)]](https://www.rsc.org/images/entities/char_2009.gif) 463.83
463.83![[thin space (1/6-em)]](https://www.rsc.org/images/entities/char_2009.gif) 775.68
775.68![[thin space (1/6-em)]](https://www.rsc.org/images/entities/char_2009.gif) 436.43
436.43![[thin space (1/6-em)]](https://www.rsc.org/images/entities/char_2009.gif) 463.56
463.56![[thin space (1/6-em)]](https://www.rsc.org/images/entities/char_2009.gif) 774.16
774.16![[thin space (1/6-em)]](https://www.rsc.org/images/entities/char_2009.gif) 435.411
435.411![[thin space (1/6-em)]](https://www.rsc.org/images/entities/char_2009.gif) 460.62
460.62![[thin space (1/6-em)]](https://www.rsc.org/images/entities/char_2009.gif) 775.54
775.54![[thin space (1/6-em)]](https://www.rsc.org/images/entities/char_2009.gif) 435.76
435.76![[thin space (1/6-em)]](https://www.rsc.org/images/entities/char_2009.gif) 462.82
462.82
