Nontrivial ultraslow dynamics under electric-field in nematics of bent-shaped molecules†
Satoshi
Aya
 *ab,
Wentao
Tang
a,
Xian
Kong
a,
Yuki
Arakawa
 *c,
Kenta
Komatsu
c and
Hideto
Tsuji
 c
c
aSouth China Advanced Institute for Soft Matter Science and Technology (AISMST), School of Emergent Soft Matter, South China University of Technology, Guangzhou 510640, China. E-mail: satoshiaya@scut.edu.cn
bGuangdong Provincial Key Laboratory of Functional and Intelligent Hybrid Materials and Devices, South China University of Technology, Guangzhou 510640, China
cDepartment of Applied Chemistry and Life Science, Graduate School of Engineering, Toyohashi University of Technology, Toyohashi, 441-8580, Japan. E-mail: arakawa@tut.jp
First published on 9th November 2022
Abstract
For over decades, nematic liquid crystals have been recognized as highly fluidic materials that respond to electric field on the millisecond scale. In contrast to traditional nematics with fast responsivity, we herein report nontrivial ultraslow electric-driven dynamics in bent-shaped nematic materials. Varying the alkyl chain spacers of bent-shaped cyanobiphenyl dimers (COOm and OCOm) shows a ‘transition’ in the dynamics behavior between the bent-dimeric and bent-core materials. Interestingly, with short alkyl chain spacers, COO2 exhibits unexpected ultra-slow dynamic pathways, i.e., “quasi-static” electrohydrodynamic convection. A significant observation is that the on/off-electro-switching time of COO2 is 10![[thin space (1/6-em)]](https://www.rsc.org/images/entities/char_2009.gif) 000 times higher than that of typical nematic materials, which is the largest value reported ever in the kilo-second range. In addition, the threshold voltage for inducing the reorientation of the nematic director for COO2 is higher than 5 V, which is uncommon in traditional N materials. These properties are distinct from those of traditional nematic materials and discussed in terms of dielectric constants and electrohydrodynamic convection.
000 times higher than that of typical nematic materials, which is the largest value reported ever in the kilo-second range. In addition, the threshold voltage for inducing the reorientation of the nematic director for COO2 is higher than 5 V, which is uncommon in traditional N materials. These properties are distinct from those of traditional nematic materials and discussed in terms of dielectric constants and electrohydrodynamic convection.
Introduction
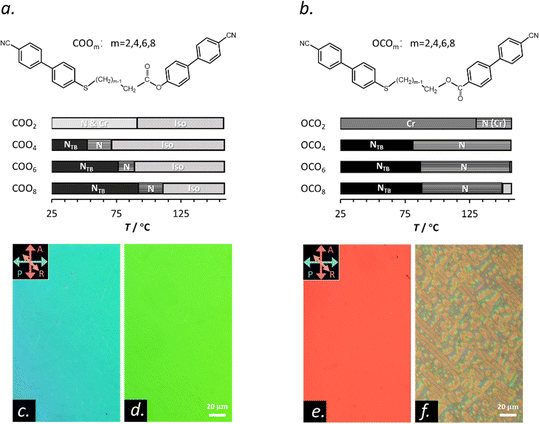
Molecular shape and intermolecular interactions play important roles in determining macroscopic behaviors of liquid crystals (LCs).1,2 Traditional uniaxial nematic liquid crystals (NLCs) exhibit the highest symmetry among the LC phases,3 being the most fluidic LC state. It can be realized through assembling anisotropic molecular entities such as rod-, bent-, discotic-shaped molecules, etc. While NLCs of rod-shaped molecules easily undergo both translational and rotational dynamics, NLCs of bent-core molecules with a rigid core usually possess a larger rotational hindrance. This arises due to a steric effect. The bent-shaped molecules are likely to pack into localized cybotactic clusters that are stable over a wide temperature range,4–9 where the molecules arrange in short range lamellar forms (i.e., smectic-like).In recent decades, there have been an increased number of reports on anomalous LC properties caused by bent-shaped molecules.10–16 Dorjgotov et al. found much higher rotational and flow viscosities for a bent-core material than typical rod-shaped calamitics.17 As many groups reported, unlike common calamitic NLCs, the bend elastic constant K33 is smaller than the splay elastic constant K11 in bent-core materials.18–22 Bent dimers are another type of bent-shaped LC material, where a flexible chain having an odd number of atoms along the chain links to two rigid mesogenic arms. Such a molecular design generally triggers the existence of another type of nematics, the so-called twist-bend nematic (NTB), that possesses a heliconical director field without positional order.23,24 Recently, we reported that an ester- and thioether-linked cyanobiphenyl dimer COO4 exhibits an extremely slow electric-field switching time in an N phase, whereas the OCO4 counterpart based on reversed ester linkage shows that comparable to traditional nematics (Fig. 1).25 From dielectric spectroscopy studies, we clarified that the slow-down of the dynamics would be induced by the existence of quasi-layered clusters embedded in the N background of COO4. The results claim the important role of the difference in the molecular curvature due to the direction of esters (COOm or OCOm, where m denotes the number of carbon atoms in the spacers) in the orientational viscosity of NLCs. This study suggests potential existence of still unknown, molecular shape-driven dynamics in the bent dimeric LCs, and motivated us to further investigate the dynamics of the shortest bent LC dimers.
Here, by systematically investigating how the length of the alkyl chain spacers in bent-shaped dimers affects the LC dynamics, we find a transition behavior between the bent-dimer and bent-core molecules for shorter spacer dimers of COOm. Unexpected ultra-slow dynamic pathways are revealed for the shortest COO2, and can be interpreted using a “quasi-static” electrohydrodynamic convection (EHC). In addition, COO2 exhibits the slowest on/off-electro-switching reported ever,17,26–28 in the kilo-second range. The threshold voltage for inducing the reorientation of the N director for a neat COO2 sample is unexpectedly higher than 5 V, uncommon to the traditional N materials. Finally, we demonstrate that mixing of materials is an effective method for tuning the effective viscosity on a broad time scale, ca. 50 ms–1000 s.
Results and discussion
Fig. 1(a) and (b) show the molecular structures of dimeric LC materials (COOm and OCOm) and their phase sequences. Their synthesis and phase transitions were previously reported.29 Generally, the phase sequence of isotropic liquid (Iso)-N-NTB is shown, except for COO2 and OCO2. Upon decreasing the spacer chain lengths from m = 10 to m = 4 of COOm, the corresponding phase-transition temperatures (except for glass transitions) significantly decline, and then shift to increase for m = 2. Besides, the temperature range of the NTB phase of COOm becomes wider with increasing m. On the other hand, m-dependencies on the phase transition temperatures of OCOm are relatively smaller than those of COOm and differ with respect to each phase transition. In addition, phase-transition temperatures and entropy changes at the Iso-N phase transitions (ΔSIN) of COOm are much lower than those of OCOm.29 These different behaviors between COOm and OCOm may be associated with the difference in their molecular curvature, which are discussed in terms of molecular calculations later. The shortest COO2 and OCO2 show only the N and crystalline phases. Thus, a flexible alkyl chain spacer plays important roles in inducing and stabilizing the NTB phase. Notably, COO2 exhibits the N phase as a metastable state, coexisting with some crystalline nuclei (Fig. S1, ESI†). The crystal state usually covers the field of view when the growth of the crystal is kinetically allowed upon heating. By decreasing the length of the flexible alkyl chain spacer, we expect that the effective molecular flexibility provided by the spacer will decrease. This likely replaces the NTB phase with the N or Cr phase for the shortest m = 2 in the present two dimer systems.The optical texture of the N phase of COO2 (Fig. 1(c) and (d)) under polarizing light microscopy (PLM) is just the same with the typical N texture, e.g., the N texture of OCO4 (Fig. 1(e)). In contrast to OCO2, where the N phase exists at high temperatures and is soon covered by crystals (not stable enough for the observation; Fig. 1(b)), COO2 demonstrates a wide temperature window for the N phase from 81 °C without the NTB phase beneath (Fig. 1(a), (c) and (d)). We note that a small area in the field-of-view is covered by a coexisting crystalline phase in the N background (also see Fig. S1 and ESI†). These crystallization tendencies of the shortest dimers could be associated with their greater molecular rigidity.
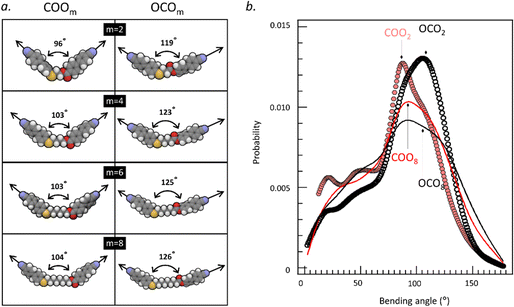
To understand the difference in molecular features between COOm and OCOm, we conducted density-functional-theory (DFT) calculation and molecular dynamics (MD) simulation for a single molecule. While the former would provide information on the well-defined molecular geometry for a single conformer (e.g., all-trans and all-cis conformers), the latter can reveal the conformer distribution for a molecule. In Fig. 2(a), we show the DFT-optimized molecular structures of homologous series of COOm and OCOm (m = 2, 4, 6, and 8) in the all-trans form. It is found that the bending angles for the all-trans conformer between long axes of two cyanobiphenyl arms of the COOm series are much smaller than those of the OCOm counterparts. Since the molecules show a wide variety of conformations in reality, it is also important to know the conformational distribution. Fig. 2(b) demonstrates the probabilities to find a certain conformer characterized by the bending angle for two extreme cases with very long and short spacer lengths, i.e., COOm and OCOm (m = 2 and 8), based on the MD simulation. As general tendencies,
(i) there are higher probabilities to find molecular conformers with bending angles in the range of 80–140° for COOm. It means that the major population is close to the trans conformer and less population of the hairpin-like conformer with very small bending angles is found in COOm. Only COO2 and OCO2 have similar maximum probability values, but with distinct peak positions.
(ii) at the shortest extreme of the spacer length, the bending angles at the peak tops of the probability for COOm and OCOm (m = 2) are roughly consistent with those found in the DFT calculation. It suggests that the top-populated conformers are all-trans conformers when the flexible alkyl chain spacer is decreased;
(iii) with increasing spacer length, the conformer distribution becomes wider with less conformational preference. At the longest extreme of the spacer length, the conformer distributions for COOm and OCOm (m = 8) become similar.
Roughly summarizing, the COOm molecules at shorter spacer lengths are more bent compared with the OCOm molecules, which could be associated with lower phase-transition temperatures and ΔSIN for COOm than for OCOm at corresponding m.5 The calculations also indicate a trend that the molecules with shorter alkyl chain spacers lead to a smaller effective bending angle (that is, more bent shaped)30 because the molecular length and gauche conformation contribute significantly to effective molecular bending.31 Therefore, a decrease in the bending angle (or enhanced molecular curvature) upon shortening spacer lengths could affect the phase-transition behaviors.
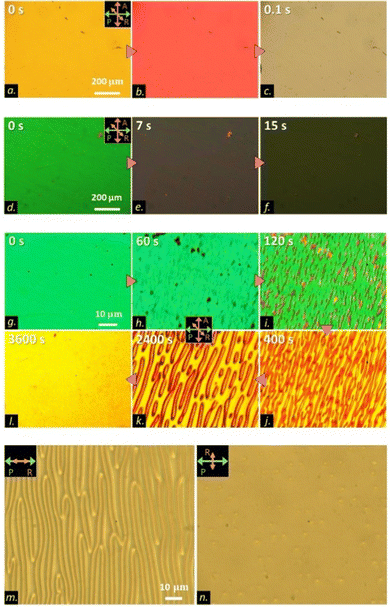
To explore the electro-optic (EO) response of the neat COO2 material, we applied an electric field along the LC substrates’ normal direction and observed the retardation or transmission variation with time. The experimental details are explained in ref. 25. First, as a reference, we show the EO response of typical bent nematics by using OCO4. Fig. 3(a)–(c) shows the Freedericksz transition from the initial planar state to a tilted state under a 20 Vpp square-wave electric field. Like normal nematics, the switching process finishes in 200 ms. Fig. 3(d)–(l) illustrates the EO response behavior of the optical textures of COO2. In the high temperature region (75 °C) of the N phase, the typical Freedericksz transition was observed (Fig. 3(d)–(f)), which is similar as that in OCO4. Therein, the field-induced orientational change is a first-order-like structural transition based on the dielectric interaction between LCs and the electric field.3 However, the decreasing temperature made the time evolution of the optical textures in COO2 abnormal and distinct from the traditional behavior. Fig. 3(g)–(i) demonstrates the switch-on process, which consists of three ultraslow steps. First, the director starts to reorient toward the electric field due to the Freedericksz transition (Fig. 3(g) and (h)). Second, after a slight tilting in the bulk, the texture develops from the uniformly-tilted state to a stripe state (Fig. 3(i) and (j)) that runs perpendicular to the rubbing direction. The stripe pattern nucleates from the uniform background and grows very slowly taking about several tens to thousands of seconds depending on temperature. Third, the stripe state is not stable and relaxes to the final equilibrium uniformly tilted state (Fig. 3(j)–(l)). For traditional nematics, the reorientational route takes only the first and third steps, as exemplified by OCO4 (Fig. 3(a)–(c)). To characterize the structure of the stripes, we analyzed the PLM images. Fig. 3(m) and (n) shows the microscopy images without the analyzer. The stripes were set perpendicular (Fig. 3(m)) or parallel (Fig. 3(n)) to the polarizer on the incident side before the sample. Although the contrast of the stripes is the highest when the stripes are perpendicular to the polarizer (Fig. 3(m)), the stripes become almost invisible when the sample is rotated by 90° (Fig. 3(n)). This situation is the same with that in the so-called Williams domains appearing as the well-known EHC pattern.32 Remember that the incident polarization probes the refractive property in the incident plane comprising the polarization and propagation wave vector. Therefore, the observed angle-dependent contrast means that, while the refractive index n is invariant along the direction perpendicular to rubbing (so parallel to stripes), n modulates along the rubbing direction. Furthermore, since the stripes extinct under crossed polarizers when the stripes are put parallel to a polarizer or analyzer, the modulation of n along the rubbing direction is due to the variation of the polar angle. The PLM analyses lead us to the conclusion that the stripe pattern corresponds to the Williams domain-like structure.
Worth noting, the William domain-like structure (i.e., the stripes) is absent in the N phase of COOn with n ≥ 4.25 To understand how this unique process arises only in COO2, we studied the dielectric anisotropy Δε of COO2. We prepared a 5 μm planar LC cell and monitored the voltage dependence of the dielectric permittivity under the PLM observation. Because of the ultraslow reorientational process of COO2, we waited for a long time during the measurement at each step to increase the voltage. Fig. 4 summarizes the full time evolution of PLM images during the unique switching-on and switching-off processes in COO2. For the switching-on process, similar to the observation in Fig. 3(g)–(l), the planar texture first goes into a tilt state through the Freedericksz transition, and then transits to a stripe state and eventually reaches to a uniform tilted state at the equilibrium. The switching-off process is not merely a symmetric process. Upon removing the electric field, the director field retracts from the uniform tilted state to its original state without the formation of stripes. To give a convincible relationship between the material parameters and the reorientational process, let us summarize the characteristics of the stripes and COO2 material: (1) Δε of COO2 is positive; (2) stripes run perpendicular to the rubbing direction; (3) the wavelength of the stripes relies on the thickness, d, of samples and exhibits the similar length order of d; (4) the Freedericksz transition occurs before the stripe pattern appears in the planar cell; and (5) the director cannot follow a high-frequency electric field, e.g., 1000 Hz square waves. According to the well-studied standard and nonstandard EHC phenomena in the planar cell geometry used here, there are only four possibilities of material parameter combinations where the stripe (roll) instability can occur:33,34 (A) Δε < 0 and Δσ > 0 (Δσ is the anisotropy of conductivity); (B) Δε > 0 and Δσ < 0; (C) Δε > 0 and Δσ > 0; and (D) Δε < 0 and Δσ < 0. The cases (A) and (D) are immediately excluded because Δε > 0 in the present case. In case (B), the stripes are known to be parallel to the rubbing direction. As a result, only case (C) can well explain the experimental observation with no contradiction. Therefore, the observed ultraslow-varying stripe state is attributed to the transient EHC.
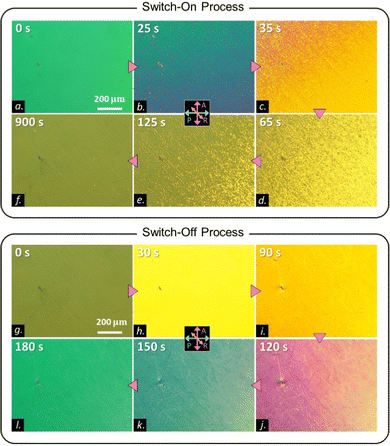 | ||
| Fig. 4 (a)–(f) PLM images showing switch-on processes in a 5 μm antiparallel-rubbing cell of COO2 at 65 °C. The switch-on processes are the same to those shown in Fig. 3(g)–(l) with the same applied field. PLM images (g)–(l) showing switch-off processes in a 5 μm antiparallel-rubbing cell of COO2 at 65 °C. | ||
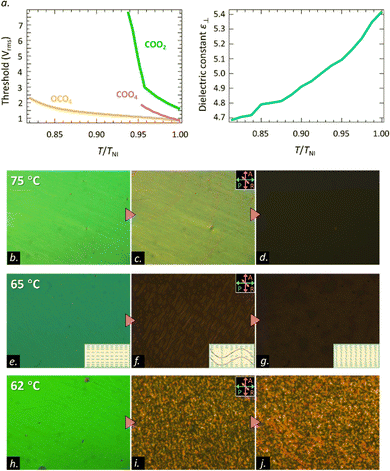
The threshold behavior of the Freedericksz transition of COO2 is also highly different from that in traditional nematics. Fig. 5(a) shows the temperature dependence of the threshold voltage for COOm (m = 2 and 4) and OCO4. OCO4 exhibits the typical nematic behavior, where the threshold for reorientation is about 1.4 Vrms right below the Iso-N phase transition at 145 °C (T/TIN ∼ 1) and increases up to about 3.5 Vrms at 120 °C (T/TIN ∼ 0.8). COO4 shows a bit higher Vrms than OCO4. Notable, the magnitude and the variation rate of the threshold for COO2 are significantly higher than those of traditional nematics. At the highest temperature of the N phase, the threshold is about 2.1 Vrms. Decreasing the temperature by just 5 °C (T/TIN = 0.94) results in the threshold going up to 9.9 Vrms. Such a behavior can be attributed to either a decrease in the magnitude of Δε or an increase in the elastic modulus.
This result prompts us to investigate the dielectric constant behavior. The dielectric constant along the short axis ε⊥ behaves analogous to that of the traditional electro-positive material. The magnitude of ε⊥ decreases as the temperature decreases (Fig. 5(b)). The dielectric constant ε for COO2 increases along with the traditional Freedericksz transition at 75 °C (T/TIN = 0.99) from an initial planar state to a final homeotropic state as shown in Fig. 5(b)–(d). However, as the temperature decreases by 10 °C, the ε for COO2 increases from 5.6 (planar state) to 5.85 (wavy state), which is demonstrated in Fig. 5(e)–(g). The variation of the dielectric constant is consistent with the model of the transient EHC discussed above. Owing to its electro-positivity, the directors reorient toward the electric field. During this process, the electrical torque prevails over Carr–Helfrich torque resulting in the Freedericksz transition. As the tilt-angle of the director increases, the stabilization effect of the Carr–Helfrich35 further increases leading to the stripe formation. A rough sketch of the wavy structure is shown in the inset of Fig. 5(f). Nevertheless, the stripe is in a metastable state and eliminated by applying the dielectric stabilizing torque. The time-dependence of the dielectric constant at 62 °C is similar to that at 65 °C but the stripe state at 62 °C is stable and retains stability for a long time. The phenomenon is shown in Fig. 5(h)–(j).
In most bent-core materials, due to their negative Δε, standard or non-standard EHC phenomena can be observed36–38 while EHC can occur in certain systems with positive Δε.39 However, the bent-dimeric materials exhibit positive Δε as in the rod-shaped materials because their entire bent shape is formed with a central alkyl spacer. Thus, traditional Freedericksz transition is common in bent-dimeric materials. In our case, among COOn molecules, the bent-dimeric COO2 with a relatively rigid V shape due to a shorter alkyl chain likely behaves similar to the bent-core materials. In our previous study, COOn was shown to exhibit ultraslow switching dynamics. This lets us further expect that COO2 with more cluster packing tendency would show slower switching properties. For this purpose, we demonstrate ultraslow off-switching time in the N phase of COO2 and a high tunability of the off-switching time in an extremely wide range by mixing COO2 and OCO4 materials. Fig. 6(a) shows the phase diagram of their mixtures. We note that the NTB phase can be suppressed by the crystal state to a lower temperature as the weight percentage of COO2 increases. Fig. 6(b) shows the off-switching performance of the COO2, COO4 and their mixtures. In our previous study, we reported that COO4 can replace arbitrary traditional nematic materials for viscosity modulation up to 1000 times. Adding COO2 to OCO4 further dramatically elevates the off-switching time, which leads to the off-switching time modulation by 10![[thin space (1/6-em)]](https://www.rsc.org/images/entities/char_2009.gif) 000 times up to COO2. Notably, the high-contrast switching properties between COOm and OCOm indeed correspond to a ‘transition’ of the dynamic behavior between the bent-dimeric and bent-core materials. The short spacer COOm becomes bent-core like, while OCOm molecules stay bent-dimer like. The result strongly suggests the possibility for tuning LC switching time in an ultra-wide range with proper molecular design.
000 times up to COO2. Notably, the high-contrast switching properties between COOm and OCOm indeed correspond to a ‘transition’ of the dynamic behavior between the bent-dimeric and bent-core materials. The short spacer COOm becomes bent-core like, while OCOm molecules stay bent-dimer like. The result strongly suggests the possibility for tuning LC switching time in an ultra-wide range with proper molecular design.
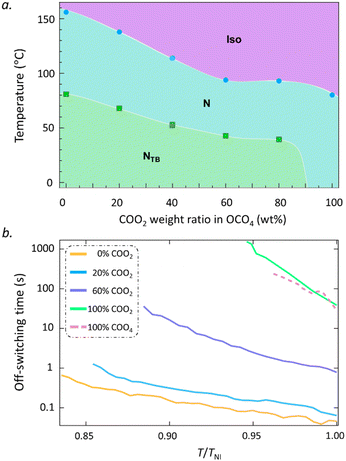 | ||
| Fig. 6 (a) Phase diagram of the COO2–OCO4 mixtures. (b) Temperature dependencies of the off-switching time for the COO2–OCO4 mixtures at different weight ratios of COO4. | ||
Conclusions
Summarizing, our studies have confirmed that the length of the alkyl chain spacers in bent-shaped dimers, hence the effective molecular flexibility and cluster formability, plays a crucial role in determining the macroscopic phase and dynamics behaviors in LC materials. Unprecedentedly, we reported an unidentified dynamics pathway in NLCs with a ‘static’ EHC process. Furthermore, the rotational viscosity (say the switching frequency) of the LC materials is significantly increased by 10![[thin space (1/6-em)]](https://www.rsc.org/images/entities/char_2009.gif) 000 times realized by short-spacer bent-dimer materials. The molecular design provides new insights into understanding the relationships between molecular features and LC viscoelasticity or switching processes. In particular, the results hint at the controllability of dynamics behaviors by adjusting molecular design and tuning LC materials bent-dimer or bent-core like. This provides us a chance for dramatically tuning the switching properties for the optimized usage.
000 times realized by short-spacer bent-dimer materials. The molecular design provides new insights into understanding the relationships between molecular features and LC viscoelasticity or switching processes. In particular, the results hint at the controllability of dynamics behaviors by adjusting molecular design and tuning LC materials bent-dimer or bent-core like. This provides us a chance for dramatically tuning the switching properties for the optimized usage.
Experimental
The molecular geometry is optimized by density functional theory calculation using the B3LYP/6-31g(d) basis set with Chembio3D Ultra 11.0 (CambridgeSoft). MD simulations were conducted using Gromacs 2021.04. The OPLS-AA force field was used. Each simulation box contains one LC molecule. To diminish the intramolecular attractions arising from the van der Waals interaction, we used a short cut-off of 0.5 nm for non-bonded interaction calculation. The trajectory was integrated with a stochastic dynamics integrator in the NVT ensemble for 100 ns. All analyses were made using the last 90 ns trajectory. All the optical measurements were made in home-made liquid crystal cells, whose thickness was controlled between 0.8 μm and 100 μm using glass beads or plastic films. We used a polarizing optical microscope (POM, BX53P, and BH2, Olympus) to characterize the textures of the samples. The elastic constant was measured by the Fréedericksz transition method. We measured the variation of both the capacitance and the transmitted light intensity under crossed polarizers upon sweeping the volage at 10 kHz by using planar cells. The electric field was applied perpendicular to the surface. The rotational viscosity was measured by using the phase-decay-time measurement method.Conflicts of interest
There are no conflicts to declare.Acknowledgements
S. A. acknowledges the National Key Research and Development Program of China (no. 2022YFA1405000), the GuangDong Basic and Applied Basic Research Foundation (no. 202102021156), the Recruitment Program of Guangdong (No. 2016ZT06C322) and the 111 Project (No. B18023). Y. A. acknowledges the financial support from JSPS KAKENHI grant number 20K15351.References
- Liquid crystals: materials design and self-assembly, ed. C. Tschierske, Springer, Berlin and Heidelberg, 2012 Search PubMed.
- Structure and Properties of Liquid Crystals, ed. L. M. Blinov, Springer, 2011 Search PubMed.
- The Physics of Liquid Crystals, ed. P. G. de Gennes and J. Prost, Clarendon Press, 1995 Search PubMed.
- C. Zhang, M. Gao, N. Diorio, W. Weissflog, U. Baumeister, S. Sprunt, J. T. Gleeson and A. Jakli, Phys. Rev. Lett., 2012, 109, 107802 CAS.
- N. Vaupotic, J. Szydlowska, M. Salamonczyk, A. Kovarova, J. Svoboda, M. Osipov, D. Pociecha and E. Gorecka, Phys. Rev. E: Stat., Nonlinear, Soft Matter Phys., 2009, 80, 030701 CrossRef CAS PubMed.
- O. Francescangeli and E. T. Samulski, Soft Matter, 2010, 6, 2413–2420 RSC.
- S. Chakraborty, J. T. Gleeson, A. Jakli and S. Sprunt, Soft Matter, 2013, 9, 1817–1824 RSC.
- H. F. Gleeson, S. Kaur, V. Görtz, A. Belaissaoui, S. Cowling and J. W. Goodby, ChemPhysChem, 2014, 15, 1251–1260 CrossRef CAS.
- C. Keith, A. Lehmann, U. Baumeister, M. Prehm and C. Tschierske, Soft Matter, 2010, 6, 1704–1721 RSC.
- A. Jákli, Liq. Cryst. Rev., 2013, 1, 65–82 CrossRef.
- S. Sircar, J. Li and Q. Wang, Commun. Math. Sci., 2010, 8, 697–720 CrossRef.
- S. Kaur, V. P. Panov, C. Greco, A. Ferrarini, V. Görtz, J. W. Goodby and H. F. Gleeson, Appl. Phys. Lett., 2014, 105, 223505 CrossRef.
- B.-X. Li, Y. A. Nastishin, H. Wang, M. Gao, S. Paladugu, R. Li, M. Fukuto, Q. Li, S. V. Shiyanovskii and O. D. Lavrentovich, Phys. Rev. Res., 2020, 2, 033371 CrossRef CAS.
- E. W. Lee, K. Takimoto, M. Tokita, J. Watanabe and S. Kang, Angew. Chem., Int. Ed., 2014, 53, 8216–8220 CrossRef CAS.
- S. M. Salili, M. G. Tamba, S. N. Sprunt, C. Welch, G. H. Mehl, A. Jakli and J. T. Gleeson, Phys. Rev. Lett., 2016, 116, 217801 CrossRef CAS PubMed.
- A. Zep, S. Aya, K. Aihara, K. Ema, D. Pociecha, K. Madrak, P. Bernatowicz, H. Takezoe and E. Gorecka, J. Mater. Chem. C, 2013, 1, 46–49 RSC.
- E. Dorjgotov, K. Fodor-Csorba, J. T. Gleeson, S. Sprunt and A. Jákli, Liq. Cryst., 2008, 35, 149–155 CrossRef CAS.
- P. Sathyanarayana, M. Mathew, Q. Li, V. S. Sastry, B. Kundu, K. V. Le, H. Takezoe and S. Dhara, Phys. Rev. E: Stat., Nonlinear, Soft Matter Phys., 2010, 81, 010702 CrossRef CAS PubMed.
- M. Majumdar, P. Salamon, A. Jákli, J. T. Gleeson and S. Sprunt, Phys. Rev. E: Stat., Nonlinear, Soft Matter Phys., 2011, 83, 031701 CrossRef CAS.
- P. Tadapatri, U. S. Hiremath, C. V. Yelamaggad and K. S. Krishnamurthy, J. Phys. Chem. B, 2010, 114, 1745–1750 CrossRef CAS.
- S. Kaur, J. Addis, C. Greco, A. Ferrarini, V. Görtz, J. W. Goodby and H. F. Gleeson, Phys. Rev. E: Stat., Nonlinear, Soft Matter Phys., 2012, 86, 041703 CrossRef CAS PubMed.
- P. Sathyanarayana, B. K. Sadashiva and S. Dhara, Soft Matter, 2011, 7, 8556–8560 RSC.
- R. Mandle, Molecules, 2022, 27, 2689 CrossRef CAS PubMed.
- V. Borshch, Y.-K. Kim, J. Xiang, M. Gao, A. Jákli, V. P. Panov, J. K. Vij, C. T. Imrie, M. G. Tamba, G. H. Mehl and O. D. Lavrentovich, Nat. Commun., 2013, 4, 2635 CrossRef CAS PubMed.
- W. Tang, M. Deng, J. Kougo, L. Ding, X. Zhao, Y. Arakawa, K. Komatsu, H. Tsuji and S. Aya, J. Mater. Chem. C, 2021, 9, 9990–9996 RSC.
- S. Chakraborty, M. K. Das and W. Weissflog, Eur. Phys. J. E: Soft Matter Biol. Phys., 2019, 42, 138 CAS.
- A. Chakraborty, M. K. Das, B. Das, A. Lehmann and C. Tschierske, Soft Matter, 2013, 9, 4273–4283 RSC.
- A. Patti, S. Belli, R. van Roij and M. Dijkstra, Soft Matter, 2011, 7, 3533–3545 RSC.
- Y. Arakawa, K. Komatsu, J. Feng, C. Zhu and H. Tsuji, Mater. Adv., 2021, 2, 261–272 RSC.
- A. A. Dawood, M. C. Grossel, G. R. Luckhurst, R. M. Richardson, B. A. Timimi, N. J. Wells and Y. Z. Yousif, Liq. Cryst., 2017, 44, 106–126 CAS.
- R. J. Mandle, C. T. Archbold, J. P. Sarju, J. L. Andrews and J. W. Goodby, Sci. Rep., 2016, 6, 36682 CrossRef PubMed.
- D. Krishnamurti and D. Revannasiddaiah, Mol. Cryst. Liq. Cryst., 1979, 55, 33–46 CrossRef CAS.
- A. Golovin and A. Nepomnyashchy, Self-Assembly, Pattern Formation and Growth Phenomena in Nano-Systems, Springer, 2006 Search PubMed.
- C. G. Jhun, G. J. Choi, D. G. Ryu, J.-H. Huh and J. S. Gwag, Phys. Rev. E, 2018, 98, 052704 CrossRef CAS.
- W. Helfrich, J. Chem. Phys., 1969, 51, 4092–4105 CrossRef CAS.
- S. Kaur, A. Belaissaoui, J. W. Goodby, V. Görtz and H. F. Gleeson, Phys. Rev. E: Stat., Nonlinear, Soft Matter Phys., 2011, 83, 041704 CrossRef CAS PubMed.
- P. Tadapatri, K. S. Krishnamurthy and W. Weissflog, Phys. Rev. E: Stat., Nonlinear, Soft Matter Phys., 2010, 82, 031706 CrossRef PubMed.
- S. Tanaka, H. Takezoe, N. Éber, K. Fodor-Csorba, A. Vajda and Á. Buka, Phys. Rev. E: Stat., Nonlinear, Soft Matter Phys., 2009, 80, 021702 CrossRef PubMed.
- R. Stannarius and J. Heuer, Eur. Phys. J. E: Soft Matter Biol. Phys., 2007, 24, 27–33 CrossRef CAS PubMed.
Footnote |
| † Electronic supplementary information (ESI) available. See DOI: https://doi.org/10.1039/d2cp02407a |
| This journal is © the Owner Societies 2023 |

