DFT study of hydrogen interaction with transition metal doped graphene for efficient hydrogen storage: effect of d-orbital occupancy and Kubas interaction†
Karthick
Raja K.
,
T.
Anusuya
and
Vivek
Kumar
 *
*
Applied Nanomaterials and Energy Laboratory, Department of Physics, Indian Institute of Information Technology Design & Manufacturing Kancheepuram, Chennai-600127, India. E-mail: vivek@iiitdm.ac.in
First published on 24th November 2022
Abstract
Hydrogen adsorption on pristine graphene (PG), graphene with defect (GD), and transition metal (TM) (Ag, Au, Cu, and Fe) doped graphene is systematically investigated for potential hydrogen storage using density functional theory. The stability of the TM atom doped graphene has been analysed by studying the binding energy and the electron density distribution. The TM atom-doped GD shows better binding energy and electron density overlap than PG; therefore, the TM/GD system has been considered and analysed for hydrogen adsorption. The hydrogen adsorption property is studied by examining the adsorption energy, mode of H2, density of states (DOS), charge density difference, and Löwdin charges before and after adsorption to find a better TM/GD system for hydrogen storage. The Fe/GD system shows higher hydrogen adsorption energy and hydrogen in its stable Kubas mode. Furthermore, two to five H2 molecule adsorption and desorption is studied. The increase in the number of H2, which changes the DOS at the Fermi level, suggests that one can predict H2 concentration by measuring conductivity changes. The present work is focused on studying the interaction between H2 and TM/GD systems, which will help understand the basic adsorption mechanism for practical hydrogen storage.
1. Introduction
High consumption of fossil fuels results in the rapid depletion of natural resources and this creates environmental issues such as global warming. Science and technology accelerate towards sustainable and renewable energy sources such as hydrogen, solar, biomass, tidal, and geothermal energy.1–5 Among available renewable energy sources, hydrogen is an extensive energy source due to its higher energy density, environmentally friendly nature, and high abundance and can be produced in numerous ways.6,7 Conventionally hydrogen is stored in highly pressured tanks or by cryogenic cooling; this requires intense energy and leads to boil-off losses and requires a thick storage tank.8 For this reason, hydrogen storage in a solid-state material, based on chemisorption and physisorption, emerged as an alternative, which demands careful material selection with a large storage capacity. Different materials interact with hydrogen in a peculiar way with different adsorption energies. To achieve hydrogen storage at room temperature, the material with an adsorption energy of −0.2 eV to −0.6 eV is preferred for reversible usage.9 In the case of physisorption, hydrogen molecules interact with the material with very weak van der Waals forces, which generally happens in carbon-based materials, metal-organic frameworks, and zeolites. They can easily adsorb and desorb hydrogen due to their lower adsorption energy to the hydrogen and tend to have low storage capacity at room temperature.10 In the case of chemisorption, hydrogen molecules individually bind with materials as a hydrogen atom by a strong covalent bond with very high adsorption energy. This happens in metal hydrides that have high hydrogen storage capacity at room temperature, but they have slow adsorption, and they will desorb hydrogen only at certain conditions.11 Improving the material property for hydrogen storage applications is a vital challenge currently.Recently carbon-based materials like graphene, graphene oxide (GO), reduced graphene oxide (RGO), and graphene quantum dots have been studied for various applications in areas like supercapacitors,12 batteries,12 photovoltaics,13 and sensors14 due to their tunable electrical conductivity,15 structural property,16,17 good mechanical and thermal stability.18 These graphene-based materials have demonstrated an advantage in H2 storage due to their ultra-high surface area, and lower energy consumption for hydrogen uptake.19–21 The DFT approach is used to predict the hydrogen adsorption energy on pristine graphene (PG). The PG does not match the requirements for room temperature hydrogen storage since it is in the region of physisorption −0.01 to −0.09 eV.22,23 However, the modification of the graphene layer may help to improve the hydrogen storage capacity. Yadav et al. studied the topological defects’ role in hydrogen adsorption using DFT with the PBE-GGA and vdW-DF2 functionals. They explored hydrogen adsorption on five different types of point defects, and the single vacancy defect. They reported a H2 adsorption energy of −0.3 eV for the PBE-GGA functional and −0.4 eV for the vdW-DF2 functional.24 Zhou et al. investigated the characteristics of hydrogen adsorption on an alkali metal (Li) dispersed boron-doped graphene layer using DFT calculations. Li dispersed B-doped defective graphene binds up to 3H2 with adsorption energies ranging from −0.2 to −0.4 eV.25 Lee et al. decorated Ca on the zigzag graphene nanoribbon and used the GGA functional during the DFT calculation. The Ca decorated zigzag nanoribbon binds up to 6H2 molecules with a theoretical gravimetric capacity of ∼5 wt% hydrogen. Similarly, Amaniseyed et al. decorated Mg on graphene, which has hydrogen adsorption capacity up to 9H2 with an average adsorption energy of −0.13 eV per H2.26,27 Graphene Nano Flakes (GNF) doped with Cr have been investigated by Xiang et al. using the GGA-PBE functional used with the DFT-D correction. GNF doped with Cr exhibits high affinity for H2 with a chemical adsorption energy of −0.57 eV.28 Choudhary et al. have studied a Pd and Cu doped single vacancy graphene layer using DFT calculations. These systems have adsorption energies of −0.26 eV and −0.45 eV, respectively, which is ideal for hydrogen storage.9 Other transition metal atom dopants like Co, Pt, Ti, V, and Sc and heteroatom dopants like oxygen and nitrogen were also investigated by various groups with the help of the DFT approach.20,29–33
Experimentally, Tapas et al. prepared a Pd/RGO composite and achieved an H2 uptake capacity of 0.03 wt% for RGO and 0.25 wt% for Pd/RGO at 303 K.34 Mohammadreza et al. have studied the hydrogen uptake capacity at 0.05 to atmospheric pressure at 77 K for Pt and Fe doped RGO. The hydrogen adsorption capacity of GO improved from 1.2 to 2.1 wt% H2 for Pt and 1.9 wt% H2 for Fe doped RGO.35 Fe nanoclusters decorated on a graphene sheet by Sterlin et al. have a hydrogen uptake capacity of 2.17 wt% of H2 at 77 K and 50 bar pressure.36 Further, Feizi et al. used gold nanoparticles in zirconium oxide (ZrO2) and GO composite. The maximum hydrogen charge achieved by the electrochemical study was about 180 C g−1.37 Overall, most of the DFT works only discussed the adsorption energy of H2 on the modified system, and experimental work focuses on discussing the uptake capacity of H2. Still, the interaction between the TM dopant atoms and H2 is rarely studied and it is very important to understand these interactions fundamentally to design a better and efficient H2 storage system.
In the present work, we have studied the interaction mechanism of H2 with the dopant atom and the graphene layer. Analysing these interactions will help to design a system for efficient hydrogen storage. Here, a comprehensive study has been performed on the interaction and adsorption of H2 on PG, GD, and various TM/GD systems using first principles calculations. The different structures have been investigated to find the proper dopant atom in graphene for improving the adsorption of H2 to the ideal range. The projection of charges in t2g and eg orbitals after H2 adsorption is analysed, which will be helpful to understand the interaction of the TM atom (Ag, Au, Cu, and Fe) having completely filled and more than half filled d-orbitals with H2. Further, the system having better H2 adsorption energy has been studied, followed by the desorption of hydrogen using the van’t Hoff equation at various pressures. It is observed that as the adsorption of H2 molecules increases, the number of states at the Fermi level decreases, which leads to a change in the conductivity of the system. This will be helpful in predicting the concentration of H2 by the change in the conductivity in the practical aspect.
2. Calculation method
DFT calculations were performed using a plane wave basis set implemented in the Quantum Espresso software package.38 Generalized gradient approximation (GGA)39 with the Perdew–Burke–Ernzerhof (PBE) functional was taken to include the electron exchange-correlation interactions. To represent the interaction of the ionic core and valence electron, the Vanderbilt ultra-soft pseudopotential was used.40 The kinetic energy cutoff for charge density was set to 320 Ry (ecutrho), which is around eight times the kinetic energy cutoff of the wave function, which was set to 40 Ry (ecutwfc). The self-consistent field calculation convergence threshold was set to 1E-6 Ry to find the total energy of the system. The Methfessel-Paxton smearing was used,41 and the degauss values were fixed to 0.01. The force on each atom was relaxed to less than 1E-4 Ry/Bohr. The total energy of the system during the relaxation converged up to 1E-6Ry. Brillouin zone integration was conducted with the Monkhorst-Pack grid of 6 × 6 × 1 k point mesh.42 The distance between two layers is fixed at 10 Å to avoid the interaction between graphene layers. There was a non-local correlation effect in the system for which Quantum Espresso contains the van der Waals interaction functional (vdW-DF), but in our calculations, Kubas interaction dominates in TM, so the van der Waals force was negligible to confirm that this DFT-D3 correction is added to the GGA functional.9 All the optimized structures have been analysed using XCrySDen software.43 An optimized structure diagram and 3D charge density difference diagram were plotted using Vesta software.44A 3 × 3 graphene supercell, shown in Fig. 1(a), has been taken for the calculation, which contains a total of 18 carbon atoms and is called PG. A vacancy was created by removing a single atom from a 3 × 3 supercell that contains 17 carbon atoms, shown in Fig. 1(b), which is called GD. To calculate the density of states (DOS) and projected density of states (PDOS), a 30 × 30 × 1 Monkhorst-Pack grid of k-point mesh was considered. The calculated DOS of PG exactly matched with Freitas et al.45 VASP calculations, so this k-point grid was considered for all the systems during DOS calculations in Quantum Espresso.
The binding energy of TM atoms adsorbed on the PG and GD structure was calculated using the following equation:25
| Eb(TM) = [ETM/G − (EG + ETM)] | (1) |
| Eads(H2) = [EH2/TM/G − (ETM/G + EH2)] | (2) |
| Ea−ads(H2) = [EnH2/TM/G − (ETM/G + nEH2)]/n | (3) |
The charge density difference after TM atom doping in GD and after H2 adsorption on the TM/GD system was calculated using the following eqn (4) and (5), respectively.
| Δρ = ρTM/GD − ρGD − ρTM | (4) |
| Δρ = ρH2/TM/GD − ρTM/GD − ρH2 | (5) |
The DOS calculations for different systems result in different Fermi energy (correspond to the Fermi level) as given in Table S1, (ESI†). To compare/analyse these systems properly the Fermi level was shifted to zero (i.e., E − EF) in these systems so that the Fermi level is at zero for all the systems. The same procedure has been adopted after H2 adsorption in different systems (PG, GD, Ag/GD, Au/GD, Cu/GD, and Fe/GD).
For the practical hydrogen storage application, hydrogen desorption temperature has been calculated by the van’t Hoff equation.46
 | (6) |
3. Results and discussion
3.1. Optimization of PG and GD
Fig. 1(a) shows the optimized 3 × 3 graphene supercell to its minimum energy. The lattice constant of the 3 × 3 supercell is 7.437 Å. The calculated value of the C–C bond length is 1.42 Å [experimental – 1.42 Å] and the unit cell lattice constant is 2.464 Å [experimental – 2.46 Å]. These results are comparable to the experimental values.48 The GD was created by removing one atom from the PG layer, as shown in Fig. 1(b), and it was further optimized. When it comes to structural properties PG has a bond length of 1.42 Å. The C–C bond length in GD changes to 1.385–1.409 Å near the vacancy site. This is due to Jahn–Teller distortion, which leads to the reconstruction of two out of three dangling bonds and the formation of a five-membered and nine-membered ring.493.2. Binding energy of TM on PG and GD
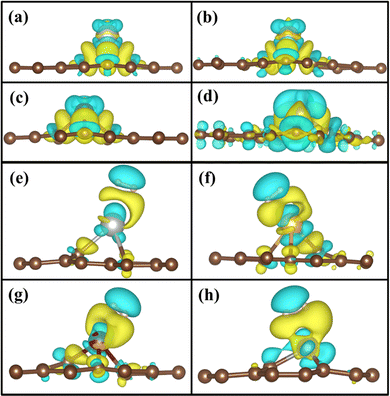
To understand the binding configuration of TM (Ag, Au, Cu, and Fe) on the PG and GD the binding energy of TM on the PG and GD layers has been investigated. The TM atom was substituted at the H6 site of PG and the centre site of GD, shown in Fig. 1. Further, the relaxation was performed to TM added systems using the Quantum Espresso relax command until force and energy meet the convergence conditions. Subsequently the binding energy calculations were performed. The calculated binding energy of Ag, Au, and Cu on the PG layer was −0.216 eV, −0.300 eV, and −0.520 eV, respectively, and the distance from the PG layer was 3.713 Å, 3.512 Å, and 2.095 Å, respectively. This less binding energy leads to the migration and clustering of Ag, Au, and Cu atoms. To understand the interaction further, the electron density distribution was simulated, shown in Fig. 2(a)–(c). It is found that the electron density is mainly distributed within the PG layer. There is no significant overlap between PG and TM (Ag, Au, and Cu); this confirms that there is no electron transfer between PG and TM. The reason behind weak interaction is due to completely filled d-orbitals in Ag, Au, and Cu and this leads to the downward shift of the d-orbital and less binding energy. These TM atoms migrate far from the PG layer, which is also visible in the electron density diagram in Fig. 2(a)–(c). This could also be the reason for TM atom clustering. Subsequently, for other sites of PG like B and T sites, Ag, Au and Cu have less binding energy. In contrast, the Fe atom substituted at the H6 site of PG binds at a distance of 1.532 Å, having a binding energy of −4.042 eV, which is higher than that of Ag, Cu, and Au. This binding energy is comparable to the Fe experimental cohesive energy −4.280 eV, as a crystal,50 which prevents the clustering problem. Also, in the case of the Fe atom, d-orbitals are not completely filled, and thus some of the unpaired electrons are present in the d-orbital; these electrons might be the reason for the Fe–PG interaction. This strong interaction of Fe with the PG layer is also confirmed by the overlap of electron density distribution in the Fe/PG system, as shown in Fig. 2(d), and due to this strong interaction, the binding energy also increases.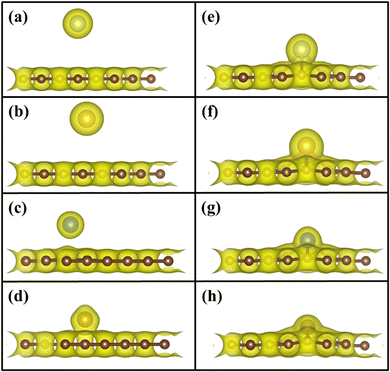 | ||
| Fig. 2 Electron density distribution of (a) Ag/PG, (b) Au/PG, (c) Cu/PG, (d) Fe/PG (e) Ag/GD, (f) Au/GD, (g) Cu/GD, and (h) Fe/GD. | ||
The migration and clustering of TM atoms on the PG layer can be overcome by creating a defect in the PG layer. The binding energy of TM atoms (Ag, Au, Cu, and Fe) with the GD layer has been simulated and analysed. TM atoms Ag, Au, and Cu doped on the GD layer have a binding energy of −1.917 eV, −2.554 eV, and −3.971 eV, respectively. The GD has more distinct localized orbitals (discussed later in Section 3.4), and thus more unshared charges are present that can easily interact with the TM atom compared to PG. This leads to an increase in the binding energy that is evident from the overlap of the electron density distribution of the TM atom with the GD layer, as shown in Fig. 2(e)–(h). In the case of Fe, the binding energy increases to −10.003 eV. It is evident that defects increase the interaction between the TM atom and the GD layer, which leads to an increase in the binding energy of the TM atom on the GD layer. The distances between the TM atom and GD surface and the bond length between TM and carbon are given in Table S2, ESI.†
3.3. Hydrogen adsorption on PG, GD and TM/GD
Adsorption behaviour of H2 molecules on the PG, GD, and TM/GD layer has been studied. Hydrogen adsorption energy has been calculated using eqn (2). The geometrically optimized structures after H2 adsorption are shown in Fig. 3(a)–(g). It is revealed that the hydrogen adsorption property of PG can be enhanced by incorporating a defect and further after TM atom doping. The single H2 molecule adsorption energy on the PG layer is −0.081 eV and the distance between H2 and PG layer is 3.114 Å. This hydrogen adsorption energy is less, so PG is not suitable for hydrogen adsorption. In the cases of Ag, Au, and Cu on the PG, TM atoms have less binding energy, which leads to the migration and clustering of TM atoms; thus, these systems are also not suitable for H2 adsorption. In the Fe/PG system when the H2 molecule is introduced, the H–H bonds are formed with Fe (H–H distance is 1.591 Å), shown in Fig. 3(c); this confirms the formation of dissociated dihydride.9 This bond formation is due to the donation of σ from the H–H σ bonding orbital to the Fe d orbital and subsequently π back donation from the Fe d orbital to σ* antibonding vacant orbital of the hydrogen molecule. The adsorption energy of H2 on the Fe/PG surface is −0.196 eV, which is less for practical hydrogen storage applications. After incorporating a defect on PG, the distance between H2 and GD is 3.037 Å and H2 adsorption energy is −0.103 eV, which is also less for practical hydrogen storage applications.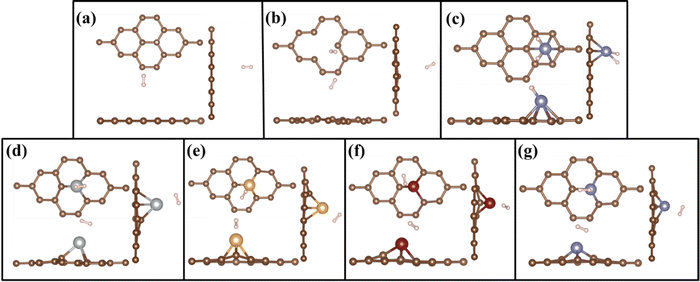 | ||
| Fig. 3 Top and side views of geometrically optimized structures of H2 adsorbed on (a) PG, (b) GD, (c) Fe/PG, (d) Ag/GD, (e) Au/GD, (f) Cu/GD, and (g) Fe/GD. | ||
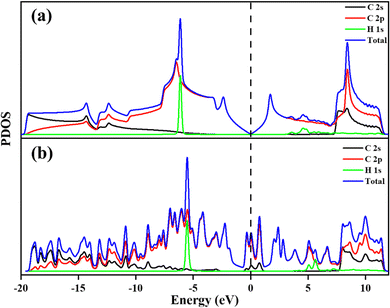
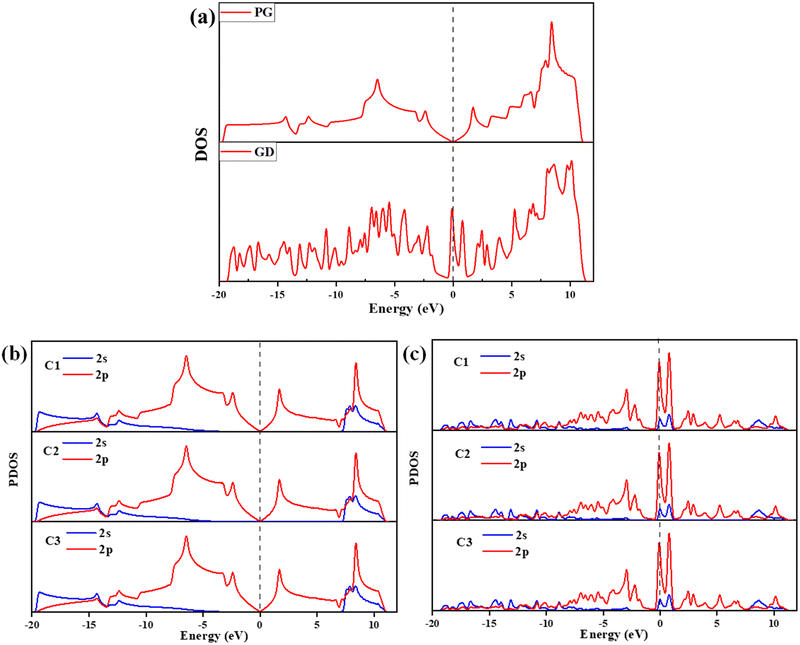 | ||
| Fig. 4 (a) DOS of PG and GD, (b) PG – C1, C2, and C3 atoms’ 2s and 2p orbital contribution to the PDOS and (c) GD – C1, C2, and C3 atoms’ 2s and 2p orbital contribution to the PDOS. | ||
When H2 is introduced in the TM/GD system the results show that the adsorption energy increases to the ideal hydrogen storage range; all values are given in Table 1. The absorption energy of H2 on the Ag/GD system shown in Fig. 3(d) is −0.405 eV and the distance between Ag and H2 is 2.005 Å. In the Au/GD system shown in Fig. 3(e), the H2 adsorption energy is −0.341 eV, and the distance between Au and H2 is 1.803 Å. In the Cu/GD system shown in Fig. 3(f), H2 adsorption energy is −0.282 eV with an H2–Cu distance of 1.741 Å. The Fe/GD system shown in Fig. 3(g) has a H2 adsorption energy of −0.580 eV, highest compared to other systems, and the Fe–H2 distance is also less nearly 1.293Å. Moreover, in these systems, the H–H bond length is in the range of 0.792–0.843 Å, which is slightly higher compared to isolated H2 molecules. But this increase in bond length does not mean that the H2 molecule is dissociated since up to 0.9 Å H2 is stable in its molecular form and this mode is called Kubas mode or K-Mode. The distance between H–H above 1.6 Å is called dihydride or D-Mode and at this hydrogen bond breaking happens. This kind of D-Mode is observed in Fe/PG whether K-Mode is observed in the Fe/GD system. These modes affect the hydrogen storage capacity for the practical hydrogen storage application.51
| System | E ads (eV) | D TM–C (Å) | D Layer–TM (Å) | d H–H (Å) | d TM–H2 (Å) | d Layer-H2 (Å) |
|---|---|---|---|---|---|---|
| PG | −0.081 | — | — | 0.756 | — | 3.114 |
| GD | −0.103 | — | — | 0.757 | — | 3.037 |
| PG/Fe | −0.196 | 2.040 | 1.576 | 1.591 | 1.510 | 2.578 |
| GD/Ag | −0.405 | 2.153 | 1.407 | 0.792 | 2.005 | 3.136 |
| GD/Au | −0.341 | 2.046 | 1.262 | 0.854 | 1.803 | 3.262 |
| GD/Cu | −0.282 | 1.874 | 0.878 | 0.812 | 1.741 | 2.918 |
| GD/Fe | −0.580 | 1.750 | 0.964 | 0.843 | 1.293 | 2.293 |
To further understand the role of van der Waals interactions in the absorption of hydrogen, the DFT-D3 correction was included to the GGA-PBE functional. The change in adsorption energy after the inclusion of the DFT-D3 correction is given in Table S3, ESI.† Compared with the GGA-PBE functional, the difference in adsorption energy is very less. The hydrogen adsorption energy ranges from −0.282 eV for the Cu/GD system to −0.580 eV for the Fe/GD system without the DFT-D3 correction. After including the DFT-D3 correction the change in adsorption energy is −0.02 eV to −0.001 eV, which is not very significant. This indicates that for graphene doped with the TM atom, the vdW correction does not have a significant impact during hydrogen adsorption and thus the Kubas interaction between the TM and H2 is assumed to be playing a prominent role.
3.4. Electronic properties
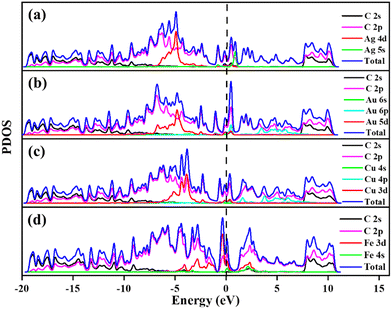
The calculated PDOS of GD doped with Ag, Au, Cu, and Fe is shown in Fig. 5. In the cases of Ag, Au and Cu total DOS shows the same metallic behaviour as GD. The PDOS shows that the Ag 5s orbital and Au 6s and 6p orbitals overlap with the 2p orbital of carbon atoms close to the Fermi level as shown in Fig. 5(a) and (b). The Cu 3d orbital overlaps with the carbon 2p orbital below the Fermi level, shown in Fig. 5(c). In the case of Fe, as shown in Fig. 5(d), the Fe 3d orbital strongly overlaps with the 2s and 2p orbitals of GD; due to this strong covalent bonding it does not behave as a metal. This kind of overlap happened in the orbitals of TM and GD at the Fermi level and near the Fermi level, leading to an increase in the binding energy of TM on the GD system.53
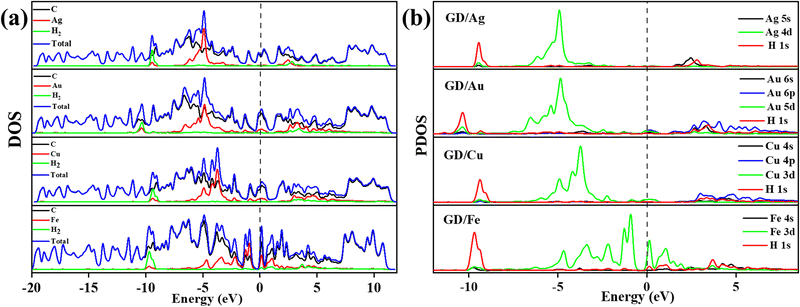 | ||
| Fig. 7 (a) Different atom contribution to the DOS of Ag/GD, Au/GD, Cu/GD, and Fe/GD systems after H2 adsorption and (b) PDOS of Ag/GD, Au/GD, Cu/GD, and Fe/GD systems after H2 adsorption. | ||
Electronic properties after H2 adsorption on Ag/GD, Au/GD, Cu/GD, and Fe/GD have been calculated and investigated by analysing PDOS shown in Fig. 7. Contribution of a different atom to the total DOS is displayed in Fig. 7(a). Fig. 7(b) shows the PDOS of Ag/GD, Au/GD, Cu/GD, and Fe/GD systems after H2 adsorption. It is observed that the H 1s orbital of H2 is located far below the Fermi level in the case of the Ag/GD system. The hydrogen molecule H 1s orbital overlaps with the Ag 4d orbital far below the Fermi level and Ag 5s orbital above the Fermi level. In the Au/GD system the H 1s orbital overlaps with the Au 5d orbital far below the Fermi level and the Au 6s and 6p orbitals above the Fermi level. In the case of the Cu/GD system the H 1s orbital overlaps with the Cu 3d orbital far below the Fermi level and Cu 4s and 4p orbitals above the Fermi level. In the Fe/GD system the H 1s orbital overlaps with the Fe 3d orbital far below the Fermi level and near to the Fermi level because the Fe 3d orbital is spread over the Fermi level. This type of interaction of the σ orbital of the hydrogen molecule with the d orbital of transition metals is known as Kubas type interaction. The H2 molecule binds with the system due to this Kubas-type interaction.
3.5. Charge density difference
Fig. 8(a)–(d) shows the charge density after doping of TM atoms in the GD. The doping of TM atoms on the GD surface leads to the formation of a charge depletion region on the top of the TM atom and H2 may interact with the TM in this charge depletion region. Fig. 8(e)–(h) shows the calculated 3D charge density difference plot of Ag/GD, Au/GD, Cu/GD, and Fe/GD systems after the H2 molecule adsorption. There is a redistribution of charge after H2 adsorption. The yellow region between TM and the H2 molecule indicates the charge accumulation that indicates the strong interaction between TM and H2. When H2 comes closer to the TM atom, charge accumulation happens, which corresponds to the σ orbital of the H2 molecule; on the other side of H2, there is a charge depletion or loss of charge, which corresponds to the σ* orbital of the H2 molecule. The interaction due to accumulation and depletion means that the charge transfer happens between TM/GD systems and H2. This charge transfer is the reason for the increase of adsorption energy between them. This is further discussed and quantitatively estimated by Löwdin charge analysis in Section 3.6. In the case of the Fe/GD system, Fig. 8(h), the charge transfer only happens between the Fe and H2 molecule; that is, no charge depletion or accumulation is happening in carbon atoms, while in other systems the charge redistribution is observed in the carbon atoms as well, Fig. 8(e)–(g).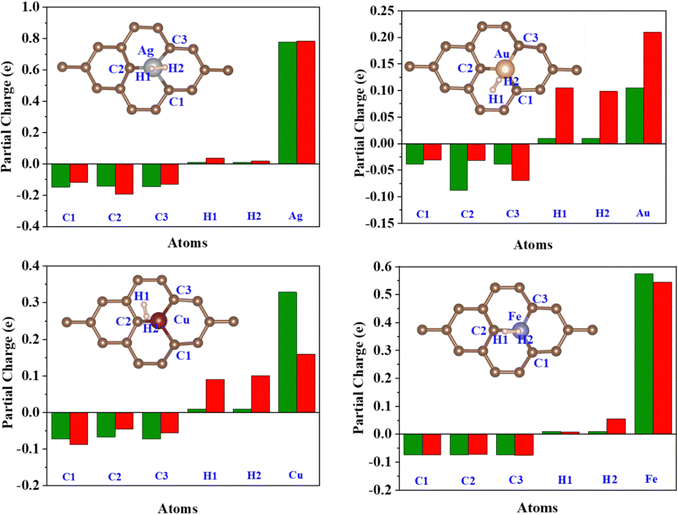 | ||
| Fig. 9 Löwdin partial charge on the C1, C2, C3, H1, H2, and TM atoms before (Green) and after (Red) H2 adsorption. | ||
3.6. Löwdin charge analysis
Löwdin charge analysis has been done on the system after H2 adsorption. In Fig. 9, the green bars show the partial charges on the C1, C2, C3, TM, H1, and H2 atoms before H2 adsorption and the red bars show a partial charge on these atoms after H2 adsorption. The values are summarized in Table S4, ESI.† It is found that the charge redistribution happens in every system after the H2 adsorption. In the Fe/GD system, there is less charge transfer to C1, C2, and C3 atoms compared to other systems after H2 adsorption. Charge transfer happens only between Fe and H2, which is also seen in charge density difference calculations shown in Fig. 8(h). Further, the d-orbital projection of Löwdin charges and polarization of TM atoms are analysed and different values are given in Table 2 (individual TM atoms and all the s, p, and d orbital projection of Löwdin charges are given in Table S5, ESI†). Total Löwdin charges assigned to the atomic site did not give a clear insight into the adsorption. So, the d-orbital projection of Löwdin charges has been analysed for every TM atom, which provides some insight into adsorption. The analysis of the d-orbital occupancy of TM shows that there is a significant increase in d-orbital occupancy for every TM. In the case of Ag, it is from 9.690 to 9.723, for Au it is from 9.392 to 9.425 and for Cu it is from 9.494 to 9.531; this is due to an increase in t2g orbital occupancy. But in the case of minority eg, orbital occupancy decreases for these three TM atoms. In the Fe-doped GD system, there is an increase in d orbital occupancy from 7.063 to 7.107, which is higher compared to Ag, Au, and Cu, while in the Fe atom minority eg orbital occupancy increases from 2.765 to 2.778 after H2 adsorption; this may be the reason for the reduction in the polarization of the Fe atom after H2 adsorption.54 The d-orbital (t2g and eg) occupancy and polarization of the TM atom before and after H2 adsorption are given in Table 2.| System | TM | Spin | t 2g (dxy, dxz, dyz) | e g (dz2, dx2–dy2) | Polarization | |||
|---|---|---|---|---|---|---|---|---|
| Before H2 adsorption | After H2 adsorption | Before H2 adsorption | After H2 adsorption | Before H2 adsorption | After H2 adsorption | |||
| Ag/GD | Ag | ↑ | 2.863 | 2.893 | 1.982 | 1.973 | 0.0013 | 0.0043 |
| ↓ | 2.862 | 2.886 | 1.982 | 1.973 | ||||
| Au/GD | Au | ↑ | 2.737 | 2.788 | 1.959 | 1.931 | 0.0044 | 0.0258 |
| ↓ | 2.736 | 2.777 | 1.959 | 1.930 | ||||
| Cu/GD | Cu | ↑ | 2.792 | 2.821 | 1.956 | 1.947 | 0.0016 | 0.0117 |
| ↓ | 2.791 | 2.817 | 1.956 | 1.946 | ||||
| Fe/GD | Fe | ↑ | 2.151 | 2.167 | 1.424 | 1.396 | 0.1022 | 0.0185 |
| ↓ | 2.148 | 2.162 | 1.341 | 1.382 | ||||
The better adsorption of H2 in the TM/GD system can be further understood by polarisation. The resultant polarization change on the TM atom after H2 adsorption will cause the change in charge density between the TM atom and H2, shown in Fig. 8. The value of polarization (given in Table 2) is higher for Fe cations, which will cause more charge transfer from the H2 molecule to the valence orbital of the Fe cation compared to other TM atoms. This is also confirmed by the increase in the Fe d orbital occupancy and partial charge on Fe after H2 adsorption. This kind of charge transfer confirms that the H2 molecule is chemisorbed in the system and increases the adsorption energy of H2 on the Fe/GD system. The chemisorbed H2 molecules can be reversibly desorbed from the system, which has been discussed later in Section 3.8.
3.7. Adsorption of additional H2 on the Fe/GD surface
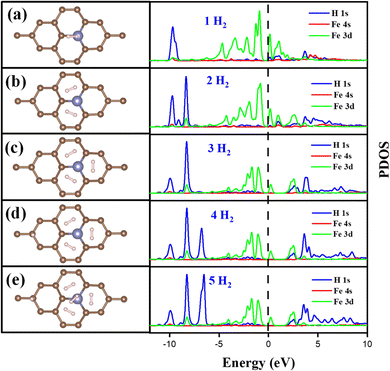
The Fe/GD system shows higher hydrogen adsorption energy and hydrogen in its stable Kubas mode. Further, the subsequent addition of H2 molecules to the Fe/GD system has been studied and average adsorption energy up to 5H2 was calculated. The optimized structure and PDOS are shown in Fig. 10(a)–(e). It is found that as the number of H2 molecules increases in the Fe/GD system the total adsorption energy of the H2 molecules also increases; values are given in Table S6, ESI.† This increase in total adsorption energy is due to H2–H2 interaction. The PDOS shows that as the number of H2 molecules increases the H 1s peak splitting happens; this is also due to H2–H2 interaction as shown in Fig. 10. The adsorption energy per H2 molecule has been calculated and is shown in Fig. 11. A five H2 molecule adsorbed system has an average adsorption energy of −0.184 eV per H2. The H–H bond distance is given in Table S6, ESI.† The average H–H bond distance depicts that the H2 molecules are non-dissociative or in their molecular form (K-Mode) in the Fe/GD system. Further, the subsequent addition of H2 may lead to van der Waals force contribution so the DFT-D3 correction was also added. The calculated values of adsorption energy after adding the DFT-D3 correction are shown in Table S3, ESI.† The difference in the adsorption energy after incorporating the correction is very less. This indicates that the van der Waals force does not have a significant impact in the Fe/GD system and thus the Kubas interaction is assumed to be playing a dominant role.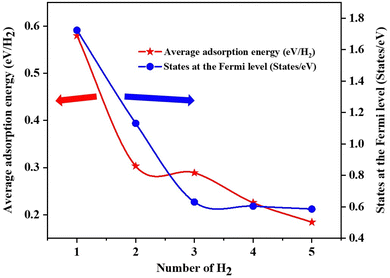 | ||
| Fig. 11 Average adsorption energy (eV per H2) and states at the Fermi level while increasing the number of H2 in the Fe/GD system. | ||
The conductivity of any system can be defined as the number of the states present at the Fermi level.55 Here, the DOS of the Fe/GD system decreases at the Fermi level as the number of H2 molecules increases, shown in Fig. 11. Thus, the conductivity decreases as the number of H2 molecules increases. Therefore, the concentration of H2 molecules in the Fe/GD system can be found by measuring the conductivity of the system. This can be used for practical application.
3.8. Desorption temperature
Adsorption of H2 on the TM/GD systems has been discussed above; it is found that Fe/GD systems have higher H2 adsorption energy in comparison to other systems. Now for the practical application, the uptake, and release of H2 are important. So further, the desorption property of the Fe/GD system after 1H2 to 5H2 adsorptions at different pressures has been studied. Desorption temperature can be calculated from the van’t Hoff equation (eqn (6)). Fig. 12 shows the desorption temperature for every H2 molecule up to 5H2 and values are given in Table S7, ESI.† This desorption temperature ranges from 740 K for the last hydrogen molecule desorption (first adsorbed to the system) to 235 K for the first hydrogen molecule desorption (last adsorbed to the system) at 1 atm pressure. It is clear that this Fe/GD material is an ideal reversible hydrogen storage material above 235 K.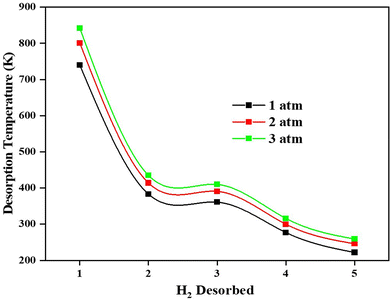 | ||
| Fig. 12 Desorption temperature of first adsorbed (No. 1) to last adsorbed (No 5) H2 in the Fe/GD system at different pressures. | ||
These findings can explain the experimental observations which have been reported on the Fe-decorated graphene systems for better hydrogen adsorption. In Mohammadreza et al. work Pt and Fe nanoparticles were loaded into RGO. Hydrogen uptake capacity at 77 K at atmospheric pressure has been examined. It is found that GO has 1.3 wt% and Pt/RGO has 2.1 wt% and Fe/RGO has 1.9 wt% uptake capacity of hydrogen at 77 K. Fe noticeably shows comparable uptake capacity like the Pt loaded system.35 Sterlin et al. reported graphene sheets decorated with Fe nanoclusters (Fe/GS), which were fabricated using arc reactors, and Fe/GS showed a hydrogen uptake capacity of 2.16 wt% at 77 K and 0.27 wt% at 300 K at 50 bar pressure.36 These experimental works show that Fe plays an effective role during hydrogen adsorption, so it is important to study the interaction during the uptake. Our results provide a reliable prediction on how the interaction may happen between Fe/graphene and H2; this is helpful to design materials with a very high hydrogen uptake capacity.
4. Conclusion
The first principles calculations have been performed to investigate the H2 adsorption property of PG, GD, TM-doped PG, and GD systems for hydrogen storage. The H2 adsorption energy for PG and GD systems is less, which ranges from −0.081 eV to −0.103 eV. To overcome this problem different TM/PG, and GD systems are further analysed. The calculated results show that the TM atoms doped on the GD have larger binding energy compared to PG. TM/GD systems have adsorption energy for single H2 molecules ranging from −0.281 eV to −0.579 eV. The Fe/GD system exhibits a high adsorption behaviour to the H2 molecule with chemical adsorption of −0.579 eV. In this system, H2 is in a Kubas mode (K-Mode) as a stable H2 complex without any dissociation into dihydride (D-Mode). Furthermore, t2g and eg projection of charges in the d-orbital of TM was studied. It is found that the increase in eg leads to a decrease in the polarization of the Fe atom in the Fe/GD system after H2 adsorption. This is the reason for the higher adsorption energy of H2 on the Fe/GD system. The calculated results show that in the Fe/GD system, the average adsorption energy of five H2 molecules is −0.1841 eV, and the last adsorbed H2 molecule desorbed at 235 K, 254 K, and 267 K at 1, 2, and 3 atmospheric pressure, respectively. The concentration of H2 molecules in the Fe/GD system can be found by measuring the conductivity of the system. This can be useful for practical application. It is concluded that the interaction of H2 on the Fe/GD is due to chemisorption and this chemisorbed H2 in its K-Mode can be reversibly desorbed from the system as a stable H2 complex. The present work will be helpful to understand the basic adsorption mechanism for practical hydrogen storage.Author contributions
Methodology, conceptualization, formal analysis, visualization, investigation, data curation, and writing – original draft. T. Anusuya: validation, formal analysis, and investigation. Vivek Kumar: conceptualization, supervision, visualization, validation, project administration, and writing – review & editing.Conflicts of interest
There are no conflicts to declare.Acknowledgements
The author KRK acknowledges the financial support from the Ministry of Education, India.References
- M. Yue, H. Lambert, E. Pahon, R. Roche, S. Jemei and D. Hissel, Hydrogen energy systems: A critical review of technologies, applications, trends and challenges, Renewable Sustainable Energy Rev., 2021, 146, 111180 CrossRef.
- L. Phillips, in Managing Global Warming, ed. T. M. Letcher, Academic Press, 2019, pp. 317–332 Search PubMed.
- W. V. Reid, M. K. Ali and C. B. Field, The future of bioenergy, Global Change Biol., 2020, 26, 274–286 CrossRef PubMed.
- A. Uihlein and D. Magagna, Wave and tidal current energy – A review of the current state of research beyond technology, Renewable Sustainable Energy Rev., 2016, 58, 1070–1081 Search PubMed.
- S. S. Salazar, Y. Muñoz and A. Ospino, Analysis of geothermal energy as an alternative source for electricity in Colombia, Geotherm. Energy, 2017, 5, 27 CrossRef.
- K. T. Møller, T. R. Jensen, E. Akiba and H.-W. Lib, Hydrogen – A sustainable energy carrier, Prog. Nat. Sci.: Mater. Int., 2017, 27, 34–40 CrossRef.
- N. P. Brandon and Z. Kurban, Clean energy and the hydrogen economy, Philos. Trans. R. Soc., A, 2017, 375, 20160400 CrossRef.
- D. J. Durbin and C. Malardier-Jugroot, Review of hydrogen storage techniques for on board vehicle applications, Int. J. Hydrogen Energy, 2013, 38, 14595–14617 CrossRef CAS.
- A. Choudhary, L. Malakkal, R. K. Siripurapu, B. Szpunar and J. Szpunar, First principles calculations of hydrogen storage on Cu and Pd-decorated graphene, Int. J. Hydrogen Energy, 2016, 41, 17652–17656 CrossRef CAS.
- P. Bénard and R. Chahine, Storage of hydrogen by physisorption on carbon and nanostructured materials, Scr. Mater., 2007, 56, 803–808 CrossRef.
- V. Bérubé, G. Radtke, M. Dresselhaus and G. Chen, Size effects on the hydrogen storage properties of nanostructured metal hydrides: A review, Int. J. Energy Res., 2007, 31, 637–663 CrossRef.
- M. F. El-Kady, Y. Shao and R. B. Kaner, Graphene for batteries, supercapacitors and beyond, Nat. Rev. Mater., 2016, 1, 1–14 Search PubMed.
- D. W. Chang, H.-J. Choi, A. Filer and J.-B. Baek, Graphene in photovoltaic applications: organic photovoltaic cells (OPVs) and dye-sensitized solar cells (DSSCs), J. Mater. Chem. A, 2014, 2, 12136–12149 RSC.
- T. Anusuya, V. Kumar and V. Kumar, Hydrophilic graphene quantum dots as turn-off fluorescent nanoprobes for toxic heavy metal ions detection in aqueous media, Chemosphere, 2021, 282, 131019 CrossRef CAS.
- T. Anusuya, D. Prema and V. Kumar, Reduction-controlled electrical conductivity of large area graphene oxide channel, J. Mater. Sci.: Mater. Electron., 2022, 33, 8935–8945 CrossRef CAS.
- T. Anusuya, J. Prakash, D. K. Pathak, K. Saxena, R. Kumar and V. Kumar, Porous graphene network from graphene oxide: Facile self-assembly and temperature dependent structural evolution, Mater. Today Commun., 2021, 26, 101930 CrossRef.
- T. Anusuya, D. K. Pathak, R. Kumar and V. Kumar, Deconvolution and quantification of defect types from the first order Raman spectra of graphene oxide derivatives, FlatChem, 2022, 35, 100422 CrossRef CAS.
- A. E. Galashev and O. R. Rakhmanova, Mechanical and thermal stability of graphene and graphene-based materials, Phys.-Usp., 2014, 57, 970 CrossRef CAS.
- V. Tozzini and V. Pellegrini, Prospects for hydrogen storage in graphene, Phys. Chem. Chem. Phys., 2012, 15, 80–89 RSC.
- X. Liang, S.-P. Ng, N. Ding and C.-M. L. Wu, Strain-induced switch for hydrogen storage in cobalt-decorated nitrogen-doped graphene, Appl. Surf. Sci., 2019, 473, 174–181 CrossRef CAS.
- Q. Zhou, C. Wang, Z. Fu, L. Yuan, X. Yang, Y. Tang and H. Zhang, Hydrogen adsorption on palladium anchored defected graphene with B-doping: A theoretical study, Int. J. Hydrogen Energy, 2015, 40, 2473–2483 CrossRef CAS.
- Y. Kwon, J. Kim, T. Kim, H. S. Shin and S. Kwon, Effect of bimodal surface modification of graphyne on enhanced H2 storage: Density functional theory study, AIP Adv., 2018, 8, 115034 CrossRef.
- S. Nachimuthu, P.-J. Lai and J.-C. Jiang, Efficient hydrogen storage in boron doped graphene decorated by transition metals – A first-principles study, Carbon, 2014, 73, 132–140 CrossRef CAS.
- S. Yadav, Z. Zhu and C. V. Singh, Defect engineering of graphene for effective hydrogen storage, Int. J. Hydrogen Energy, 2014, 39, 4981–4995 CrossRef CAS.
- Y. Zhou, W. Chu, F. Jing, J. Zheng, W. Sun and Y. Xue, Enhanced hydrogen storage on Li-doped defective graphene with B substitution: A DFT study, Appl. Surf. Sci., 2017, 410, 166–176 CrossRef CAS.
- H. Lee, J. Ihm, M. L. Cohen and S. G. Louie, Calcium-Decorated Graphene-Based Nanostructures for Hydrogen Storage, Nano Lett., 2010, 10, 793–798 CrossRef CAS PubMed.
- Z. Amaniseyed and Z. Tavangar, Hydrogen storage on uncharged and positively charged Mg-decorated graphene, Int. J. Hydrogen Energy, 2019, 44, 3803–3811 CrossRef CAS.
- C. Xiang, A. Li, S. Yang, Z. Lan, W. Xie, Y. Tang, H. Xu, Z. Wang and H. Gu, Enhanced hydrogen storage performance of graphene nanoflakes doped with Cr atoms: a DFT study, RSC Adv., 2019, 9, 25690–25696 RSC.
- L. Wang, K. Lee, Y.-Y. Sun, M. Lucking, Z. Chen, J. J. Zhao and S. B. Zhang, Graphene Oxide as an Ideal Substrate for Hydrogen Storage, ACS Nano, 2009, 3, 2995–3000 CrossRef CAS.
- S. Lamichhane, N. Pantha and N. P. Adhikari, Hydrogen storage on platinum decorated graphene: A first-principles study, BIBECHANA, 2014, 11, 113–122 CrossRef.
- S. Chu, L. Hu, X. Hu, M. Yang and J. Deng, Titanium-embedded graphene as high-capacity hydrogen-storage media, Int. J. Hydrogen Energy, 2011, 36, 12324–12328 CrossRef CAS.
- N. Pantha, A. Khaniya and N. P. Adhikari, Hydrogen storage on palladium adsorbed graphene: A density functional theory study, Int. J. Mod. Phys. B, 2015, 29, 1550143 CrossRef CAS.
- E. Durgun, S. Ciraci and T. Yildirim, Functionalization of carbon-based nanostructures with light transition-metal atoms for hydrogen storage, Phys. Rev. B: Condens. Matter Mater. Phys., 2008, 77, 085405 CrossRef.
- T. K. Das, S. Banerjee, M. Pandey, B. Vishwanadh, R. J. Kshirsagar and V. Sudarsan, Effect of surface functional groups on hydrogen adsorption properties of Pd dispersed reduced graphene oxide, Int. J. Hydrogen Energy, 2017, 42, 8032–8041 CrossRef CAS.
- M. P. Jahromi, S. E. Moradi, A. Nasrollahpour and S. M. J. Moradi, FePt/reduced graphene oxide composites for high capacity hydrogen storage, Fullerenes, Nanotubes, Carbon Nanostruct., 2017, 25, 295–300 CrossRef CAS.
- M. Sterlin Leo Hudson, H. Raghubanshi, S. Awasthi, T. Sadhasivam, A. Bhatnager, S. Simizu, S. G. Sankar and O. N. Srivastava, Hydrogen uptake of reduced graphene oxide and graphene sheets decorated with Fe nanoclusters, Int. J. Hydrogen Energy, 2014, 39, 8311–8320 CrossRef CAS.
- B. F. Mohazzab, B. Jaleh, S. Khazalpour, M. Nasrollahzadeh, M. Zare, H. W. Jang and M. Shokouhimehr, Insights into the hydrogen adsorption on deposited graphene oxide by zirconia and gold nanoparticles, J. Phys. Chem. Solids, 2021, 154, 110061 CrossRef CAS.
- P. Giannozzi, S. Baroni, N. Bonini, M. Calandra, R. Car, C. Cavazzoni, D. Ceresoli, G. L. Chiarotti, M. Cococcioni, I. Dabo, A. D. Corso, S. de Gironcoli, S. Fabris, G. Fratesi, R. Gebauer, U. Gerstmann, C. Gougoussis, A. Kokalj, M. Lazzeri, L. Martin-Samos, N. Marzari, F. Mauri, R. Mazzarello, S. Paolini, A. Pasquarello, L. Paulatto, C. Sbraccia, S. Scandolo, G. Sclauzero, A. P. Seitsonen, A. Smogunov, P. Umari and R. M. Wentzcovitch, QUANTUM ESPRESSO: a modular and open-source software project for quantum simulations of materials, J. Phys.: Condens. Matter, 2009, 21, 395502 CrossRef.
- J. P. Perdew, K. Burke and M. Ernzerhof, Generalized Gradient Approximation Made Simple, Phys. Rev. Lett., 1996, 77, 3865–3868 CrossRef CAS.
- D. Vanderbilt, Soft self-consistent pseudopotentials in a generalized eigenvalue formalism, Phys. Rev. B: Condens. Matter Mater. Phys., 1990, 41, 7892–7895 CrossRef.
- M. Methfessel and A. T. Paxton, High-precision sampling for Brillouin-zone integration in metals, Phys. Rev. B: Condens. Matter Mater. Phys., 1989, 40, 3616–3621 CrossRef CAS PubMed.
- H. J. Monkhorst and J. D. Pack, Special points for Brillouin-zone integrations, Phys. Rev. B: Solid State, 1976, 13, 5188–5192 CrossRef.
- A. Kokalj, Computer graphics and graphical user interfaces as tools in simulations of matter at the atomic scale, Comput. Mater. Sci., 2003, 28, 155–168 CrossRef CAS.
- K. Momma and F. Izumi, VESTA 3 for three-dimensional visualization of crystal, volumetric and morphology data, J. Appl. Crystallogr., 2011, 44, 1272–1276 CrossRef CAS.
- R. R. Q. Freitas, R. Rivelino, F. de, B. Mota and C. M. C. de Castilho, DFT Studies of the Interactions of a Graphene Layer with Small Water Aggregates, J. Phys. Chem. A, 2011, 115, 12348–12356 CrossRef CAS.
- C. S. Sunandana, Nanomaterials for hydrogen storage, Resonance, 2007, 12, 31–36 CrossRef CAS.
- D. R. Lide and G. W. A. Milne, Handbook of Data on Common Organic Compounds, CRC Press, 1995 Search PubMed.
- L. Pauling, L. O. Brockway and J. Y. Beach, The Dependence of Interatomic Distance on Single Bond-Double Bond Resonance1, J. Am. Chem. Soc., 1935, 57, 2705–2709 CrossRef CAS.
- F. Banhart, J. Kotakoski and A. V. Krasheninnikov, Structural Defects in Graphene, ACS Nano, 2011, 5, 26–41 CrossRef CAS PubMed.
- C. Kittel, Introduction to solid state physics, Wiley, New York, 4th edn, 1971 Search PubMed.
- H. Valencia, A. Gil and G. Frapper, Trends in the Hydrogen Activation and Storage by Adsorbed 3d Transition Metal Atoms onto Graphene and Nanotube Surfaces: A DFT Study and Molecular Orbital Analysis, J. Phys. Chem. C, 2015, 119, 5506–5522 CrossRef CAS.
- Y.-H. Zhang, L.-F. Han, Y.-H. Xiao, D.-Z. Jia, Z.-H. Guo and F. Li, Understanding dopant and defect effect on H2S sensing performances of graphene: A first-principles study, Comput. Mater. Sci., 2013, 69, 222–228 CAS.
- F. Ostovari, M. Hasanpoori, M. Abbasnejad and M. A. Salehi, DFT calculations of graphene monolayer in presence of Fe dopant and vacancy, Phys. B, 2018, 541, 6–13 CrossRef CAS.
- F. Wrobel, H. Park, C. Sohn, H.-W. Hsiao, J.-M. Zuo, H. Shin, H. N. Lee, P. Ganesh, A. Benali, P. R. C. Kent, O. Heinonen and A. Bhattacharya, Doped NiO: The mottness of a charge transfer insulator, Phys. Rev. B, 2020, 101, 195128 CrossRef CAS.
- Z. M. Ao and F. M. Peeters, High-capacity hydrogen storage in Al-adsorbed graphene, Phys. Rev. B: Condens. Matter Mater. Phys., 2010, 81, 205406 CrossRef.
Footnote |
| † Electronic supplementary information (ESI) available: All the optimized atomic coordinates and final energy of the different systems are given in Tables S8 and S9. See DOI: https://doi.org/10.1039/d2cp03794g |
| This journal is © the Owner Societies 2023 |


