
 Open Access Article
 This Open Access Article is licensed under a
 Creative Commons Attribution 3.0 Unported Licence
Examining the substituent effect on mycosporine-inspired ultraviolet filters†‡
Abigail L.
Whittock
 ab,
Adam M.
Cowden
ac,
Martin
Wills
a and
Vasilios G.
Stavros
*a
ab,
Adam M.
Cowden
ac,
Martin
Wills
a and
Vasilios G.
Stavros
*a
aDepartment of Chemistry, University of Warwick, Coventry, CV4 7AL, UK. E-mail: v.stavros@warwick.ac.uk
bAnalytical Science Centre for Doctoral Training, Senate House, University of Warwick, Coventry, CV4 7AL, UK
cMolecular Analytical Science Centre for Doctoral Training, Senate House, University of Warwick, Coventry, CV4 7AL, UK
First published on 6th February 2023
Abstract
Current organic ultraviolet (UV) filters found in sunscreen formulations suffer a number of drawbacks. In this work, we have synthesised four biomimetic molecules built on the mycosporine molecular scaffold (a natural UV filter) with varying substituents at one of the carbons on the ring and investigated their photoprotective properties. From our findings, we infer design guidelines which may have a direct result on the production of next generation UV filters.
Introduction
Ultraviolet (UV) radiation is an environmental stressor that both humans and nature respond to.1 While there are benefits to some exposure to UV radiation, the negative effects of overexposure, such as skin cancer, cataract formation and photoaging, mean that protection is essential for survival.2,3 As a result, commercial sunscreens are a popular cosmetic in the modern world and are important for public health.4Current commercial sunscreens contain UV filters, both organic and inorganic, which are responsible for providing protection against UV radiation through absorption (as well as reflection and scattering for inorganic UV filters).5,6 A number of organic UV filters have come under scrutiny in recent years due to concerns about their safety to humans as well as aquatic environments and organisms.7–11 With this in mind, research into understanding the fundamental photochemistry and photophysics of current organic UV filters as well as for novel alternatives is crucial to the development of sunscreens with improved safety profiles.12 Toxicological studies and the monitoring of biological endpoints are also essential to assess the true safety of a candidate organic UV filter.
Recently, there has been a considerable interest in biomimetic molecules for use as organic UV filters in sunscreens.13–15 This study is no exception, and the synthesised molecules here incorporate an essential motif from the mycosporine family of natural products. The molecular scaffold of mycosporines consists of a cyclohexenone core ring and they are synthesised by fungi, cyanobacteria, microalgae, macroalgae and more. Mycosporine-like amino acids (MAAs) are also derived from mycosporines and are comprised of a cyclohexenimine core ring structure. MAAs are not synthesised by fungi since they lack the additional enzymes that are found in e.g. cyanobacteria.16,17
The mycosporine chromophore has previously been investigated through computational studies and ultrafast spectroscopy. Losantos et al.18 computationally found that following excitation to the second electronic excited state (S2), relaxation onto the first electronic excited state (S1) occurred before reaching a minimum on the S1 potential energy surface where the excited population becomes trapped (thus increasing the probability of alternative reaction pathways and possible degradation). This was supported by transient electronic absorption spectroscopy (TEAS) measurements conducted by Woolley et al.19 which found a persistent excited state absorption (ESA) extending to the maximum time delay of their experiment (2.5 ns). More recently, Whittock et al.20 probed the ground state bleach (GSB) recovery of the cyclohexenone chromophore using transient vibrational absorption spectroscopy (TVAS). This showed that whilst some population is trapped in the S1, a large proportion of the population (>75%) relaxes within ultrafast timescales. This suggested that cyclohexenone chromophores are not as poor UV filters as previously thought.
Herein, we examine this further by synthesising a group of four molecules, 1–4, with a cyclohexenone core with various substituents at the C-2 position, see Fig. 1. In natural mycosporines both the methoxy substituent and hydroxy substituent are found, with the latter molecules being known as normycosporines.21–23 The synthesis of these molecules was inspired by a desire to reduce the complexity of the parent molecules by trimming away molecular structures that are not essential to the absorption ability. Indeed, a full synthesis of natural mycosporines is laborious and consists of many steps, which is impractical for intended industrial applications.24 Upon probing the photochemical and photophysical characterisation of this family of molecules, we found that the substituent at C-2 is an important structural feature to consider when designing future mycosporine-inspired UV filters.
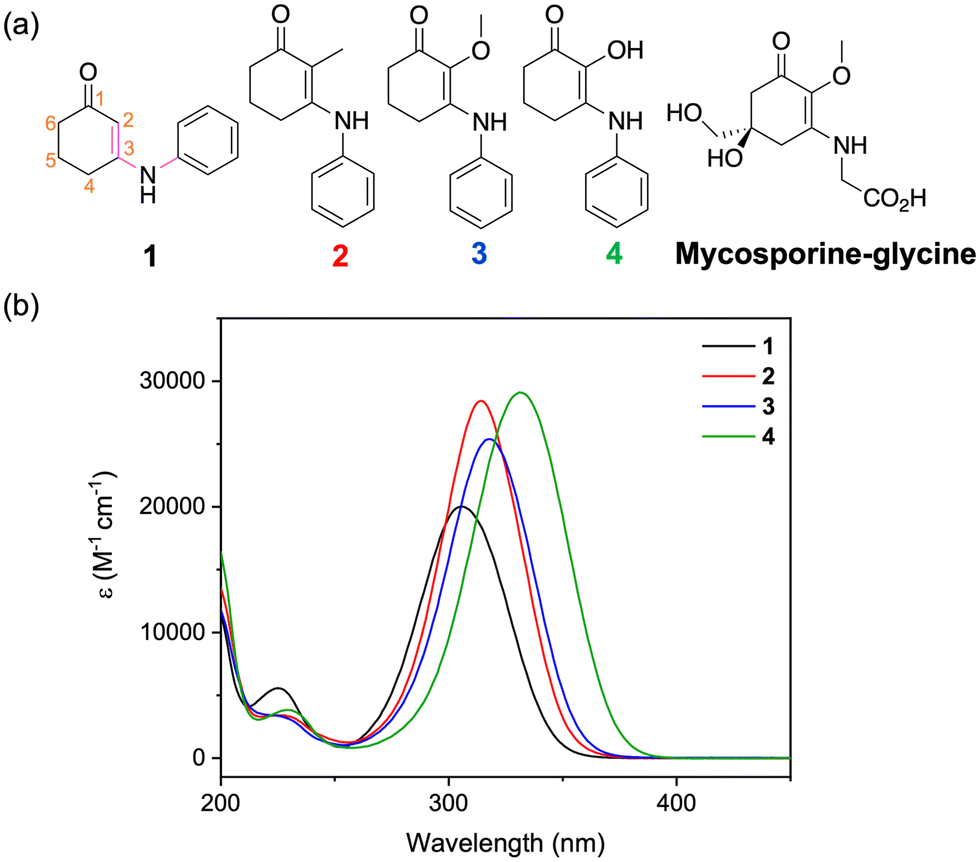 | ||
| Fig. 1 (a) Chemical structure of 1–4 and mycosporine–glycine. (b) UV-visible spectra plotted as the molar extinction coefficient (ε) for molecules 1–4 in aqueous solutions. | ||
Experimental and computational details
Synthesis
1 and 2 were prepared from commercially available diketone precursors through direct condensation with aniline. For 3 and 4, the first step was hydrogenation of pyrogallol to give dihydropyrogallol. 3 was then prepared via methylation of dihydropyrogallol followed by condensation with aniline. 4 was prepared by dihydropyrogallol condensation with aniline. The full synthesis procedures and characterisation (Fig. S1–S6) can be found in the ESI.‡Computational methods
Geometries of 1–4 were optimised using density functional theory (DFT). Two conformations of the phenyl ring and hydrogen atom around the C-3–N bond were considered and the relative energies of each were assessed. To investigate the thermal barrier between the two conformers for 1, the C–C–N–C dihedral angle was rotated +90°/−90° where it was then fixed and a geometry optimisation was performed. An unrestricted transition state optimisation was then performed using the −90° optimised geometry as a starting point as it was lower in energy compared to the +90°. These were performed using the software package NWChem at the PBE0/6-311++G** level with implicitly modelled water using the conductor like screening model (COSMO).25–32 For the optimised geometries of both conformers for 1–4, singlet vertical excitation energies were predicted using the second-order approximate coupled-cluster singles and doubles method with the resolution-of-the-identity approximation (RI-CC2).33–35 For these calculations the def2-TZVP basis set was used along with the COSMO solvent model for water using the software package TURBOMOLE.29–31,36,37 Triplet vertical excitation energies for the lowest energy conformer of 1–4 were also calculated at the RI-CC2/def2-TZVP level with the COSMO solvent model for water.29–31,33–35,37–39 We elected to use RI-CC2 due to the good levels of accuracy achieved in predicting the UV-visible spectra of these molecules as has also been found in our previous work for natural mycosporine-like amino acids.40,41Transient electronic absorption spectroscopy
The transient electronic absorption setup at the Warwick Centre for Ultrafast Spectroscopy has been described previously and so only a brief description is given here with details pertaining to the experiments within this work.19 1 mM aqueous solutions (with 4% ethanol for solubility) of 1–4 and 1 mM of 1 in ethanol were continuously circulated through a demountable liquid cell (Harrick's Scientific) using a diaphragm pump (SIMDOS). The pathlength of the sample was 100 μm which was achieved by sandwiching 100 μm spacers between CaF2 windows (front 1 mm and back 2 mm). The pump pulse was set to the absorption maximum of each sample (306 nm for 1, 314 nm for 2, 318 nm for 3 and 331 nm for 4); the power was ∼500 μW and the beam diameter at the sample was ∼400 μm (fluence = 0.4 mJ cm−2). The probe pulse, a white light continuum spanning 320–720 nm, was generated by focussing the fundamental 800 nm onto a vertically translating CaF2 window. The pathlength of the probe pulse was varied by a gold retroreflector mounted onto a delay stage resulting in time delays between −1 ps and 3 ns. Every other pump pulse was blocked by a chopper spinning at 500 Hz. This enabled the pump-on and pump-off absorbance to be directly compared with a resultant output of difference in optical density (ΔOD).The acquired transient absorption spectra (TAS) were chirp-corrected using the software package KOALA and the data was fit using a global sequential kinetic model using the software package Glotaran.42,43
Steady-state spectroscopy
1 mM aqueous stock solutions of samples 1–4 were prepared with 4% ethanol for solubility. These solutions were then diluted further in water to give μM concentrations for all steady-state spectroscopy measurements resulting in <4% ethanol in each solution unless otherwise stated. UV-visible spectra were obtained using a UV-visible spectrometer (Cary 60, Agilent Technologies). To determine the molar extinction coefficient, aqueous solutions of 5 or 6 different concentrations giving an absorbance at the peak below 1 were made up and a UV-visible spectrum was acquired. Fluorescence spectra were obtained for ∼15 μM aqueous solutions of 1–4 using a spectrofluorometer (Fluorolog 3, Horiba) set up with an emission and excitation bandwidth of 2.5 nm. Long-term irradiations of ∼10 μM aqueous solutions of 1–4 were performed using a solar simulator (LCS100, Oriel Instruments) which outputs the equivalent power to one sun ∼1000 W m−2 and emits wavelengths in the UVA and UVB region of the electromagnetic spectrum. These long-term irradiations were performed for 120 minutes and at regular intervals, the samples were shaken, and UV-visible spectra were collected. Control ∼10 μM aqueous solutions of 1–4 were left in the dark for 120 minutes to assess the stability of the solutions.Further studies on 4 were required to probe its chemical stability. Firstly, 1 mM of 4 in D2O was irradiated under a solar simulator (LCS100, Oriel Instruments) for 240 minutes and 1H-NMR spectra (400 MHz) were acquired pre- and post-irradiation. Secondly, an aqueous solution of 4 at ∼10 μM was heated to 50 °C for 60 minutes and UV-visible spectra were acquired before and after heating. Finally, another aqueous solution of 4 at ∼10 μM was irradiated with monochromatic light (Fluorolog 3, Horiba) set to its peak absorption (331 nm) with a bandwidth of 8 nm and a power of 200 μW which is equivalent to two suns at this wavelength and bandwidth. UV-visible spectra were collected at regular intervals during the 120 minute irradiation and the cuvette was shaken frequently.
Results and discussion
Using DFT, we investigated the relaxed geometries of 1–4 by considering two conformers around the C-3–N bond; where the C–C–N–C dihedral angle, highlighted in pink in Fig. 1a, is either ∼0° or 180°. The lower energy conformer is depicted in the skeletal structures given in Fig. 1a for each molecule. For 1 this is the 0° conformer and for 2–4 this is the 180° conformer. For the relaxed geometry of 3, the methoxy group is perpendicular to the plane of the molecule similar to that of natural MAAs,40 whereas for 4, the hydroxy group is in the plane of the molecule and forms an intramolecular hydrogen bond with the ketone at C-1. See the ESI‡ for more details (Fig. S7, ESI‡).The UV-visible spectra for 1–4 are given in Fig. 1b. The peak absorptions (λmax) are reported in Table 1 and vary by more than 20 nm across both UVB (280–315 nm) and UVA (315–400 nm) regions depending on the substituent at C-2.44 The substituent effect on the λmax can be explained by the increasing electron donation effect of the groups as we move from H < CH3 < OCH3 < OH. Note that the λmax of 2–4 have a more red-shifted absorbance than mycosporine–glycine which is 310 nm.21 Given that the current catalogue of UVA filters is sparse,45 using substituents that red-shift the λmax is one avenue to improve current and novel UVA filters. The molar extinction coefficient (ε) measured for each molecule is between 20![[thin space (1/6-em)]](https://www.rsc.org/images/entities/char_2009.gif) 000 and 30000 M−1 cm−1 which is comparable to current UV filters (Fig. S8, ESI‡).6 From calculations at the RI-CC2 level of theory, this absorption is primarily assigned to a ππ* transition between the highest occupied molecular orbital and the lowest unoccupied molecular orbital (Tables S1–S2 and Fig. S9, ESI‡). For 1–3, this corresponds to an S2←S0 transition and for 4 this corresponds to an S1←S0 transition. Predicted λmax from these calculations (acquired by summing Gaussians with a fixed width of 0.2 eV of the first five singlet vertical excitations) are given in Table 1 and mostly match the experimental trend.
000 and 30000 M−1 cm−1 which is comparable to current UV filters (Fig. S8, ESI‡).6 From calculations at the RI-CC2 level of theory, this absorption is primarily assigned to a ππ* transition between the highest occupied molecular orbital and the lowest unoccupied molecular orbital (Tables S1–S2 and Fig. S9, ESI‡). For 1–3, this corresponds to an S2←S0 transition and for 4 this corresponds to an S1←S0 transition. Predicted λmax from these calculations (acquired by summing Gaussians with a fixed width of 0.2 eV of the first five singlet vertical excitations) are given in Table 1 and mostly match the experimental trend.
| λ max (nm) | ε (M−1 cm−1) | Predicted λmax (nm) | |
|---|---|---|---|
| 1 | 306 | 20020 |
290 |
| 2 | 314 | 28440 |
290 |
| 3 | 318 | 25390 |
297 |
| 4 | 331 | 29110 |
320 |
Selected time delay transient absorption spectra (TAS) for each molecule are displayed in Fig. 2 (Fig. S10, ESI‡). All of the TAS have similar features and as such will be summarised together. Firstly, there is a ground state bleach (GSB) at the blue edge of the probe and stimulated emission (SE) spanning from ∼400 nm to the red edge of the probe (SE very mild for 1). There is also an excited state absorption (ESA) centred between 350 and 400 nm. All three of the described features occur immediately from time-zero. A second ESA red-shifted from the first described ESA grows in after time-zero. This feature is more defined for 1 and 2 and appears more like a shoulder absorption in the TAS of 3 and 4. This feature being shifted from time-zero could either be due to the competing SE which covers the same spectral region or is the result of an absorption from a relaxed structure, i.e. not the geometry immediately after excitation (Franck–Condon geometry). Upon decay after a few ps of the described spectral signatures, long-lived features persist with no spectral change up until, and beyond, the final time delay of our experiment (>3 ns). For 1 and 2, there is a relatively sharp ESA centred below 350 nm. For 3 and 4, there is a broader ESA (particularly for 4) which is centred at ∼375 and ∼425 nm respectively and a GSB at the blue edge of the probe window. Finally, in all four TAS there is a broad ESA at the red edge of the probe which we assign to solvated electron absorption; a conclusion we draw from its disappearance upon addition of potassium nitrate, an electron scavenger (Fig. S11, ESI‡).46 The source of the solvated electron (ESA at ∼450–720 nm) is most likely from 1–4 given that the solvent alone TAS at long time delays did not show any signal between 400–720 nm (Fig. S12, ESI‡). This would suggest that there is also a radical cation for each molecule generated which subsequently will contribute to the persistent GSB (when observed). In line with our previous studies on natural MAAs,40,41 this solvated electron absorption for all stable molecules was determined to be the result of multiphoton induced dynamics implying that it is unlikely to be initiated by the sun (Fig. S13, ESI‡).
 | ||
| Fig. 2 TAS displayed as lineouts at selected pump-probe time delays for aqueous solutions of (a) 1 photoexcited at 306 nm, (b) 2 photoexcited at 314 nm, (c) 3 photoexcited at 318 nm and (d) 4 photoexcited at 331 nm. | ||
Using the software package Glotaran,43 lifetimes associated with dynamical contributions were extracted using a global sequential kinetic model. Three lifetimes for 1–4 were required for the fit and these are reported in Table 2 (Fig. S14 and S15, ESI‡). We now assign the lifetimes to processes within the relaxation mechanism guided by previous work and our own calculations.19,20
| τ 1 (fs) | τ 2 (ps) | τ 3 (ns) | |
|---|---|---|---|
| 1 | 110 ± 40 | 1.21 ± 0.04 | >3 |
| 2 | 150 ± 40 | 1.53 ± 0.04 | >3 |
| 3 | 180 ± 40 | 1.09 ± 0.04 | >3 |
| 4 | 200 ± 40 | 1.10 ± 0.04 | >3 |
The first lifetime, τ1, for 1–4 is sub-picosecond and is assigned to evolution out of the Franck–Condon region along the electronic excited state reaction coordinate evidenced by the decay and slight red-shift of the SE. Note that for 1–3, given the similar energies of the S1 and S2, we propose that this lifetime also incorporates population funnelling through the S2/S1 CI. We attribute the second lifetime, τ2, which is between 1 and 2 ps for all molecules to both population traversing through the S1/S0 CI to populate a vibrationally hot electronic ground state and subsequent vibrational cooling. The described photoprotective mechanism is schematically represented in Fig. 3. The second ESA above 400 nm also decays on a similar timescale; however, given its large spectral shift from the GSB, it is unlikely to be associated with ground state vibrational cooling and is instead possibly related to trapped population in the electronic excited state which approaches a minimum within τ2. We return to discuss long-lived species later. The quoted lifetimes for τ1 and τ2 are on the same timescale to those we have observed for natural MAAs.40,41 We previously assigned the fast vibrational cooling in the electronic ground state to the large number of solute-solvent hydrogen bonds combined with the zwitterionic nature of MAAs.40,41,47 As this is not the case here given the neutral form of 1–4 and the smaller number of hydrogen donating and accepting sites (most likely resulting in fewer solute-solvent hydrogen bonds), we reconcile this through water being a highly interactive solvent that facilitates very efficient energy dissipation. This is complemented by studies in ethanol which show longer extracted lifetimes (Fig. S17, S18 and Table S3, ESI‡). Therefore, we conclude (albeit tentatively) that the extended hydrogen bonding network in bulk water is more responsible for the efficient vibrational cooling compared to the zwitterionic nature of MAAs.
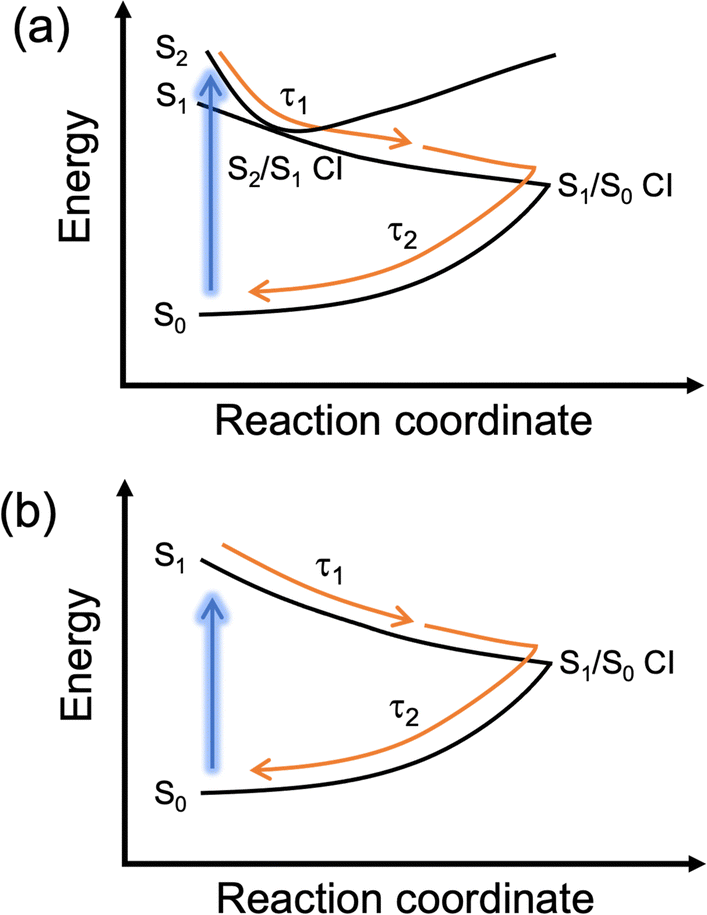 | ||
| Fig. 3 Schematic representation of the proposed dominant photoprotective mechanism for (a) 1–3 and (b) 4. | ||
The final lifetime, τ3, is beyond the timescale of our experiment, >3 ns, and this is assigned to the long-lived ESAs for 1–4 and remnant GSB for 3 and 4 described above. We note that this is likely only due to a minor part of the population as the majority has relaxed within the first two lifetimes. Only focussing on the ESA at the blue edge of the probe; this feature could be due to a number of species including trapped population in the singlet electronic excited state, trapped population in a low-lying triplet state or a photoproduct. Whilst calculations show that there are low lying triplet states (Table S4, ESI‡), the short lifetime of the excited state makes it unlikely to be the result of intersystem crossing and hence triplet state formation. This is further supported by the fact that the emission lifetimes were unaffected by purging with nitrogen (data not shown). We therefore favour trapped population in the singlet electronic excited state and photoproduct formation.
We now detail our above assignment of the lifetimes with reference to previous computational studies by Losantos et al.18,48 Firstly, the photoprotective mechanism for the cyclohexenone chromophore was found to switch from being a planar geometry (S0 optimised) to a non-planar ring buckled geometry (S1/S0 CI) with a minimum along the S1 state where population may become trapped. After 3 ns, we believe that the population that is trapped in the S1 (though likely minor) mostly finds its way to an S1/S0 CI and repopulates the electronic ground state with a small fraction of this trapped population possibly undergoing a degradation pathway. We have inferred this from our long-term irradiations which will be discussed below (note that 4 is the exception). We can rule out radiative decay because only weak fluorescence was observed with quantum yields of <1% for each molecule (Fig. S19, ESI;‡ data not shown for quantum yield). More recently, a second photoprotective mechanism was identified when a cyclohexenimine chromophore was disubstituted with phenyl rings, which was rotation around one of the C![[double bond, length as m-dash]](https://www.rsc.org/images/entities/char_e001.gif) N bonds (note that this is not the same chromophore as within this work). Whilst the authors found no evidence of photoisomer formation in their study, they proposed it could be formed and then revert quickly to the starting isomer at room temperature reporting a barrier of ∼0.6 eV. For 1, we performed a transition state optimisation for a geometry between the two conformers using DFT and found a similar barrier of ∼0.5 eV. Additionally, for 1–4, a slight red-shifted absorption was found (in some cases) for the higher energy conformer so it is plausible that 1–4 may relax through a similar mechanism and then thermally return to equilibrium beyond 3 ns. We add that these conclusions are speculative given that we have not computationally performed excited state relaxation (or CI) searches to determine the photoprotective mechanism or minimum energy paths for 1–4 within this work. See the ESI‡ for more details (Fig. S20, ESI‡).
N bonds (note that this is not the same chromophore as within this work). Whilst the authors found no evidence of photoisomer formation in their study, they proposed it could be formed and then revert quickly to the starting isomer at room temperature reporting a barrier of ∼0.6 eV. For 1, we performed a transition state optimisation for a geometry between the two conformers using DFT and found a similar barrier of ∼0.5 eV. Additionally, for 1–4, a slight red-shifted absorption was found (in some cases) for the higher energy conformer so it is plausible that 1–4 may relax through a similar mechanism and then thermally return to equilibrium beyond 3 ns. We add that these conclusions are speculative given that we have not computationally performed excited state relaxation (or CI) searches to determine the photoprotective mechanism or minimum energy paths for 1–4 within this work. See the ESI‡ for more details (Fig. S20, ESI‡).
We now turn to the long-term irradiation results. The percentage decrease across the UVA and UVB regions after irradiating for 120 minutes with a solar simulator was <6% for 1–3 (i.e. photostable) and 93% for 4 (i.e. photounstable) (Fig. S21, ESI‡). In the irradiations, there were no new absorptions in the ∼350–400 nm region which would correspond to the long-lived species in the TAS; confirming that the long-lived feature in the 3 ns TAS is not due to a stable photoproduct, i.e. the higher energy conformer if formed thermally returns to equilibrium beyond 3 ns as described above. For 1–3, the small amount of degradation may stem from the trapped S1 population beyond 3 ns in our TAS or the broader irradiation spectrum output by the solar simulator possibly enabling absorption of higher energy photons and the availability of alternative reaction pathways (Fig. S22, ESI‡). We further probed the photoinstability of 4 by taking an NMR spectrum before and after irradiation, leaving a solution in the dark, heating a solution to 50 °C, and irradiating with monochromatic irradiation (Fig. S23–S25, ESI‡). In all cases, degradation was observed suggesting that 4 is chemically unstable in aqueous solution. We believe that 4 likely hydrolyses to products which suggest cleavage of the C-3–N bond but the products themselves have not been identified. From these results, we can infer that the origin of this instability must occur in the electronic ground state. It may also arise from the electronic excited state, but we are unable to confirm this. We direct the reader to the ESI‡ for more details.
As this degradation is specific to 4 and not 1–3, one hypothesis is that the intramolecular hydrogen bond between the ketone and hydroxy group on C-1 and C-2 destabilises 4 making it more prone to hydrolysis. Regardless, as a design rule for the future, it would be wise to avoid hydroxy substituents in these mycosporine-inspired molecules. In fact, one step in the biosynthesis of mycosporine–glycine converts dimethyl 4-deoxygadusol to 4-deoxygadusol, which involves the conversion of the hydroxy group at the C-2 position to a methoxy group (Scheme S1, ESI‡). We tentatively suggest that the conversion of the hydroxy group to a methoxy group by nature is an evolutionary strategy that avoids potential instability. Further to this, these results align with reports that normycosporines are unstable molecules and are prone to hydrolysis.22,23
Conclusions
In conclusion, when designing new biomimetic mycosporine-inspired UV filters for possible commercial use, the substitution effect is important. In this work we have shown that there is a fine balance between pushing the peak absorption further towards the UVA region and the overall stability of the molecule. We have confirmed that a hydroxy substituent at the C-2 position, as in 4, would not be a suitable UV filter while there is significant stability conferred by protecting the hydroxy as a methoxy group as in 3, which mimics the functionality found in the natural products which inspired this study. The class of molecules containing the combination of the C-2 methoxy and aniline described in this paper are readily prepared in three steps from readily-available pyrogallol and aniline and have the potential to be prepared on a large scale. In contrast, natural mycosporines have very complex structures which have been challenging for organic synthesis approaches.24 The modular design of the novel compounds facilitates the rapid preparation of derivatives through the use of alternative starting materials in the short reaction sequence. These derivatives may include containing alternative C-2 alkoxy groups, additional substituents on the aromatic rings and potentially additional functionality on the cyclohexenone ring. An extended study is required to establish the detailed effects of each potential substitution; however, given the presence of carboxylic acid and hydroxy functionalities in natural mycosporines (e.g. mycosporine–glycine) then the addition of these functional groups in alternative positions in derivatives of 3 may give products with improved performance as UV filters. Thereby, this work goes some way to provide industries with future design guidelines relating to this family of UV filters.Conflicts of interest
There are no conflicts to declare.Acknowledgements
The authors thank J. M. Woolley for helpful discussions, the Warwick Centre for Ultrafast Spectroscopy and the Scientific Computing Research Technology Platforms at the University of Warwick for equipment and computational resources. We acknowledge computing resources via the EPSRC funded HPC Midlands+ computing centre (EP/P020232/1). A. L. W. thanks the University of Warwick and Lubrizol for funding a PhD studentship through the Centre for Doctoral Training (CDT) in Analytical Science. A. M. C. thanks the EPSRC for a PhD studentship through the EPSRC CDT in Molecular Analytical Science, grant number EP/L015307/1. V. G. S. thanks the Royal Society for an Industry Fellowship (INF\R1\201056). This work was supported by Grant EP/S021442/1 from the EPSRC.Notes and references
- W. Harm, Biological effects of ultraviolet radiation, Cambridge University Press, Cambridge, 1980 Search PubMed.
- R. P. Gallagher and T. K. Lee, Prog. Biophys. Mol. Biol., 2006, 92, 119–131 CrossRef CAS PubMed.
- P. A. Morganroth, H. W. Lim and C. T. Burnett, Am. J. Lifestyle Med., 2013, 7, 168–181 CrossRef.
- S. Lautenschlager, H. C. Wulf and M. R. Pittelkow, Lancet, 2007, 370, 528–537 CrossRef CAS PubMed.
- N. Serpone, D. Dondi and A. Albini, Inorg. Chim. Acta, 2007, 360, 794–802 CrossRef CAS.
- N. A. Shaath, Photochem. Photobiol. Sci., 2010, 9, 464–469 CrossRef CAS PubMed.
- E. Gilbert, F. Pirot, V. Bertholle, L. Roussel, F. Falson and K. Padois, Int. J. Cosmet. Sci., 2013, 35, 208–219 CrossRef CAS PubMed.
- J. A. Ruszkiewicz, A. Pinkas, B. Ferrer, T. V. Peres, A. Tsatsakis and M. Aschner, Toxicol. Rep., 2017, 4, 245–259 CrossRef CAS PubMed.
- R. Danovaro, L. Bongiorni, C. Corinaldesi, D. Giovannelli, E. Damiani, P. Astolfi, L. Greci and A. Pusceddu, Environ. Health Perspect., 2008, 116, 441–447 CrossRef CAS PubMed.
- C. A. Downs, E. Kramarsky-Winter, R. Segal, J. Fauth, S. Knutson, O. Bronstein, F. R. Ciner, R. Jeger, Y. Lichtenfeld, C. M. Woodley, P. Pennington, K. Cadenas, A. Kushmaro and Y. Loya, Arch. Environ. Contam. Toxicol., 2016, 70, 265–288 CrossRef CAS PubMed.
- D. Vuckovic, A. I. Tinoco, L. Ling, C. Renicke, J. R. Pringle and W. A. Mitch, Science, 2022, 376, 644–648 CrossRef CAS PubMed.
- A. L. Whittock, T. T. Abiola and V. G. Stavros, J. Phys. Chem. A, 2022, 126, 2299–2308 CrossRef CAS PubMed.
- T. T. Abiola, A. L. Whittock and V. G. Stavros, Molecules, 2020, 25, 3945 CrossRef CAS PubMed.
- R. Losantos, D. Sampedro and M. S. Churio, Pure Appl. Chem., 2015, 87, 979–996 CrossRef CAS.
- L. A. Baker, B. Marchetti, T. N. V. Karsili, V. G. Stavros and M. N. R. Ashfold, Chem. Soc. Rev., 2017, 46, 3770–3791 RSC.
- W. M. Bandaranayake, Nat. Prod. Rep., 1998, 15, 159–172 RSC.
- E. P. Balskus and C. T. Walsh, Science, 2010, 329, 1653–1656 CrossRef CAS PubMed.
- R. Losantos, I. Funes-Ardoiz, J. Aguilera, E. Herrera-Ceballos, C. García-Iriepa, P. J. Campos and D. Sampedro, Angew. Chem., Int. Ed., 2017, 56, 2632–2635 CrossRef CAS PubMed.
- J. M. Woolley, M. Staniforth, M. D. Horbury, G. W. Richings, M. Wills and V. G. Stavros, J. Phys. Chem. Lett., 2018, 9, 3043–3048 CrossRef CAS PubMed.
- A. L. Whittock, M. A. P. Turner, D. J. L. Coxon, J. M. Woolley, M. D. Horbury and V. G. Stavros, Front. Chem., 2020, 8, 574038 CrossRef CAS PubMed.
- V. Geraldes and E. Pinto, Pharmaceuticals, 2021, 14, 63 CrossRef CAS PubMed.
- M.-C. Lunel, N. Arpin and J. Favre-Bonvin, Tetrahedron Lett., 1980, 21, 4715–4716 CrossRef CAS.
- J. Bernillon, M.-L. Bouillant, J.-L. Pittet, J. Favre-Bonvin and N. Arpin, Phytochemistry, 1984, 23, 1083–1087 CrossRef CAS.
- J. D. White, J. H. Cammack, K. Sakuma, G. W. Rewcastle and R. K. Widener, J. Org. Chem., 1995, 60, 3600–3611 CrossRef CAS.
- J. P. Perdew, M. Ernzerhof and K. Burke, J. Chem. Phys., 1996, 105, 9982–9985 CrossRef CAS.
- C. Adamo and V. Barone, J. Chem. Phys., 1999, 110, 6158 CrossRef CAS.
- R. Krishnan, J. S. Binkley, R. Seeger and J. A. Pople, J. Chem. Phys., 1980, 72, 650–654 CrossRef CAS.
- T. Clark, J. Chandrasekhar, G. W. Spitznagel and P. V. R. Schleyer, J. Comput. Chem., 1983, 4, 294–301 CrossRef CAS.
- A. Klamt and G. Schüürmann, J. Chem. Soc., Perkin Trans. 2, 1993, 799–805 RSC.
- D. M. York and M. Karplus, J. Phys. Chem. A, 1999, 103, 11060–11079 CrossRef CAS.
- P. Winget, D. M. Dolney, D. J. Giesen, C. J. Cramer and D. G. Truhlar, Minnesota Solvent Descriptor Database. Department of Chemistry and Supercomputer Institute, University of Minnesota, Minneapolis, MN, 1999 Search PubMed.
- M. Valiev, E. J. Bylaska, N. Govind, K. Kowalski, T. P. Straatsma, H. J. J. Van Dam, D. Wang, J. Nieplocha, E. Apra, T. L. Windus and W. A. de Jong, Comput. Phys. Commun., 2010, 181, 1477–1489 CrossRef CAS.
- O. Christiansen, H. Koch and P. Jørgensen, Chem. Phys. Lett., 1995, 243, 409–418 CrossRef CAS.
- C. Hättig and A. Köhn, J. Chem. Phys., 2002, 117, 6939–6951 CrossRef.
- C. Hättig and F. Weigend, J. Chem. Phys., 2000, 113, 5154–5161 CrossRef.
- TURBOMOLE V7.4 2019, a development of University of Karlsruhe and Forschungszentrum Karlsruhe GmbH, 1989-2007, TURBOMOLE GmbH, since 2007; available from http://www.turbomole.com.
- F. Weigend, M. Häser, H. Patzelt and R. Ahlrichs, Chem. Phys. Lett., 1998, 294, 143–152 CrossRef CAS.
- C. Hättig and K. Hald, Phys. Chem. Chem. Phys., 2002, 4, 2111–2118 RSC.
- C. Hättig, A. Köhn and K. Hald, J. Chem. Phys., 2002, 116, 5401–5410 CrossRef.
- A. L. Whittock, N. Auckloo, A. M. Cowden, M. A. P. Turner, J. M. Woolley, M. Wills, C. Corre and V. G. Stavros, J. Phys. Chem. Lett., 2021, 12, 3641–3646 CrossRef CAS PubMed.
- A. L. Whittock, J. M. Woolley, N. Auckloo, C. Corre and V. G. Stavros, Molecules, 2022, 27, 2272 CrossRef CAS PubMed.
- M. P. Grubb, A. J. Orr-Ewing and M. N. R. Ashfold, Rev. Sci. Instrum., 2014, 85, 064104 CrossRef PubMed.
- J. J. Snellenburg, S. Laptenok, R. Seger, K. M. Mullen and I. H. M. Van Stokkum, J. Stat. Softw., 2012, 49, 1–22 Search PubMed.
- R. Lucas, T. McMicheal, W. Smith and B. Armstrong, Environmental Burden of Disease Series, No. 13, World Health Organization, Geneva, Switzerland, 2006 Search PubMed.
- A. Fourtanier, D. Moyal and S. Seite, Photochem. Photobiol. Sci., 2012, 11, 81–89 CrossRef CAS PubMed.
- X. Chen, D. S. Larsen, S. E. Bradforth and I. H. M. van Stokkum, J. Phys. Chem. A, 2011, 115, 3807–3819 CrossRef CAS PubMed.
- K. Koizumi, M. Hatakeyama, M. Boero, K. Nobusada, H. Hori, T. Misonou and S. Nakamura, Phys. Chem. Chem. Phys., 2017, 19, 15745–15753 RSC.
- R. Losantos, I. Lamas, R. Montero, A. Longarte and D. Sampedro, Phys. Chem. Chem. Phys., 2019, 21, 11376–11384 RSC.
Footnotes |
| † The underlying data of this publication can be accessed via the Zenodo archive at DOI: https://doi.org/10.5281/zenodo.7158236. |
| ‡ Electronic supplementary information (ESI) available. See DOI: https://doi.org/10.1039/d2cp05934g |
| This journal is © the Owner Societies 2023 |