 Open Access Article
Future of computational molecular spectroscopy—from supporting interpretation to leading the innovation
Feng
Wang

Department of Chemistry and Biotechnology, School of Science, Computing and Engineering Technologies, Swinburne University of Technology, Melbourne, Victoria 3122, Australia. E-mail: fwang@swin.edu.au
First published on 24th February 2023
Abstract
Molecular spectroscopy measures transitions between discrete molecular energies which follow quantum mechanics. Structural information of a molecule is encoded in the spectra, which can be only decoded using quantum mechanics and therefore computational molecular spectroscopy becomes essential. In this review perspective, the role evolution of computational molecular spectroscopy has been discussed with several joint theory and experiment spectroscopic studies in the past decades, which includes rotational (microwave), vibrational and electronic spectroscopy (valence and core) of molecules. With the development in high resolution and computerized synchrotron sourced spectroscopy, spectral measurements and computational molecular spectroscopy need to be integrated for materials development. Contemporary computational molecular spectroscopy is, therefore, more than merely supporting interpretation but leading the innovation. Future development of molecular spectroscopy lies to identify the niche to integrate experimental and computational molecular spectroscopy. It also requires to engineer molecular spectroscopic databases that function according to the universal approaches of computing, such as those in a Turing machine, to be realized in a chemical and/or spectroscopic programable manner (digital twinning research) in the future.
Introduction
Molecular spectroscopy is a non-invasive technique to measure the electronic structure of a molecule through interactions that occur between the molecule and electromagnetic radiation.1 Structural elucidation of a new or known compound used to be a long process.2 With the development of high performance computers, contemporary spectroscopic techniques have significantly reduced the time and efforts required to determine the structure of compounds. The perspective review article will concentrate on small and medium sized organic and biomolecules including natural products (under 100 atoms) in gas phase and solution. An integration of several spectroscopic techniques, such as nuclear magnetic resonance (NMR), infrared (IR) spectroscopy and ultraviolet and visible (UV-Vis) spectroscopy has been equipped in laboratories for structure determination. Yet, the structure elucidation of new compounds synthesized, or natural products isolated still requires flow of structural revisions when higher resolution spectroscopy or more accurate computational methods (and high-performance computers) become available. In this review perspective, I concentrate on small and medium sized organic (e.g., building blocks of drugs), biomolecules (amino acids, DNA bases and small molecule inhibitors) and ferrocene based organometallic compounds, which were studied in the past decades in close collaboration with experimental spectroscopy including synchrotron-based spectroscopy. Computational molecular spectroscopy (CMS) in this article is broadly defined as applications of quantum mechanics and digital technology to molecular spectroscopy.Molecular spectroscopy is measurable quantum mechanics. Molecular spectroscopy is to measure transitions between unique energy states and quantum mechanics calculates the states through solving the Schrödinger equation. In quantum mechanics, the molecular Hamiltonian of the Schrödinger equation under Born–Oppenheimer approximation contains molecular rotation, molecular vibration and electronic terms (and their interactions). Molecular spectra can be obtained due to transitions between rotational states, vibrational states and electronic states of the molecule. Rotational spectroscopy (microwave (MW) and millimeter wave region) provides accurate and reliable information on the structures of polar molecules in gas phase,1 more accurate in the region around bottom of the potential energy well. Fig. 1 gives the composite spectrum of the JKa,Kc = 20,2 − 10,1 rotational transition of 20Ne–14N2 Van der Waals (VdW) complex.3 Rotational (MW) spectroscopy is useful to establish the approximate dimension of a compound from three rotational constants of a molecule (A, B and C), energy barriers to internal rotation such as conformers of a flexible molecule, as well as hyperfine structure of molecules. Much of the understanding of the nature of weak molecular interactions such as VdW complexes,3,4 interstellar molecules and hydrogen bonding has been established through rotational spectroscopy. “Molecular rotational spectra”5 by the Nobel Laureate HW Kroto details all aspects of the art of rotational spectroscopy. Rotational spectrum, however, is tedious and requires significant computer and CMS support and often needs to combine with other techniques for structure determination. The 1998 Nobel Prize in Chemistry was awarded to two computational chemists, Walter Kohn “for his development of the density-functional theory” and John A. Pople “for his development of computational methods in quantum chemistry”.
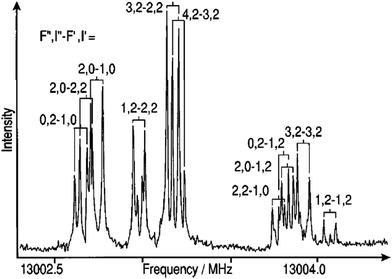 | ||
| Fig. 1 A composite spectrum of the JKa,Kc = 20,2 − 10,1 rotational transition of 20Ne–14N2 van der Waals complex showing complicated nuclear hyperfine structure due to the 14N nuclei.3 The missing rotational transitions were recovered from the new measurements guided by CMS. | ||
Molecular rotation and vibration are often compounded. Transitions involving changes in both vibrational and rotational states can be abbreviated as rovibrational (or ro-vibrational) transitions. Vibrations are relative motions of the atomic nuclei and are studied by both infrared (IR) and Raman spectroscopy. The theory of rotational energy spectrum was developed to account for observations of vibration-rotation spectra of gases in IR (400–4000 cm−1) or far-IR (<400 cm−1) spectroscopy (the latter is in the region of Terahertz (THz) spectroscopy6). If Coriolis coupling is very small, rotation and vibration can be treated as separable (at first approximation), so that the energy of rotation is added to the energy of vibration.7 Vibrational spectroscopy is useful for information about the presence or absence of particular functional groups, and the IR molecular fingerprint can be employed to identify samples.8Fig. 2 compares the theoretically calculated IR spectra of the N2–Ar VdW complex with measurements to test the accuracy of the potential energy surface inversely.9 IR spectroscopy is accessible for almost all materials, the measurements which require small amount of sample are easy, fast and less expensive. IR spectroscopy is for polar compounds,9–11 however. It does not provide information for molecular formula and usually needs to be employed in conjunction with other techniques.12
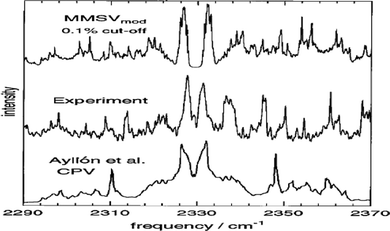 | ||
| Fig. 2 Comparisons between experiment13 and simulated 77 K mid-IR spectra of N2–Ar van der Waals complex generated using the MMSV mod9 and CPV14 potential energy surfaces. The measured IR spectrum was employed to validate model development. | ||
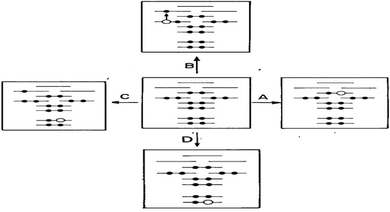
Transitions between electronic states are measured using electron spectroscopy. Fig. 3 is a scheme for electronic processes and their measurements using various electron spectroscopies. This perspective will concentrate on ionization and excitation spectroscopy of a molecule as they closely relate to the Fukui frontier molecular orbital theory and chemical bonding.15 If an electron is removed from valence orbitals of a molecule (<30 eV), photoelectron spectroscopy (PES) is the appropriate technique for binding energy spectral measurement, or electron momentum spectroscopy (EMS) is more appropriate if the shape of the Dyson orbital information is also needed.16 Combining PES and EMS with CMS will be able to reveal a comprehensive picture of the ionization states of a molecule. Such the combination provides the state of the art complementary advantages for accurate binding energy spectrum and related Dyson orbitals with conclusive structural information.17 On the other hand, if a valence electron does not leave the molecule but is excited into virtual unoccupied orbitals, such the electron excitations are studied using UV-Vis spectroscopy (190–1000 nm) as well as fluorescence spectroscopy (emission), which may be calculated using time-dependent density functional theory (TD-DFT) in CMS. UV-Vis spectroscopy is also called optical spectroscopy which is sensitive to environment for optical reporting of chromophores with applications in solar cell and drug research.
The 1901 Nobel Prize in Physics is to Wilhelm Conrad Röntgen for his discovery of X-ray as the “magic ray”. For ionization (excitation) spectroscopy in which an electron is removed or excited from core orbitals of a compound, it requires high energy source such as synchrotron sourced spectroscopy. The former (core ionization) is measured using for example, X-ray photoelectron spectroscopy (XPS) in the energy range > ∼180 eV for B1s (as H and He do not have core electrons). The latter can be X-ray absorption spectroscopy (XAS) or near edge X-ray absorption spectroscopy (NEXAS), which approximately refer to C and D processes illustrated in Fig. 3. XPS which is also called electron spectroscopy for chemical analysis (ESCA), enables to explore the structure of an atom outside the nucleus locally. As a result, XPS also determines the chemical state of elements including the nature of chemical bonding, providing local information of a particular region in a molecule. Hence, XPS has wide applications in organic molecules such as drugs and inorganic compounds such as catalysts and other materials. Together with the information about the valence energy levels as secured by the other related spectroscopy, XPS provides localized picture of the atom outside the nucleus of materials for chemical bonding and oxidation.18
Another routine spectroscopic technique in laboratories is NMR spectroscopy, which becomes a tool of choice to probe chemical structures as NMR is fast, non-destructive, and non-invasive means for the observation. A small variation in NMR frequency (i.e., the chemical shift) is a result of a variation in molecular electron distribution due to chemical environment so that NMR is able to assign previously unknown molecular structures. An important advantage of NMR is to provide atom specific information which is useful to study chemical bonding and impact of the local chemical environment. For these reasons, when combining with CMS, NMR spectroscopy can be applied to study stereochemistry such as conformation and hydrogen bonding (HB) interactions. This perspective will discuss structure and property determination using rotational, vibrational, electronic and nuclear magnetic resonance (NMR) spectroscopy, their integration with CMS as well as the role changing of CMS in the process.
Structural elucidation and revision
Molecular spectroscopy is an indirect technique for structure elucidation. The structural information of a molecule is encoded into often tedious spectroscopic information which sometimes leads to ambiguous results. Errors in compound structural determination are not uncommon when a compound is flexible and engages with large number of conformers or enantiomers such as bioactive compounds. This situation can be more difficult if it is compounded with limitations of particular spectroscopic techniques such as resolution and measurement conditions such as dynamics, environment and temperature. The sources of structural misassignment errors can be very diverse. CMS has certainly more than merely three roles of interpretation, complementarily, and prediction and support experiments as summarized by a recent review.1 Rather, CMS enables a flow of constant revision of results, guidance, suggestion of new experiments and leading the innovation. As a result, integration of several techniques guided by CMS is essential in the structural determination of molecules.Accuracy matters. It is critical to obtain accurate information of the constitution, stereochemistry, and conformation of drug candidates or bioactive compounds.2 Spectroscopic methods have been one of the major techniques for flexible drug-like natural products.19 With the development of powerful high resolution spectroscopic techniques such as computerized synchrotron sourced spectrometers, more accurate information becomes available. Such information is able to reveal pitfalls with incorrect structural elucidation and sometimes misleading structures of often flexible bioactive compounds.2 In some cases more accurate measurements or information might change earlier conclusions. For example, XPS studies revealed that intramolecular hydrogen bonding impacts on core electrons20,21 and significant differences appear in the core electrons for purine and pyrimidine DNA bases even though adenine and purine share the same molecule skeleton.22–24 Hence, there has been a constant need to flow the structural revision and update. In a recent review, Shen et al. surveyed the literature from the past decade (2010–2020) and identified over 200 cases of misassigned natural products.2 Among the errors presented, NMR misassignment errors are on the top (23%).2Fig. 4 reports the numbers of revised and new natural products in the past decade. The advantages of computer-assisted and theory supported structural revision (broadly CMS) or a combination of methodologies (computer-aided calculation, NMR spectroscopy, empirical rules, X-ray crystallography, and biosynthetic studies) has been recognized.25
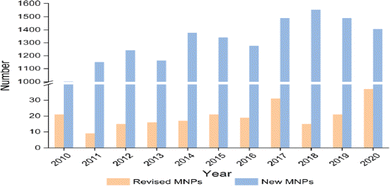 | ||
| Fig. 4 The numbers of revised and new natural products in the past decade (2010–2020).2 Here MNPs refer to molecular natural products. | ||
Joint CMS and experimental measurements, i.e., synchrotron sourced spectroscopy is critical as they act like the two wheels of a bicycle. Often, spectroscopic measurements validate the quantum mechanical models used in CMS which is able to provide more insight beyond the measured spectra of the compounds, enabling the result to achieve 1 + 1 > 2. In next sections, some examples combining experimental measurements with CMS to achieve deeper insight beyond spectroscopy are presented in the order of (ro-vibrational) spectroscopy, electron spectroscopy, NMR spectroscopy and optical (UV-Vis) spectroscopy.
Microwave and infrared spectroscopy
Vibrational spectroscopy such as (far) IR spectroscopy are often used to identify functional groups such as –OH and C![[double bond, length as m-dash]](https://www.rsc.org/images/entities/char_e001.gif) O for structural elucidation when oxygen atoms present in the molecule, rather than in the determination of the backbone structure for a compound. In early dates, experiments were largely relied on the trial-and-error strategy so that search for spectroscopic signals was a time consuming and tedious physical task. It was not uncommon to miss some signals due to incomplete prior estimated search range. In 1990s, for example, microwave (MW) spectroscopy was the state-of-the-art technique to study and to validate potential energy surface and other properties of diatom-noble gas atom Van der Waals (VdW) complexes such as N2-RG (RG = He, Ar, Kr and Xe).26 The study of MW spectrum of the N2–Ne VdW complex was not publicly available and Ne was missed from the list of noble gas atoms. It was later revealed by a joint CMS and experiment study that two of the lower frequency signals of the 20Ne–14N2 complex were missing in the earlier FTMW measurement, as the estimate signal search range was incomplete due to the unique reduced mass of N2–Ne complex. A new measurement guided by CMS is achieved.3
O for structural elucidation when oxygen atoms present in the molecule, rather than in the determination of the backbone structure for a compound. In early dates, experiments were largely relied on the trial-and-error strategy so that search for spectroscopic signals was a time consuming and tedious physical task. It was not uncommon to miss some signals due to incomplete prior estimated search range. In 1990s, for example, microwave (MW) spectroscopy was the state-of-the-art technique to study and to validate potential energy surface and other properties of diatom-noble gas atom Van der Waals (VdW) complexes such as N2-RG (RG = He, Ar, Kr and Xe).26 The study of MW spectrum of the N2–Ne VdW complex was not publicly available and Ne was missed from the list of noble gas atoms. It was later revealed by a joint CMS and experiment study that two of the lower frequency signals of the 20Ne–14N2 complex were missing in the earlier FTMW measurement, as the estimate signal search range was incomplete due to the unique reduced mass of N2–Ne complex. A new measurement guided by CMS is achieved.3
When CMS and FTIR measurement work together, the applications of vibrational spectroscopy can be extended. One example is to use the measured far-IR spectra of N2–Ar to study the theoretical models of the potential energy surface as shown in Fig. 2,9 and the theoretically developed dipole moment function of the VdW complex.10 The nitrogen diatomic molecule (N2) does not possess a permanent dipole moment, so that the IR active spectral transitions of the complex are produced due to small induction and dispersion effects of the Ar atom interacting with the N2 diatom.10 Another CMS leading innovation case is the decade long theory guided (synchrotron sourced) spectroscopic study of ferrocene (Fc).27–37 The theoretical IR spectral discovery of the more stable Fc eclipsed conformer (D5h)27 shed a light on Fc studies, led and suggested several new measurements of Fc and its derivatives.38 In the seminal theoretical IR study of Fc, it conclusively revealed that Fc eclipsed (D5h) and staggered (D5d) conformers exhibit their unique IR fingerprints in the region of 400–500 cm−1.27 That is, the IR band of Fc staggered (D5d) conformer does not split (the splitting of δ = 2 cm−1 is sufficiently small not to be measured), whereas the band splits (δ = 17 cm−1) in the same region for Fc eclipsed (D5h) conformer is measurable in almost all IR spectral measurements available. This includes the amazing IR measurement of Lippincott and Nelson half century ago, the IR spectra were, unfortunately, assigned to the less stable staggered (D5d) Fc conformer39 due to lack of accurate quantum mechanical support at spectroscopic accuracy. It was further discovered that any modifications to the unsubstituted staggered Fc ((C5H5)2Fe) result in such IR band splitting.32–37 The Fc IR spectral fingerprint is so far the unique technique which conclusively differentiates Fc eclipsed and staggered conformers.27 The Fc IR fingerprint band27 in Fig. 5 further discovered that any vibrations involving the center Fe atom of Fc are sensitive to the conformation, eclipsed or staggered. This discovery of Fc has led to a decade long of study of Fc and derivatives.28–37
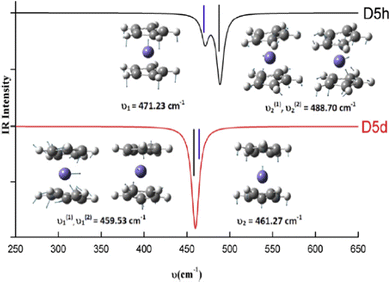 | ||
| Fig. 5 The fingerprint IR spectral bands of the eclipsed (D5h) and staggered (D5d) ferrocene.27 The vibrations including the center Fe atom in Fc are sensitive to the conformation of eclipsed or staggered. | ||
IR spectroscopy when integrating CMS with measurements can also be used to reveal inter and intra molecular hydrogen bonding through IR frequency red-shifts40 and blue shifts.41 It was found that the A–H stretch in an A–H⋯B complex redshifts (Δν) between 20 to 2500 cm−1 relative to the free molecule without such hydrogen bonding. The correlated hydrogen-bond length (rH⋯B) increases between 0.28 and 0.12 nm.40 IR frequency blue-shifted hydrogen bonding is also called improper hydrogen bonding.41,42 When a molecule is involved in intermolecular bonding, the electric field from the hydrogen acceptor is sufficiently strong at the intermolecular equilibrium distance and the chemical bonds are strengthened and shortened, the stretching vibrational frequency will blue-shift (upshift).42 Often, both IR frequency redshift and blueshift were studied related to intermolecular hydrogen bonding interactions, in which the monomers without such hydrogen bonding serve as the reference for the shift. However, hydrogen bonding redshift and blueshift can also be employed to study intramolecular hydrogen bonding—the isomers/conformers of a (larger) molecule without local hydrogen bonding may serve as the reference.43,44Fig. 6 reports the intramolecular hydrogen bonding blue shift due to conformations of an anti-cancer drug zidovudine.44
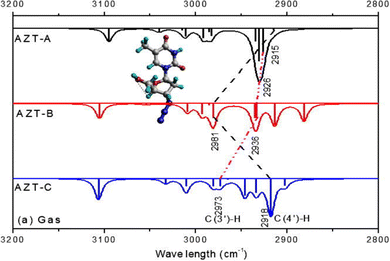 | ||
| Fig. 6 Hydrogen bonding blue shift of the simulated IR spectra for zidovudine conformers. The blue shifted C–H stretch frequencies of AZT-B νC(4′)–H).44 | ||
In addition, if the vibrational spectroscopic technique is able to detect differences in attenuation of left and right circularly polarized light passing through a sample, it extends to circular dichroism spectroscopy (in the infrared and near infrared ranges). It is called vibrational circular dichroism (VCD) spectroscopy which has applications for stereoisomers such as chiral molecules. As the VCD signals are very weak, it often requires CMS support.45 The VCD and Raman optical activity (ROA) spectroscopy have applications in bioactive compounds such as amino acids.46 Recent development into multi-dimension and finer region such as two-dimensional (2D) IR spectroscopy (2D IR)47 and terahertz (THz) technology based on radiation between MW and IR,6 requires more significant computational molecule spectroscopy including modelling and computer digital technology support.
Photoelectron spectroscopy and electron momentum spectroscopy
In this section, valence electron ionization spectroscopy is discussed. As indicated in Fig. 3 valence electron processes are indicated as A—PES/EMS (valence ionization) and B—UV-Vis (valence excitation). Ionization process (A) is very important to study electronic structure of a molecule and its oxidation, as it well connects to molecular orbital theory. Kenichi Fukui shared the 1981 Nobel Prize in Chemistry with Roald Hoffmann “for their theories, developed independently, concerning the course of chemical reactions.” The measurement of PES alone provides the binding energy and their intensity of a molecule, which does not provide a conclusive assignment for the binding energies without CMS guidance and support. Often the assignment of PES binding energies of a molecule depends on the accuracy of quantum mechanical model for the calculation. For example, the most recent synchrotron sourced PES measurements of norbornadiene (NBD) and quadricyclane (QC)48 do not provide assignment to the binding energy spectra. The theoretical PES (dashed spectra) of NBD and QC in Fig. 7 are the early quantum mechanical calculation of NBD,49,50 from which the same quantum mechanical method was used to calculate the binding energies for QC. For example, the PES in the low energy region IP < 11 eV of NBD exhibits two spectral bands whereas the same region of QC has three bands, both are contributions from four outer valence orbitals of each isomer. The assignment of the PES energies in the outer valence regions of NBD and QC is not unique, however, as the energies of the outer valence orbitals may change their configuration (energy order of valence orbitals), depending on the accuracy of quantum mechanical methods in the calculation. Obviously, other techniques or properties of the compounds are needed.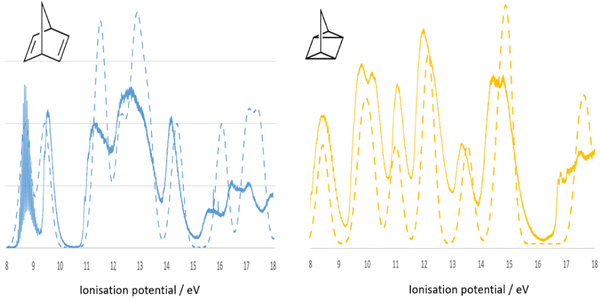 | ||
| Fig. 7 Comparison of simulated (dashed line) and the recent synchrotron sourced measured48 (solid spectra) binding energy spectra of NBD (blue) and QC (orange). The dashed spectra are calculated using the same method for NBD49,50 and for QC. | ||
Electron momentum spectroscopy (EMS) is an (e, 2e) reaction under binary encounter collision conditions.16 EMS effectively probes valence electron (frontier orbital) transfer out of a molecule, providing images of the spherically averaged Dyson orbital electron momentum density distribution, i.e., triple differential cross sections (TDCS) corresponding to the ionization process.16 Hence, EMS is capable of producing a series of binding energy spectra (PES) under different azimuthal angle ϕ's, at ϕ = 0° (at momentum p ≈ 0.0 au) and ϕ ≠ 0°, say, ϕ = 10° (at p ≈ 0.92 au),49 by sitting at the Sun paths (i.e., spherical coordinates). The azimuthal angle ϕ is congruent with the solar azimuth.16 As a result, EMS is the technique which measures both binding energy and Dyson orbitals (in momentum space).17,51 Combining the information from PES, EMS and CMS, one may determine the frontier Dyson orbitals conclusively.17 The combination of PES/EMS and CMS helps to elucidate the NBD ⇆ QC isomerization information in energy storage which will be discussed elsewhere.
The EMS spectroscopy is developed from atomic applications.16 Atoms have a single spherical centre whereas molecules are multiple centres and their properties can be very different. Upon ionisation, the Dyson orbital momentum distributions of an s-orbital and a p-orbital in an atom is observed in half-bell shape and bell shape, respectively, such as the s- and p-Dyson orbitals of neon.52 It was discovered in a theoretical EMS study of diborane (B2H6), that the shape of Dyson orbital TDCS for s-dominant Dyson orbitals (1b2u, and 2b1u) is bell shape rather than the expected half-bell shape for s-orbitals.53Fig. 8 gives the quantum mechanically calculated three s-dominant Dyson orbital TDCS, 1b2u, 2b1u and 2ag of diborane,53 which exhibit half bell shaped Dyson orbital (2ag) and bell shaped Dyson orbitals (1b2u, and 2b1u). This discovery revealed that the shape, half-bell or bell, of a Dyson orbital TDCS is not determined by s or p orbitals but the orbital nodal point/plane of a Dyson orbital. The TDCS of a Dyson orbital may exhibit a half-bell shape if the orbital has no nodal planes such as the s-orbitals of an atom; and a bell-shape if the orbital has a single nodal plane such as the p-orbital of an atom or anti-bonding s-dominant (σ*-orbitals) of a diatomic molecule or polyatomic molecule with high point group symmetry like diborane.53
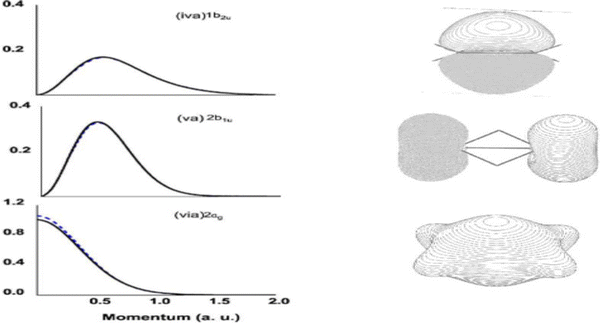 | ||
| Fig. 8 Dyson orbital TDCS (left) of 1b2u, 2b1u and 2ag of diborane in the ground electronic state.53 All three Dyson orbitals are dominated by s-electrons but shape is different due to the number of nodal planes. | ||
The unique advantages of EMS to probe Dyson orbitals of a molecule make significant contributions to study anisotropic properties related to orbitals of molecules. Quantum mechanical methods often focus on energy such as the variational methods, which treat anisotropic properties including orbitals less important. Most post-Hartree–Fock (HF) methods such as MP2 and CCSD(T) methods do not produce sufficiently accurate information for orbitals (or wavefunctions) of the molecule at the same level of accuracy like energy. Post-HF methods usually produce post-HF (more accurate) energies but HF wavefunctions (orbitals) of a molecule. Density functional theory (DFT) in this regard, is able to provide more accurate information through the density of the Dyson orbitals (assuming that Kohn–Sham orbitals are approximately Dyson orbitals). As a result, the EMS technique is able to provide information of both energy and wavefunction (Dyson) of a molecule.16 It is, therefore, a more appropriate technique to test quantum mechanical methods in conjunction with CMS.17 In addition, when working with CMS, EMS is a unique method to study anisotropic properties such as conformation and pseudorotation of tetrahydrofuran (THF).54–56
X-Ray photoelectron spectroscopy and nuclear magnetic resonance spectroscopy
Core electron processes of a molecule, which are indicated as C—XAS (core-valence excitation) and D—XPS/ESCA (core ionization) in Fig. 3, require high energy sources such as synchrotron sourced spectroscopy, and significant CMS and quantum mechanical information. It is discovered that qualitative chemical knowledge/intuition maybe applied to study molecules with aliphatic carbon framework such as aliphatic amino acids,57 whereas compounds with aromatic rings such as DNA/RNA bases and their tautomerization must be analysed quantitatively using quantum mechanics.23,58 The N1s XPS (nitrogen core electron binding energy spectrum) of cytidine (C9H13N3O5) is an example that CMS and measurements must work together.59,60 Cytidine is a nucleoside bioactive compound consisting of a cytosine (base) and deoxyribose (sugar). Using XPS to study cytidine provides local atom specific information of oxidation for radiation damages to bioactive molecule.59 Two of three N atoms of cytidine locate on the aromatic cytosine ring and one N atom is outside the ring connected through an N–C bond. The N1s XPS spectrum of cytidine was measured for two signals with the 2![[thin space (1/6-em)]](https://www.rsc.org/images/entities/char_2009.gif) :
:![[thin space (1/6-em)]](https://www.rsc.org/images/entities/char_2009.gif) 1 ratio.59 Two N1s signals are closely located which was assigned to the Ns on the cytosine ring qualitatively.59 However, a further CMS study revealed that the positions of the N1s XPS signals are not determined by the positions of the N atoms on or out of the cytosine aromatic ring but the bonding—whether the Ns are in saturated single bonds (N–C) or unsaturated double bond (N
1 ratio.59 Two N1s signals are closely located which was assigned to the Ns on the cytosine ring qualitatively.59 However, a further CMS study revealed that the positions of the N1s XPS signals are not determined by the positions of the N atoms on or out of the cytosine aromatic ring but the bonding—whether the Ns are in saturated single bonds (N–C) or unsaturated double bond (N![[double bond, length as m-dash]](https://www.rsc.org/images/entities/char_e001.gif) C).60,61
C).60,61
Bioactive compounds can be unstable at higher temperatures (vaporisation) or experience chemical reactions during measurements. It is critical to combine XPS measurements with CMS. The analysis for the XPS measurements of a dipeptide, phenylalanyl–phenylalanine (PhePhe)62 demonstrated the importance of support and guidance from CMS. The quantum mechanically calculated XPS for the dimer (dipeptide PhePhe) and monomer (phenylalanine) are shown in Fig. 9(a) and the actual gas phase measured XPS spectra are given in Fig. 9(b).
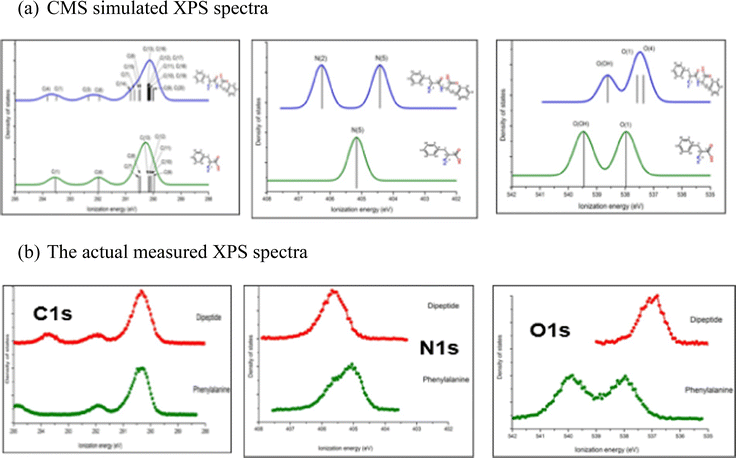 | ||
| Fig. 9 (a) The CMS simulated C1s, N1s and O1s spectra of phenylalanine monomer and linear phenylalanyl–phenylalanine (dipeptide) and (b) the actually measured XPS spectra.62 | ||
The XPS spectra for PhePhe dipeptide sample in Fig. 9(a) exhibit multiple bands for C1s spectrum, double bands with approximately equal ratio (1![[thin space (1/6-em)]](https://www.rsc.org/images/entities/char_2009.gif) :
:![[thin space (1/6-em)]](https://www.rsc.org/images/entities/char_2009.gif) 1) for N1s spectrum and two bands with 1
1) for N1s spectrum and two bands with 1![[thin space (1/6-em)]](https://www.rsc.org/images/entities/char_2009.gif) :
:![[thin space (1/6-em)]](https://www.rsc.org/images/entities/char_2009.gif) 2 ratio for O1s spectrum. If the sample, on the other hand, were a monomer phenylalanine amino acid, the XPS would exhibit multiple bands for C1s spectrum, single band for N1s spectrum and double bands with equal 1
2 ratio for O1s spectrum. If the sample, on the other hand, were a monomer phenylalanine amino acid, the XPS would exhibit multiple bands for C1s spectrum, single band for N1s spectrum and double bands with equal 1![[thin space (1/6-em)]](https://www.rsc.org/images/entities/char_2009.gif) :
:![[thin space (1/6-em)]](https://www.rsc.org/images/entities/char_2009.gif) 1 ratio for O1s spectrum. However, the measured XPS C1s, N1s and O1s spectra in Fig. 9(b) are neither the spectra of phenylalanine monomer nor the PhePhe dimer (the dipeptide). It was discovered later that the sample PhePhe dipeptide experienced dehydration in the vacuum chamber of the spectrometer duration vaporisation, resulted in cyclo-PhePhe dipeptide as such,
1 ratio for O1s spectrum. However, the measured XPS C1s, N1s and O1s spectra in Fig. 9(b) are neither the spectra of phenylalanine monomer nor the PhePhe dimer (the dipeptide). It was discovered later that the sample PhePhe dipeptide experienced dehydration in the vacuum chamber of the spectrometer duration vaporisation, resulted in cyclo-PhePhe dipeptide as such,
The above proposed dehydration process of PhePhe was confirmed by joint CMS and measurement,62 as given in Fig. 10.
 | ||
| Fig. 10 The C1s, N1s and O1s spectra of the measured and simulated spectra of the cyclo-dipeptide c(phenylalanyl–phenylalanine).62 | ||
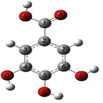
It presents a challenge that spectroscopic results/databases need to be reproducible and future verifiable, whereas information is constantly improving and updating as the development of the technique and our knowledge. Some early conclusions made based on the available information at the time, which limited our understanding, need updating, revision and even overturning. Information provided by high resolution XPS of molecules in gas phase disturbs the concept in chemistry that core electrons do not participate in chemical bonding and changes the concept that hydrogen bonding is a valence effect for hydrogen atoms without core electrons. Recent joint CMS and XPS studies reveal that intramolecular hydrogen bonding (O⋯H) deeply impacts to core electrons (O1s) of molecules.63 Combining the measured O1s XPS (for hydrogen acceptor) and 1H-NMR (for hydrogen donor) with quantum mechanics, intramolecular hydrogen bonding (O⋯H) of molecules can be studied locally.64 In addition, XPS provides core electron ionization of a molecule which localised on specific atoms. Although the mechanisms are different, the C1s (and/or N1s) XPS can be combined with 13C-NMR (or N-NMR) chemical shift for more comprehensive local chemical bonding information. Comparing to XPS, C-NMR chemical shifts are less difficult to measure and to calculate quantum mechanically. For this reason, computational XPS and NMR calculations can be employed to study conformers and intramolecular hydrogen bonding, which helps the determination of the conformer distributions.65,66 In the NMR study of gallic acid conformers, CMS calculated C-NMR chemical shifts of theoretically possible conformers indicate that the C-NMR chemical shifts can be employed to study intramolecular hydrogen bonding of conformers, as indicated in Fig. 11.66 The conformers are formed by rotations of the hydroxyl and carbonyl groups through the C–O and C–C bonds. As indicated by the colour scheme in this figure, intramolecular hydrogen bonding interactions reveal by the chemical shift with Δδ ≠ 0 of the carbon pairs δ(C(7)) and δ(C(3)) and Δδ′ Δδ ≠ 0 of the carbon pairs δ(C(4)) and δ(C(6)). These carbons do not locate on the axis connecting C(1)–C(2)–C(5)–O(D) as shown in the gallic acid structure in Fig. 11 (the vertical dashed line).
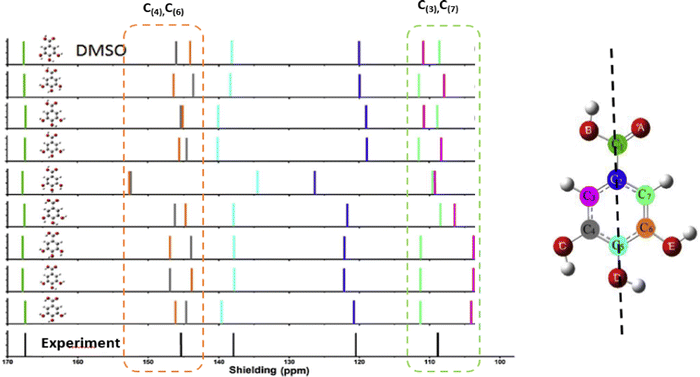 | ||
| Fig. 11 Comparison of calculated 13C NMR spectra of gallic acid conformers66 with NMR experiment in dimethyl sulfoxide (DMSO) solvent.67 Note that the vertical dashed line on the structure on the right represents the molecular axis of the gallic acid. | ||
The calculated and measured C-NMR spectra in Fig. 11 reveal that the carbon chemical shifts of the gallic acid conformers are not the same, reflecting their unique conformer chemical environments. Comparison of the CMS simulated C-NMR with the measurement indicates approximately which gallic conformer maybe dominant through, for example, the root-mean square deviation (RMSD). However, the identical carbon chemical shifts in δ(C(7)) and δ(C(3)), and in δ(C(4)) and δ(C(6)) given in the C-NMR measurement,67 is untrue.66 This is due to the fact that NMR spectroscopy associates with slower time scale than rotations (flipping about the axis in Fig. 11). As suggested by Bryan when interpretation NMR time scale, the phenol ring flipping process is apparently faster than the chemical shift difference between the two NMR resonances—for carbon NMR, it's approximately 1.5 milliseconds (1 ms = 10−3 s).68 The phenol ring flipping is approximately in the time scale of femtosecond (1 fs = 10−15 s).69 As a result, chemical shifts of atoms on the aromatic ring symmetric to the axis of C(1)–C(2)–C(5)–O(D) are averaged in the NMR measurements as also found in a study of an active pharmaceutical ingredient resverotrol.70 Finally, care must be taken in the assessment of the accuracy of calculated NMR chemical shifts with respect to NMR measurement. Sometimes the RMSD is not necessarily an appropriate indicator of the accuracy of the calculations. For example, the C-NMR measurement of gallic acid is unable to resolve the “equivalent” carbons. Table 1 compares the calculated and measured C-NMR chemical shifts in the same dimethyl sulfoxide (DMSO) solvent. In the measurement, the chemical shifts of C(3) and C(7) are the same, both 109.14 ppm; so do the chemical shifts of C(4) and C(6), both 144.94 ppm. To this end low temperature dynamic nuclear polarization (DNP)-enhanced solid-state NMR supported by CMS is required.71
| Atomic sites | C-NMR(cal)/ppm | C-NMR (expt)/ppm |
|---|---|---|
| a Calculations using B3PW91/6-311++G(d,p) method for the most stable conformer of gallic acid. b The averaged chemical shift of C(3) and C(7) is 109.75 ppm, which is close the to the measured of 109.15 ppm of Rajan et al.67 c The averaged chemical shift of C(4) and C(6) is 145.14 ppm, which is close to the measured 144.94 ppm of Rajan et al.67 | ||
| C(7) | 108.58b | 109.14 |
| C(3) | 110.91b | 109.14 |
| C(2) | 120.05 | 120.81 |
| C(5) | 138.23 | 137.77 |
| C(4) | 144.15c | 144.94 |
| C(6) | 146.12c | 144.94 |
| C(1) | 167.74 | 167.39 |
Optical (UV-Vis) spectroscopy
Perhaps pharmaceutical and energy materials studies are among the most beneficial sectors from applications of computational molecular spectroscopy (CMS). In recent years, computer-aided drug design is of paramount significance to the design of lead compounds and has achieved great progress in recent years in small molecule drugs. When combining with digital technology, CMS could increase efficiency in the various processes involved and reduce barriers between the multiple research cultures in the ecosystem to create new medicines.72 In addition to computer screening and machine learning (ML) in drug/materials discoveries, optical (spectral) reporting for potency related drug conformation and rational design of organic dye sensitised solar cells (DSSC) are briefly discussed here.Photophysical studies have recently received much attention, since optical spectra are very sensitive to the changes in microenvironment.73 A quarter of cancers links to mutation or over-expression of protein tyrosine kinases such as the epidermal growth factor receptor (EGFR). The functioning of many oncogenic proteins depends on kinase-catalysed phosphorylation; hence blocking tyrosine kinase activity in tumour cells has been a promising strategy to halt tumour growth.74 As environment-sensitive fluorophores, quinazoline derivatives are a special class of chromophores that could allow for deeper understanding of biological binding and function of candidate EGFR tyrosine kinase inhibitors (TKI). The TKIs have different biological activities when installing (click chemistry) various active groups to the quinazoline core using synthetic methods, which have potential applications in biology, pesticides and medicine.75 Of the quinazoline derivatives, anilinoquinazolines are the most developed class of drugs that inhibit EGFR kinase intracellularly,76 and drug candidates in this class have already reached various phases of clinical trials, such as Gefitinib, Erlotinib, Lapatinib, Afatinib, Vandetanib, Icotinib, Dacomitinib (PF-00299804), PD150335 and AG-1478.
Anilinoquinazolines can demonstrate changes in electronic configuration upon binding to target proteins, hence acting as biological marker for screening small molecule inhibitors.77 While these studies are very encouraging, some cancers appear to develop resistance to long-term TKI treatment. Hence, understanding the spatial and temporal distribution of TKI is therefore of paramount importance to reveal whether and how these drugs are binding to the target of interest. An important step in this process is to first determine whether the inhibitors have spectral signatures that might assist in determining the relevant targets and interactions.77 It is discovered that the measured UV-Vis spectra of an anilinoquinazoline TKI AG-1478 are sensitive to various solvents.77 A further CMS study reveals that the measured optical spectra of AG-1478 were from contribution of more than one conformers and a twist of the -NH- bridge of AG-1479 contributes to the changes of the optical spectra.78Fig. 12 reports the measured UV-Vis spectra of an anilinoquinazolines TKI AG-1478 in various solvents77 and conformation of AG-1478 contribution revealed by the optical spectra in methanol solvent identified by CMS.78
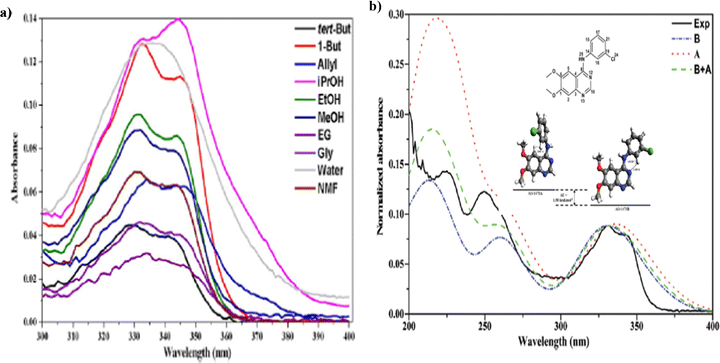 | ||
| Fig. 12 (a) The measured UV-Vis spectra of AG-1478 in various solvents (left).77 (b) Comparsion of measured and CMS calculated spectra of AG-1478 in methanol (right).78 | ||
Computational molecular spectroscopy (CMS) plays a significant role in the direction of drug conformation search. There are three major challenges in drug development summarised by Habgood et al.79 That is, (a) development of a good method to generate ensembles of a molecule's bioactive conformation; (b) rational analysis and modification of a pre-established bioactive conformation; and (c) approximation of real solution phase conformational ensembles in tandem with spectroscopic data such as IR, NMR and UV-Vis spectra. Further CMS studies of anilinoquinazoline TKIs with high potency (PD150335)80 reveal that optically reportable conformation of the TKI is often more potent than the planar global minimum structure of the TKI. It seems that a correlation with flexibility and potency of a TKI exists, as flexible TKI conformers are able to fit and dock in the TK domain of EGFR. To study flexibility of a drug requires conformational search on the potential energy surface1 and molecular dynamics (MD) simulation.81 Conformational sampling of drugs still represents major hurdles for effective drug design methods in CMS approaches,1,76,82 which is a prerequisite for data-hungry machine learning algorithms such as intelligent computing in drug development. A further challenge in the case of the flexible anilinoquinazoline TKIs is that a large number of preferred conformers needs to be considered. As a result, a robust comprehensive conformational search with high-quality results and computational efficiency is required. The robust PreQMCom system is therefore developed.82 This robust computer script PreQMCom reduces the period of manual quantum mechanical calculations from years to weeks, produces hundreds of conformers of AG-1478 in dimethyl sulfoxide (DMSO) solvent and the low energy conformer clusters of the AG-1478 TKI are given in Table 2.
| Cluster (conformer) | Strain energy (kcal mol−1) | Dipole moment (Debye) | Cluster size | Weightb (%) |
|---|---|---|---|---|
| a The calculated total energy of global minimum AG-1478 conformer is −1392.755766 Eh. b Estimation of the probability distribution of a given conformer is in %. | ||||
| 1 | 0.000a | 8.4504 | 10 | 67.646 |
| 2 | 0.594 | 3.6481 | 11 | 26.819 |
| 3 | 1.975 | 8.1783 | 17 | 3.871 |
| 4 | 2.570 | 5.3047 | 11 | 0.900 |
| 5 | 2.933 | 11.1002 | 9 | 0.395 |
| 6 | 3.516 | 5.812 | 19 | 0.306 |
| 7 | 4.567 | 3.3103 | 12 | 0.032 |
| 8 | 4.631 | 4.6733 | 10 | 0.024 |
| 9 | 5.373 | 9.2452 | 5 | 0.003 |
| 10 | 5.970 | 4.3828 | 5 | 0.001 |
| 11 | 6.884 | 4.1492 | 6 | 0.000 |
| 12 | 6.898 | 4.4065 | 14 | 0.001 |
As indicated in Table 2, at each strain energy (energy above the global minimum energy conformer) cut-off, several AG-1478 conformers are degenerate or near-degenerate. The AG-1478 TKI is dominated by the lowest six clusters of AG-1478 conformers by Boltzmann weights (last column of Table 2) at given temperature.82 The simulated UV-Vis spectra of the lowest six clusters of AG-1478 conformers which are robustly simulated using the PreQMCom system82 are given in Fig. 13.
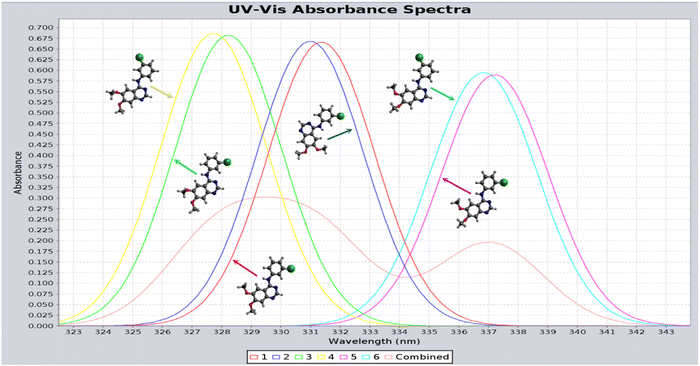 | ||
| Fig. 13 Calculated UV-Vis spectra of the lowest six preferred AG-1478 conformer clusters in DMSO solution.82 The combined spectrum (red) indeed shows the splitting bands as measured.77 | ||
Solar energy is the most promising renewable energy source for large-scale global electricity production particularly in Australia, which ships the sunshine to the world for clean energy export.83 Photovoltaic (PV) technology is one of the fastest growing renewable energy technologies in the world. The third generation of PVs includes organic solar cells and dye-sensitized solar cells (DSSC) in which the maximum reported efficiency has achieved 14.3% for DSSCs.84 Each component of the solar cell device heavily determines the cost, stability, and efficiency of DSSCs. Thus, in the past decade, almost all research efforts have focused on the modification of each component for practical applications. The sensitizers in DSSCs play a crucial role in gaining high solar-to-electricity conversion efficiency. Among a number of factors determination of the performance of DSSCs, two factors are critical, (a) wide absorption electromagnetic wavelength in the visible to near-infrared region, and (b) appropriate energy levels of molecular frontier orbitals that influence the thermodynamics in electron injection (from the excited state of the dyes to the conduction band of the semiconductor) and dye regeneration (from the redox mediator to the dye).84 CMS enhanced organic solar cells have been an essential tool to determine the rational and to guide further modification and improvement of high efficiency organic dyes. As a result, CMS UV-Vis spectroscopy represents the target properties for new organic dye development.85–87 as shown in Fig. 14.
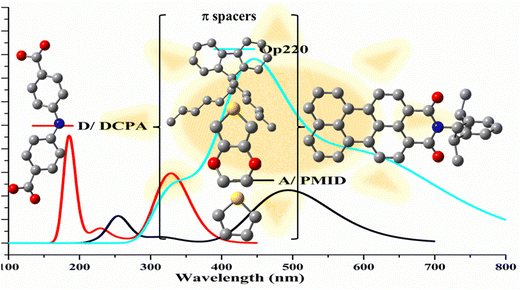 | ||
| Fig. 14 Design of high efficient organic dyes using π-spacers in A–π–D dyes toward machine learning.86,87 This strategy can be applied to acceptor (A) and donor (D) of the dyes. | ||
It has been a common practice in organic DSSC development that once a high performance dye is identified, which is often experimentally synthesized and confirmed, CMS combined with quantum mechanics is critical to work out the rational in structure–property relationship and to guide synthesis for new dyes in the class using click chemistry. The organic synthesis chemistry strategy leads to the 2022 Nobel Prize in Chemistry to Carolyn R. Bertozzi, Morten Meldal and K. Barry Sharpless for their development of click chemistry and bioorthogonal chemistry. In computational molecular spectroscopy, one can turn click chemistry from click “molecular Legos” in synthesis into click “computer mouse” in digital chemistry. Currently, the design of high-performance dye (this is also similar to drug design) has still relied on two main approaches: (a) conceptual ideas based on researchers’ chemical intuitions and (b) exploratory experiments based on a trial-and-error approach which leads to optimise numerous synthetic and spectroscopic parameters. The situation starts to change. Hopefully, combination of data available from both experiment and computation, application of the machine learning technique will accelerate the development in this direction.87–89
Conclusion and outlook
In this review perspective, the role evolution of computational molecular spectroscopy has been illustrated with examples in the past decades. Computational molecular spectroscopy plays more and more important roles from assistance of experiment for structure determination and interpretation to guiding information analysis for insight and to leading innovations. Structural information of a molecule is encoded in the properties and spectra, which can be only decoded using quantum mechanics and therefore computational molecular spectroscopy becomes essential in this regard. Moreover, as the development of high resolution and computerized synchrotron sourced spectroscopy, spectroscopic measurements and computational molecular spectroscopy must be an integrated tool for materials development, which becomes the new norm. It is often that the spectroscopic measurements take days and the analysis and insight take months and years. Spectral measurements and computational molecular spectroscopy (broadly quantum mechanics) are like the two wheels of a bicycle, which are essential to each other. Contemporary computational molecular spectroscopy is, therefore, more than merely supporting interpretation but leading new discoveries.Theory does not need to always agree with experiment. It took a long time for experiment to achieve the theoretical ionization energy of hydrogen atom of 13.6 eV, for example. In addition to the differences in methodology, such as experimental error bars and quantum mechanical approximations, experiment is a top down process (data and fit) and theoretical method is a bottom-up process (concepts and predict). The gap becomes smaller and smaller but will not disappear. Molecular spectroscopy measures the properties at vibrational ground state (r0), whereas the calculated properties are at the bottom of the potential energy well (re). The measurement conditions are often unable to be reproduced exactly in theory. Limitations to specific spectroscopic measurements such as time scale of NMR spectroscopy, the 1H-NMR chemical shifts of methyl (–CH3) often result in an averaged single band although three protons involve in different chemical environments.
Computational molecular spectroscopy should not be separated from experimental spectroscopic measurement. Rather, it is important to identify the niche to advance molecular spectroscopy from the development of quantum mechanics in a digital era. A spectroscopic technique usually concentrates on a particular property of a molecule rather than providing the full picture. One needs to avoid the trap of “six blind men and the elephant” due to the multi-dimensional and multi facets nature of structural information. Nature is replete with examples where the handling and storing of data occurs with high efficiencies, low energy costs, and high-density information encoding. Computational molecular spectroscopy takes the advantages of quantum mechanics and recent development in digital technology into the next stage of data base, digitalizing and machine learning, which requires that the complex spectroscopic data must be managed in a scalable, reproducible and future-proofed environment. Combining with molecular spectroscopic data science that function according to the universal approaches of computing, such as those in a Turing machine, might be realized in a chemically and/or spectroscopically programable manner (digital twinning research) in the future.
Conflicts of interest
There are no conflicts to declare.Acknowledgements
Sitting above the maze because we stand on the shoulders of giants. I would like to acknowledge my mentors, collaborators, postdoctoral fellows and postgraduate students for their advice, collaboration and contribution in the past decades. I wish to thank the late Nobel Laureate Sir HW Kroto for the guidance in his generous gift book “Molecular Rotation Spectra”; Professor EI von Nagy-Felsobuki for advice in vibrational spectroscopy and late Professor RJ Le Roy, Professor F McCourt and Professor M Garry for advice and collaboration in MW, far-IR and IR spectroscopy of VdW complexes; Professors FP Larkins and F Separovic for collaboration in X-ray spectroscopy and NMR spectroscopy, respectively; Professor E Weigold, late Professors I McCarthy and MJ Brunger for collaboration in EMS spectroscopy. I’d also like to thank my long-term friends and collaborators in my career, Professors DP Chong, K Prince, C Chantler, A Clayton, H Nakai, P Carloni and V Vasilyev for their enabling collaboration in synchrotron sourced X-ray spectroscopy, optical spectroscopy, quantum chemistry, machine learning and computer simulation. Finally, I’d like to express my appreciation for the kind invitation to compose this Perspective Review article by the Chair of the Editorial Board, Professor David Rueda (Imperial College London) of Physical Chemistry Chemical Physics (PCCP). The call is timely to help me to document the development of computational molecular spectroscopy that I witnessed and the lessons that I learnt to assist young scientists in their discovery.References
- V. Barone, S. Alessandrini, M. Biczysko, J. R. Cheeseman, D. C. Clary, A. B. McCoy, R. J. DiRisio, F. Neese, M. Melosso and C. Puzzarini, Computational molecular spectroscopy, Nat. Rev. Methods Primers, 2021, 1(1), 1–27 CrossRef.
- S.-M. Shen, G. Appendino and Y.-W. Guo, Pitfalls in the structural elucidation of small molecules. A critical analysis of a decade of structural misassignments of marine natural products, Nat. Prod. Rep., 2022, 39(9), 1803–1832 RSC.
- W. Jäger, Y. Xu, G. Armstrong, M. Gerry, F. Naumkin, F. Wang and F. McCourt, Microwave spectra of the Ne–N 2 van der Waals complex: Experiment and theory, J. Chem. Phys., 1998, 109(13), 5420–5432 CrossRef.
- A. A. Finenko, D. N. Chistikov, Y. N. Kalugina, E. K. Conway and I. E. Gordon, Fitting potential energy and induced dipole surfaces of the van der Waals complex CH 4–N 2 using non-product quadrature grids, Phys. Chem. Chem. Phys., 2021, 23(34), 18475–18494 RSC; A. J. Merer, Y.-C. Hsu, Y.-R. Chen and Y.-J. Wang, Rotational analysis of bands of the Ö
![[X with combining tilde]](https://www.rsc.org/images/entities/char_0058_0303.gif) transition of the C3Ar van der Waals complex, J. Chem. Phys., 2015, 143(19), 194304 CrossRef CAS PubMed; L. Wang and M. Yang, Theoretical studies of potential energy surface and rotational spectra of Xe–H 2 O van der Waals complex, J. Chem. Phys., 2008, 129(17), 174305 CrossRef PubMed; L. Wang, M. Yang, A. McKellar and D. H. Zhang, Spectroscopy and potential energy surface of the H 2–CO 2 van der Waals complex: experimental and theoretical studies, Phys. Chem. Chem. Phys., 2007, 9(1), 131–137 RSC; F. Wang and F. R. McCourt, Potential energy surface for and pure rotational spectra of isotopomeric Cl2–Ar van der Waals complexes, J. Chem. Phys., 1996, 104(23), 9304–9312 CrossRef.
transition of the C3Ar van der Waals complex, J. Chem. Phys., 2015, 143(19), 194304 CrossRef CAS PubMed; L. Wang and M. Yang, Theoretical studies of potential energy surface and rotational spectra of Xe–H 2 O van der Waals complex, J. Chem. Phys., 2008, 129(17), 174305 CrossRef PubMed; L. Wang, M. Yang, A. McKellar and D. H. Zhang, Spectroscopy and potential energy surface of the H 2–CO 2 van der Waals complex: experimental and theoretical studies, Phys. Chem. Chem. Phys., 2007, 9(1), 131–137 RSC; F. Wang and F. R. McCourt, Potential energy surface for and pure rotational spectra of isotopomeric Cl2–Ar van der Waals complexes, J. Chem. Phys., 1996, 104(23), 9304–9312 CrossRef. - H. W. Kroto, Molecular rotation spectra [by] HW Kroto, 1975 Search PubMed.
- J. El Haddad, B. Bousquet, L. Canioni and P. Mounaix, Review in terahertz spectral analysis, TrAC, Trends Anal. Chem., 2013, 44, 98–105 CrossRef CAS.
- J. Sudarko and E. von Nagy-Felsobuki, Ro-vibrational Transition Energies and Absorption Intensities of the 1A1 States of H2O, He2O2+ and He2S2+, Aust. J. Phys., 2000, 53(5), 665–688 CrossRef CAS; F. Wang and E. I. von Nagy-Felsobuki, Ab initio rovibrational states of the D3h and C2v isotopomers of Li3+, Spectrochim. Acta, Part A, 1995, 51(11), 1827–1835 CrossRef; F. Wang and E. von Nagy-Felsobuki, Variational calculation of the ro-vibrational states of Na3+, Mol. Phys., 1992, 77(6), 1197–1207 CrossRef; F. Wang and E. von Nagy-Felsobuki, Ab Initio Ro-Vibrational Structure of the C2? Isotopes of H2O+, Aust. J. Phys., 1992, 45(5), 651–670 CrossRef; F. Wang, D. J. Searles and E. I. Von Nagy-Felsobuki, Ab initio rotationally resolved infrared spectrum of potassium-lithium (K2Li+), J. Phys. Chem., 1992, 96(15), 6158–6165 CrossRef.
- B. Van Eerdenbrugh and L. S. Taylor, Application of mid-IR spectroscopy for the characterization of pharmaceutical systems, Int. J. Pharm., 2011, 417(1–2), 3–16 CrossRef CAS PubMed.
- F. Wang, Use of simulated infrared spectra to test N2–Ar pair potentials and dipole moment surfaces, Mol. Phys., 1996, 88(3), 821–840 CrossRef CAS.
- F. Wang, F. R. McCourt and R. J. Le Roy, Dipole moment surfaces and the mid-and far-IR spectra of N 2-Ar, J. Chem. Phys., 2000, 113(1), 98–106 CrossRef CAS.
- Q. Liu, J. Wang, Y. Zhou and D. Xie, A full-dimensional ab initio intermolecular potential energy surface and dipole moment surfaces for H2O-Ar, Curr. Chin. Sci., 2022, 2(4), 325–334 CrossRef.
- L. M. Ng and R. Simmons, Infrared spectroscopy, Anal. Chem., 1999, 71(12), 343–350 CrossRef PubMed.
- A. McKellar, Infrared spectra of the (N2) 2 and N2–Ar van der Waals molecules, J. Chem. Phys., 1988, 88(7), 4190–4196 CrossRef CAS.
- A. G. Ayllón, J. Santamaría, S. Miller and J. Tennyson, Calculated spectra for the N2–Ar van der Waals complex, Mol. Phys., 1990, 71(5), 1043–1054 CrossRef.
- H. Fujimoto and K. Fukui, Molecular orbital theory of chemical reactions, Advances in quantum chemistry, Elsevier, 1972, vol. 6, pp. 177–201 Search PubMed.
- E. Weigold and I. McCarthy, Electron momentum spectroscopy, Springer Science & Business Media, 1999 Search PubMed.
- F. Wang, Assessment of quantum mechanical models based on resolved orbital momentum distributions of n-butane in the outer valence shell, J. Phys. Chem. A, 2003, 107(47), 10199–10207 CrossRef CAS PubMed.
- F. A. Delesma, M. Van den Bossche, H. Grönbeck, P. Calaminici, A. M. Köster and L. G. M. Pettersson, A Chemical View on X-ray Photoelectron Spectroscopy: the ESCA Molecule and Surface-to-Bulk XPS Shifts, ChemPhysChem, 2018, 19, 169 CrossRef CAS PubMed.
- C. W. Huck, Selected latest applications of molecular spectroscopy in natural product analysis, Phytochem. Lett., 2017, 20, 491–498 CrossRef CAS.
- S. Islam, Intramolecular interaction of isolated molecules and their interactions with metal surfaces, Swinburne University of Technology, Melbourne, 2018 Search PubMed.
- A. Hill, H. Sa’adeh, D. Cameron, F. Wang, A. B. Trofimov, E. Y. Larionova, R. Richter and K. C. Prince, A comprehensive core level study of phenol, benzoic acid and three isomers of hydroxybenzoic acid, J. Chem. Phys. A, 2021, 125, 9877–9891 CrossRef CAS PubMed.
- S. Saha, F. Wang, J. B. MacNaughton, A. Moewes and D. P. Chong, The attachment of amino fragment to purine: inner-shell structures and spectra, J. Synchrotron Radiat., 2008, 15(2), 151–157 CrossRef CAS PubMed.
- F. Wang, Q. Zhu and E. Ivanova, Inner-shell chemical shift of DNA/RNA bases and inheritance from their parent purine and pyrimidine, J. Synchrotron Radiat., 2008, 15(6), 624–631 CrossRef CAS PubMed.
- Q. Zhu, F. Wang and E. Ivanova, Impact of ketone and amino on the inner shell of guanine, J. Synchrotron Radiat., 2009, 545 CrossRef CAS PubMed.
- M. Elyashberg and A. J. Williams, Computer-based structure elucidation from spectral data, Springer, 2015 RSC; B. K. Chhetri, S. Lavoie, A. M. Sweeney-Jones and J. Kubanek, Recent trends in the structural revision of natural products, Nat. Prod. Rep., 2018, 35(6), 514–531 RSC.
- H. Li, R. J. Le Roy and F. R. McCourt, Predicted bound states and microwave spectrum of N 2–He van der Waals complexes, J. Chem. Phys., 2009, 130(24), 244503 CrossRef CAS PubMed; W. Jäger and M. Gerry, The microwave spectrum of the van der Waals complex Ar N2, Chem. Phys. Lett., 1992, 196(3–4), 274–279 CrossRef; G. Yan, J. Xie and D. Xie, Theoretical studies of rovibrational spectrum and potential energy function for Ar-N2 complex, Chin. Sci. Bull., 1997, 42(1), 43–46 CrossRef; W. Jäger, Y. Xu, N. Heineking and M. Gerry, The microwave rotational spectrum of the van der Waals complex Kr–N2, J. Chem. Phys., 1993, 99(10), 7510–7520 CrossRef.
- N. Mohammadi, A. Ganesan, C. T. Chantler and F. Wang, Differentiation of ferrocene D5d and D5h conformers using IR spectroscopy, J. Organomet. Chem., 2012, 713, 51–59 CrossRef CAS.
- C. T. Chantler, N. A. Rae, M. T. Islam, S. P. Best, J. Yeo, L. F. Smale, J. Hester, N. Mohammadi and F. Wang, Stereochemical analysis of ferrocene and the uncertainty of fluorescence XAFS data, J. Synchrotron Radiat., 2012, 19(2), 145–158 CrossRef CAS PubMed.
- S. Islam and F. Wang, The d-electrons of Fe in ferrocene: the excess orbital energy spectrum (EOES), RSC Adv., 2015, 5(16), 11933–11941 RSC; F. Wang, S. Islam and V. Vasilyev, Ferrocene orientation determined intramolecular interactions using energy decomposition analysis, Materials, 2015, 8(11), 7723–7737 CrossRef CAS PubMed.
- M. T. Islam, S. P. Best, J. D. Bourke, L. J. Tantau, C. Q. Tran, F. Wang and C. T. Chantler, Accurate X-ray absorption spectra of dilute systems: Absolute measurements and structural analysis of ferrocene and decamethylferrocene, J. Phys. Chem. C, 2016, 120(17), 9399–9418 CrossRef CAS.
- J. Bourke, M. Islam, S. Best, C. Tran, F. Wang and C. Chantler, Conformation Analysis of Ferrocene and Decamethylferrocene via Full-Potential Modeling of XANES and XAFS Spectra, J. Phys. Chem. Lett., 2016, 2729–2796 Search PubMed.
- S. P. Best, F. Wang, M. T. Islam, S. Islam, D. Appadoo, R. M. Trevorah and C. T. Chantler, Reinterpretation of dynamic vibrational spectroscopy to determine the molecular structure and dynamics of ferrocene, Chem. – Eur. J., 2016, 22(50), 18019–18026 CrossRef CAS PubMed.
- F. Wang and V. Vasilyev, Molecular dynamics study of ferrocene topology under various temperatures, Int. J. Quantum Chem., 2020, 120(23), e26398 CAS.
- R. Trevorah, N. Tran, D. Appadoo, F. Wang and C. Chantler, Resolution of ferrocene and deuterated ferrocene conformations using dynamic vibrational spectroscopy: Experiment and theory, Inorg. Chim. Acta, 2020, 506, 119491 CrossRef CAS.
- F. Wang, N. Mohammadi, S. P. Best, D. Appadoo and C. T. Chantler, Dominance of eclipsed ferrocene conformer in solutions revealed by the IR spectra between 400 and 500 cm−1, Radiat. Phys. Chem., 2021, 188, 109590 CrossRef CAS.
- F. Wang, S. Islam and C. T. Chantler, Solvent contribution to ferrocene conformation: Theory and experiment, Radiat. Phys. Chem., 2021, 189, 109697 CrossRef CAS.
- F. Wang and C. T. Chantler Dominant changes in centre Fe atom of decamethyl-ferrocene from ferrocene in methylation. 2022.
- F. Wang and C. T. Chantler, Dominant changes in centre Fe atom of decamethyl-ferrocene from ferrocene in methylation, Theor. Chem. Acc., 2023, 142(2), 1–13 Search PubMed.
- E. R. Lippincott and R. D. Nelson, The vibrational spectra and structure of ferrocene and ruthenocene, Spectrochim. Acta, 1958, 10(3), 307–329 CrossRef CAS.
- M. Rozenberg, A. Loewenschuss and Y. Marcus, An empirical correlation between stretching vibration redshift and hydrogen bond length, Phys. Chem. Chem. Phys., 2000, 2(12), 2699–2702 RSC.
- P. Hobza and Z. Havlas, Improper, blue-shifting hydrogen bond, Theor. Chem. Acc., 2002, 108(6), 325–334 Search PubMed.
- K. Hermansson, Blue-shifting hydrogen bonds, J. Phys. Chem. A, 2002, 106(18), 4695–4702 CrossRef CAS.
- L. Selvam, F. Chen and F. Wang, Solvent effects on blue shifted improper hydrogen bond of C–H⋯ O in deoxycytidine isomers, Chem. Phys. Lett., 2010, 500(4–6), 327–333 CrossRef CAS.
- F. Chen, L. Selvam and F. Wang, Blue shifted intramolecular C− H⋯O improper hydrogen bonds in conformers of zidovudine, Chem. Phys. Lett., 2010, 493(4–6), 358–363 CrossRef CAS.
- P. J. Stephens, F. J. Devlin and J. J. Pan, The determination of the absolute configurations of chiral molecules using vibrational circular dichroism (VCD) spectroscopy, Chirality, 2008, 20(5), 643–663 CrossRef CAS PubMed.
- A. Ganesan, M. J. Brunger and F. Wang, A study of aliphatic amino acids using simulated vibrational circular dichroism and Raman optical activity spectra, Eur. Phys. J. D, 2013, 67(11), 1–12 CrossRef.
- S. Mukamel, Multidimensional femtosecond correlation spectroscopies of electronic and vibrational excitations, Annu. Rev. Phys. Chem., 2000, 51, 691–729 CrossRef CAS PubMed.
- M. H. Palmer, M. Coreno, M. de Simone, C. Grazioli, R. A. Aitken, S. V. Hoffmann, N. C. Jones and C. Peureux, High-level studies of the ionic states of norbornadiene and quadricyclane, including analysis of new experimental photoelectron spectra by configuration interaction and coupled cluster calculations, J. Chem. Phys., 2020, 153(20), 204303 CrossRef CAS PubMed.
- H. Mackenzie-Ross, M. J. Brunger, F. Wang, W. Adcock, T. Maddern, L. Campbell, W. Newell, I. E. McCarthy, E. Weigold and B. Appelbe, Comprehensive experimental and theoretical study into the complete valence electronic structure of norbornadiene, J. Phys. Chem. A, 2002, 106(41), 9573–9581 CrossRef CAS.
- H. MacKenzie-Ross, M. Brunger, F. Wang, W. Adcock, N. Trout, I. E. McCarthy and D. A. Winkler, Definitive confirmation for through-space bond dominance in the outermost π-orbitals of norbornadiene, J. Electron Spectrosc. Relat. Phenom., 2002, 123(2–3), 389–395 CrossRef CAS.
- C. T. Falzon, F. Wang and W. Pang, Orbital signatures of methyl in L-alanine, J. Phys. Chem. B, 2006, 110(19), 9713–9719 CrossRef CAS PubMed.
- V. G. Neudachin, Y. V. Popov and Y. F. Smirnov, Electron momentum spectroscopy of atoms, molecules, and thin films, Phys.-Usp., 1999, 42(10), 1017 CrossRef.
- F. Wang, W. Pang and M. Huang, Valence space electron momentum spectroscopy of diborane, J. Electron Spectrosc. Relat. Phenom., 2006, 151(3), 215–223 CrossRef CAS.
- T. C. Yang, L. G. Su, C. G. Ning, J. K. Deng, F. Wang, F. S. Zhang, X. G. Ren and Y. R. Huang, A New diagnostic of the most populated conformer of tetrahydrofuran in gas phase, J. Phys. Chem. A, 2007, 111, 4927–4933 CrossRef CAS PubMed.
- C. Ning, Y. Huang, S. Zhang, J. Deng, K. Liu, Z. Luo and F. Wang, Experimental and theoretical electron momentum spectroscopic study of the valence electronic structure of tetrahydrofuran under pseudorotation, J. Phys. Chem. A, 2008, 112(44), 11078–11087 CrossRef CAS PubMed.
- P. Duffy, J. A. Sordo and F. Wang, Valence orbital response to pseudorotation of tetrahydrofuran: A snapshot using dual space analysis, J. Chem. Phys., 2008, 128(12), 03B619 CrossRef PubMed.
- A. Ganesan, F. Wang, M. Brunger and K. Prince, Effects of alkyl side chains on properties of aliphatic amino acids probed using quantum chemical calculations, J. Synchrotron Radiat., 2011, 18(5), 733–742 CrossRef CAS PubMed.
- C. Fonseca Guerra, F. Bickelhaupt, S. Saha and F. Wang, Adenine tautomers: relative stabilities, ionization energies, and mismatch with cytosine, J. Phys. Chem. A, 2006, 110(11), 4012–4020 CrossRef CAS PubMed; Q. Zhu, F. Wang and E. Ivanova, Impact of ketone and amino on the inner shell of guanine, J. Synchrotron Radiat., 2009, 16(4), 545–552 CrossRef PubMed; A. Ganesan and F. Wang, Intramolecular interactions of L-phenylalanine revealed by inner shell chemical shift, J. Chem. Phys., 2009, 131(4), 07B621 CrossRef PubMed.
- J. Magulick, M. Beerbom, B. Lägel and R. Schlaf, Ionization energy and electronic structure of polycytidine, J. Phys. Chem. B, 2006, 110(6), 2692–2699 CrossRef CAS PubMed.
- A. Thompson, S. Saha, F. Wang, T. Tsuchimochi, A. Nakata, Y. Imamura and H. Nakai, Density functional study on core ionization spectra of cytidine and its fragments, Bull. Chem. Soc. Jpn., 2009, 82(2), 187–195 CrossRef CAS.
- F. Wang, Ionisation energy splitting of amino and imino N–K sites in cytidine, Micro Nano Lett., 2006, 1(1), 23–24 CrossRef CAS.
- A. P. Wickrama Arachchilage, F. Wang, V. Feyer, O. Plekan and K. C. Prince, Photoelectron spectra and structures of three cyclic dipeptides: PhePhe, TyrPro, and HisGly, J. Chem. Phys., 2012, 136(12), 124301 CrossRef PubMed.
- A. Hill, H. Sa’adeh, D. Cameron, F. Wang, A. B. Trofimov, E. Y. Larionova, R. Richter and K. C. Prince, Positional and conformational isomerism in hydroxybenzoic acid: A core-level study and comparison with phenol and benzoic acid, J. Phys. Chem. A, 2021, 125(45), 9877–9891 CrossRef CAS PubMed.
- F. W. Alexsander Hill, Intramolecular O⋯H hydrogen bonding of salicylic acid conformers revealed by O1s XPS and H-NMR spectra, J. Phys. Chem. A, 2023, in process Search PubMed.
- F. Backler and F. Wang, Switching On/Off the Intramolecular Hydrogen Bonding of 2-Methoxyphenol Conformers: An NMR Study, Aust. J. Chem., 2020, 73(3), 222–229 CrossRef CAS.
- F. Backler and F. Wang, Impact of intramolecular hydrogen bonding of gallic acid conformers on chemical shift through NMR spectroscopy, J. Mol. Graphics Modell., 2020, 95, 107486 CrossRef CAS PubMed.
- V. K. Rajan and K. Muraleedharan, A computational investigation on the structure, global parameters and antioxidant capacity of a polyphenol, Gallic acid, Food Chem., 2017, 220, 93–99 CrossRef CAS PubMed.
- R. G. Bryant, The NMR time scale, J. Chem. Educ., 1983, 60(11), 933, DOI:10.1021/ed060p933.
- L.-l Jiang, Y.-f Song, W.-l Liu, H.-l Wu, X.-y Li and Y.-q Yang, Ultrafast characteristics of vibrational dynamics in tetrahydrofuran via femtosecond coherent anti-stokes Raman scattering, Chem. Phys. Lett., 2021, 765, 138256, DOI:10.1016/j.cplett.2020.138256.
- F. Wang and S. Chatterjee, Dominant Carbons in trans- and cis-Resveratrol Isomerization, J. Phys. Chem. B, 2017, 121(18), 4745–4755, DOI:10.1021/acs.jpcb.7b02115.
- F. Backler, M. A. Sani, F. Separovic, V. Vasilyev and F. Wang, NMR Chemical Shift and Methylation of 4-Nitroimidazole: Experiment and Theory, Aust. J. Chem., 2021, 74(1), 48–55, DOI:10.1071/CH20199.
- P. Schneider, W. P. Walters, A. T. Plowright, N. Sieroka, J. Listgarten, R. A. Goodnow, J. Fisher, J. M. Jansen, J. S. Duca and T. S. Rush, et al., Rethinking drug design in the artificial intelligence era, Nat. Rev. Drug Discovery, 2020, 19(5), 353–364, DOI:10.1038/s41573-019-0050-3.
- B. E. Cohen, T. B. McAnaney, E. S. Park, Y. N. Jan, S. G. Boxer and L. Y. Jan, Probing protein electrostatics with a synthetic fluorescent amino acid, Science, 2002, 296(5573), 1700–1703 CrossRef CAS PubMed.
- M. M. Sadek, R. A. Serrya, A.-H. N. Kafafy, M. Ahmed, F. Wang and K. A. Abouzid, Discovery of new HER2/EGFR dual kinase inhibitors based on the anilinoquinazoline scaffold as potential anti-cancer agents, J. Enzyme Inhib. Med. Chem., 2014, 29(2), 215–222 CrossRef CAS PubMed; C.-J. Tsai; R. Nussinov, The molecular basis of targeting protein kinases in cancer therapeutics, Seminars in cancer biology, Elsevier, vol. 23, 2013, pp. 235–242 Search PubMed.
- V. Kannappan, P. Vidhya and V. Sathyanarayanamoorthi, Quantum mechanical study of solvation analysis on some nitrogen containing heterocyclic compounds, J. Mol. Liq., 2015, 207, 7–13 CrossRef CAS; H. Jin, H.-G. Dan and G.-W. Rao, Research progress in quinazoline derivatives as multi-target tyrosine kinase inhibitors, Heterocycl. Commun., 2018, 24(1), 1–10 CrossRef.
- V. Aparna, G. Rambabu, S. K. Panigrahi, J. A. R. P. Sarma and G. R. Desiraju, Virtual Screening of 4-Anilinoquinazoline Analogues as EGFR Kinase Inhibitors: Importance of Hydrogen Bonds in the Evaluation of Poses and Scoring Functions, J. Chem. Inf. Model., 2005, 45, 725 CrossRef CAS PubMed.
- M. Khattab, F. Wang and A. H. A. Clayton, UV-Vis Spectroscopy and Solvatochromism of the Tyrosine Kinase Inhibitor AG-1478, Spectrochim. Acta, Part A, 2016, 164, 128–132, DOI:10.1016/j.saa.2016.04.009.
- M. Khattab, C. Chatterjee, A. H. A. Clayton and F. Wang, Tyrosine Kinase Inhibitor (AG-1478): Two Conformers of a Tyrosine Kinase Inhibitor (AG-1478) Disclosed Using Simulated UV-Vis Absorption Spectroscopy, New J. Chem., 2016, 40, 8296 RSC.
- M. Habgood, T. James and A. Heifetz, Conformational searching with quantum mechanics, Quantum Mechanics in Drug Discovery, 2020, 207–229 CAS.
- M. Khattab, F. Wang and A. H. A. Clayton, Conformational Plasticity in Tyrosine Kinase Inhibitor−Kinase Interactions Revealed with Fluorescence Spectroscopy and Theoretical Calculations, J. Phys. Chem. B, 2018, 122, 4667 CrossRef CAS PubMed; M. L. B. F. Kabir, A. H. A. Clayton and F. Wang, Deducing the Conformational Properties of a Tyrosine Kinase Inhibitor in Solution by Optical Spectroscopy and Computational Chemistry, Front. Chem., 2020, 8, 596 CrossRef PubMed; F. Wang, V. Vasilyev and A. H. Clayton, Optical spectra and conformation pool of tyrosine kinase inhibitor PD153035 using a robust quantum mechanical conformation search, New J. Chem., 2022, 46(7), 3168–3177 RSC.
- M. Ahmed, M. M. Sadek, K. A. Abouzid and F. Wang, In silico design: extended molecular dynamic simulations of a new series of dually acting inhibitors against EGFR and HER2, J. Mol. Graphics Modell., 2013, 44, 220–231 CrossRef CAS PubMed; A. E. Elkholy, S. A. Rizk and A. M. Rashad, Enhancing lubricating oil properties using novel quinazolinone derivatives: DFT study and molecular dynamics simulation, J. Mol. Struct., 2019, 1175, 788–796 CrossRef.
- F. Wang and V. Vasilyev, Accelerating optical reporting for conformation of tyrosine kinase inhibitors in solutions, Int. J. Quantum Chem., 2021, 121(20), e26765, DOI:10.1002/qua.26765.
- F. Wang, R. Swinbourn and C. E. Li, Shipping Australian sunshine: Liquid renewable green fuel export, Int. J. Hydrogen Energy, 2023 DOI:10.1016/j.ijhydene.2022.12.326.
- A. Błaszczyk, Recent improvements in dye-sensitized solar cells, Chemical Solution Synthesis for Materials Design and Thin Film Device Applications, Elsevier, 2021, pp. 509–544 Search PubMed.
- N. Mohammadi, P. J. Mahon and F. Wang, Toward rational design of organic dye sensitized solar cells (DSSCs): an application to the TA-St-CA dye, J. Mol. Graphics Modell., 2013, 40, 64–71 CrossRef CAS PubMed; Q. Arooj, G. Wilson and F. Wang, Shifting UV-Vis absorption spectrum through rational structural modifications of zinc porphyrin photoactive compounds, RSC Adv., 2016, 15345 RSC; F. Backler, G. Wilson and F. Wang, Rational use of ligand to shift the UV-Vis spectrum of Ru-complex sensitizer dyes for DSSC applications, Radiat. Phys. Chem., 2019, 66 CrossRef.
- Q. Arooj and F. Wang, Switching on optical properties of D-π-A DSSC sensitizers from π-spacers towards machine learning, Sol. Energy, 2019, 188, 1189–1200 CrossRef CAS.
- F. Wang, S. Langford and H. Nakai, Robust design of D-π-A model compounds using digital structures for organic DSSC applications, J. Mol. Graphics Modell., 2021, 102, 107798 CrossRef CAS PubMed.
- D. C. Elton, Z. Boukouvalas, M. D. Fuge and P. W. Chung, Deep learning for molecular design—a review of the state of the art, Mol. Syst. Des. Eng., 2019, 4(4), 828–849 RSC.
- A. Mahmood and J.-L. Wang, A time and resource efficient machine learning assisted design of non-fullerene small molecule acceptors for P3HT-based organic solar cells and green solvent selection, J. Mater. Chem. A, 2021, 9(28), 15684–15695 RSC.
| This journal is © the Owner Societies 2023 |


