The largest fullerene†
Michael
Gatchell
 a,
Henning
Zettergren
 a and
Klavs
Hansen
 *bc
*bc
aDepartment of Physics, Stockholm University, Stockholm 106 91, Sweden
bLanzhou Center for Theoretical Physics, Key Laboratory of Theoretical Physics of Gansu Province, Lanzhou University, Lanzhou, Gansu 730000, China
cCenter for Joint Quantum Studies and Department of Physics, School of Science, Tianjin University, 92 Weijin Road, Tianjin 300072, China. E-mail: hansen@lzu.edu.cn; klavshansen@tju.edu.cn
First published on 14th June 2023
Abstract
Fullerenes are lowest energy structures for gas phase all-carbon particles for a range of sizes, but graphite remains the lowest energy allotrope of bulk carbon. This implies that the lowest energy structure changes nature from fullerenes to graphite or graphene at some size and therefore, in turn, implies a limit on the size of free fullerenes as ground state structures. We calculate this largest stable single shell fullerene to be of size N = 1 × 10⁴, using the AIREBO effective potential. Above this size fullerene onions are more stable, with an energy per atom that approaches graphite structures. Onions and graphite have very similar ground state energies, raising the intriguing possibility that fullerene onions could be the lowest free energy states of large carbon particles in some temperature range.
1 Introduction
The standard enthalpy of formation of the C60 fullerene is 0.4 eV per atom.1,2 The value is given relative to bulk graphite. For isolated (gas phase) carbon clusters, in contrast, the fullerenes3 are the lowest energy structures for small enough systems. There must therefore be a limit to the size of gas phase fullerenes in equilibrium.This work provides the results of a calculation of this size, involving a comparison of the energies of the multilayer fullerene onions4 and the graphene5 or graphite structures. In total, the icosahedral symmetry fullerenes, the compact graphite structures, the fullerene onion structures, and graphene sheets were considered. Clusters of fullerenes,6 which provide an efficient way of producing large and mass selected all-carbon gas phase systems, can be ruled out as candidates for lowest energy structures by the known values of fullerite binding energies. They will therefore not be considered here further.
2 Computational method
Models based on structural motifs have been shown to accurately predict the relative stability of fullerene isomers ranging from C60 to icosahedral fullerenes containing up to 6000 carbon atoms.7–12 In these works, the results of Density Functional Theory calculations are typically used as input to arrive at simple expressions for the relative fullerene energies.The same strategy is followed in this work. The system sizes that are relevant in this study are orders of magnitude larger and will render any attempt of a full quantum mechanical calculation unfeasible. Instead, the empirical AIREBO potential by Stuart et al. was used to describe the interactions, both of intra- and intermolecular nature.13 This is a reactive manybody potential where the interaction strengths and bond angles depend on the local environments of the participating atoms. Long-range dispersion forces are also included in the definition of the AIREBO potential. It has been used previously to accurately model graphene and fullerenes in numerous studies14–16 and generally compares favorably with more advanced theory and with experimental data.15
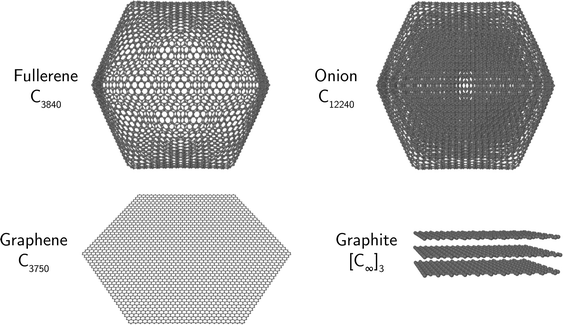
The initial structures of graphene layers and fullerene cages were generated using a custom code that built graphene sheets with a D6h symmetry (see Fig. 1). From these, the 20 triangular faces of icosahedral (Ih symmetry) fullerenes could be formed from Coxeter constructions with (m,n) = (1,1), (2,2), (3,3)….17–20 Such icosahedral fullerenes consist of 60n2 atoms, where n is the same positive integer as used in the Coxeter constructions. All of the resulting structures contain exactly 12 pentagons arranged as the vertices of a regular icosahedron, with the remaining carbon rings consisting entirely of hexagons.
The multilayered onion structures were built by placing successively larger fullerene structures around all of the smaller icosahedral fullerenes, starting with C60 as the innermost shell. The sizes of such onions is given by the sum  , where no is the Coxeter index of the outermost fullerene layer. The fullerene layers were structured with their symmetry axes aligned.
The fullerene onions that have been observed experimentally are more spherical than the lowest energy single shell fullerenes (see Schwerdtfeger et al.20 and references therein). Calculations21 suggest that this is due to C2-emission that introduce one heptagon and an additional pentagon. However, as the binding energy per atom for these two classes of onions is very similar for species containing more than thousand atoms (see Fig. 6 in Bates and Scuseria21), and as the introduction of a heptagon combination in any case increases the energy, it is justified to consider the icosahedral structures here. Indeed, test calculations of individual fullerenes show that defects such as heptagons result in a negligible increase (less than 1 meV per atom) in the potential energy of a fullerene consisting of more than a few thousand atoms (see ESI† for details).
Graphite structures were formed by stacking graphene layers with a small offset in the xy-plane (equal to the length of a C–C bond) between each layer so that each hexagonal ring had a carbon atom from the two surrounding layers placed directly above its center and such that every second layer shared the same xy-coordinates. Infinite layers were modeled using periodic boundary conditions in the xy-plane and the asymptotic graphite limit with an infinite number of layers was reached by also including periodic boundaries along the z-axis.
The input geometries of all systems were optimized under the AIREBO force field using the LAMMPS molecular dynamics software package22 to provide the ground state structures and energies. Fig. 1 shows a selection of optimized structures of the geometries considered here. A complete archive of the optimized structures is available as well.23
3 Results
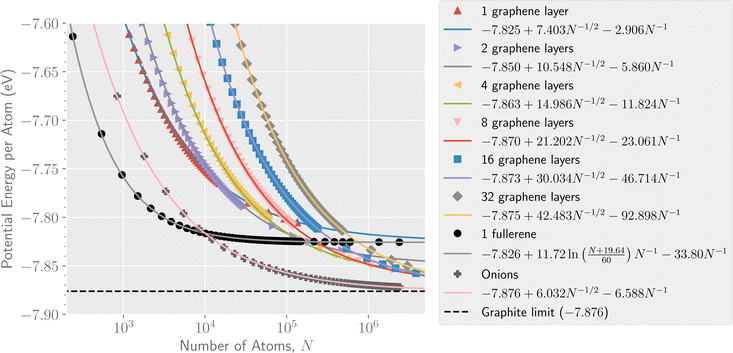
The ground state potential energy per atom for the different structures are shown as a function of size in Fig. 2. The smallest system considered here is a single C6 ring (not shown in the figure) while the largest structures that we have explicitly studied contain millions of atoms. As seen from the figure, the single shell fullerene allotrope is the lowest energy structure type for systems containing up to approximately 104 atoms. Above this size the energy of the multi-layer onion fullerene structures dives below that of the single shell fullerenes which has already reached energies close to the asymptotic value of −7.83 eV per atom. The smallest onion that we identify in our calculations with a lower potential energy per atom than a comparably sized single shell fullerene is the C12240 cluster that consists of 8 fullerene layers (C60 through C3840, shown in Fig. 1).Fig. 2 also gives least square fits of energies vs. size to facilitate comparisons between the different species. For graphene and the graphitic and onion-like structures, the functional form of the fit is given by
 | (1) |
The dashed line in Fig. 2 shows the potential energy limit of ideal bulk graphite within the AIREBO model. The calculation using periodic boundary conditions (PBCs) to simulate graphite consisting of an infinite number of infinitely large graphene layers represents the bulk ground state of carbon with no external pressure applied. The limit for finite numbers of graphene layers were also determined for systems consisting of up to 256 layers using PBCs in only two dimensions.
Of the systems shown in Fig. 2, only the onion structure asymptotically approaches the graphite limit within the uncertainties of the fitted curves. The asymptotic limits for the different graphene, fullerene, and onion particles, determined from the fits shown in Fig. 2 and the calculations using PBCs, are given in Table 1.
| Structure | Fit limit (eV) | PBC limit (eV) |
|---|---|---|
| 1 graphene layer | −7.82497(8) | −7.82569 |
| 2 layers | −7.84985(9) | −7.84931 |
| 4 layers | −7.86322(7) | −7.86275 |
| 8 layers | −7.86970(7) | −7.86948 |
| 16 layers | −7.87307(6) | −7.87285 |
| 32 layers | −7.87470(5) | −7.87454 |
| 64 layers | — | −7.87538 |
| 128 layers | — | −7.87580 |
| 256 layers | — | −7.87601 |
| Fullerene | −7.82577(2) | — |
| Onion | −7.87611(6) | — |
| Bulk graphite | — | −7.87622 |
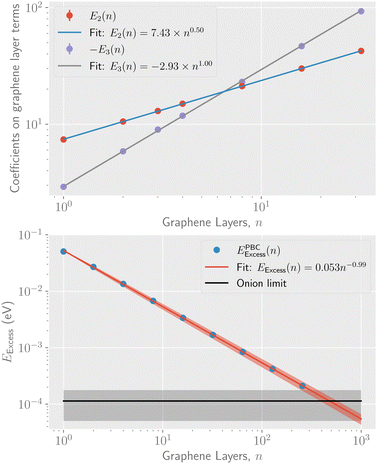
The parameters determined from the fits, E1, E2, and E3, can be used to extract a scaling relation for the potential energy of graphitic particles of arbitrary sizes. Fig. 3 shows fits made to these parameters as functions of the number of layers, n. The fits made in the upper panel, where the exponents are free parameters, suggest that E3 scales linearly with n while E2 scales as the square root of n over the range of particle sizes modeled. In the lower panel of Fig. 3 we show the scaling of the asymptotic potential energy limit (E1) in terms of the so-called excess energy. The excess energy, EExcess, is defined as the difference per atom in potential energy between a given particle and that of bulk graphite. Here, the limits obtained for n graphene layers from the PBC calculations, EPBCExcess(n), are shown as the different data points. In the figure, the asymptotic limit for the onion structures is shown as a constant while the corresponding excess energy for up to 256 stacked graphene layers is shown as the blue points. The red curve shows a fit of a powerlaw to these point that allows the E1(n) parameter to be scaled to sizes larger than those explicitly modeled. The exponent from this fit, p = −0.994 ± 0.004, is consistent with a 1/n scaling of EExcess. The same fit using the “fit limit” values from Table 1 result in an exponent of p= −1.019 ± 0.009. Noteworthy is that the fitted curve crosses the curve for the onions structures at n = 480. This is an estimate of the fewest number of graphene layers required to give a structure with a lower potential energy than the onions, made with the fit parameters explained below.
 | ||
| Fig. 3 Top panel: The coefficients to the 1/N1/2 and 1/N terms from the fits to eqn (1), (E2 and E3) respectively, for different numbers of stacked graphene layers. Bottom panel: The scaling of the asymptotic potential energy, E1, of stacked graphene layers as a function of n together with a fitted power law expression and the corresponding limit for onion structures. The shaded areas in both panels show the 1σ statistical uncertainties of each curve. | ||
From the fitted parameters shown in Fig. 3 we can derive a single expression for how the potential energy per atom of a graphite particle scales with the total number of atoms (N) and number of graphene layers (n). The expression we arrive at is
 | (2) |
| n ≈ 0.0588N1/3. | (3) |
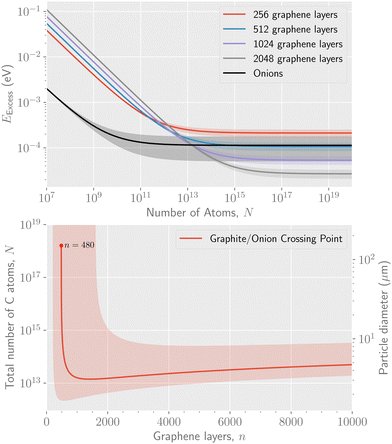
The parametrization in eqn (2) allows us to extrapolate the ground state potential energies for particles consisting of stacked graphene sheets to sizes larger than we are able to explicitly simulate without using PBCs. An example of this, with the minima calculated numerically with the full expression in eqn (2), is shown in the upper panel of Fig. 4. There, the excess energy per atom is plotted for n = 256, 512, 1024, and 2048 layers of graphene, as well as the corresponding curve for fullerene onion structures. Due to the uncertainties in these calculations, indicated by the shaded areas in the figure, the minimal number of 480 graphene layers given above could be as small as approximately 200. The curve for 480 graphene layers (not shown) crosses the onion curve at a particle size of N = 1018 atoms (only a single significant digit is given in consideration of the calculation uncertainties). However, for particles consisting of more layers, the crossing point occurs at smaller total sizes, as seen in the curves for 512, 1024, and 2048 layers. In the lower panel of Fig. 4 we show the crossing point as a function of the number of graphene layers in a graphite particle. Starting from 480 layers, the corresponding crossing point is seen to take place at smaller particle sizes until a minimum is reached at 1160 layers, where the cross over points between onions and graphite takes place for 1013 atoms. This is then the estimate of the size of the largest stable onion. In terms of particles size, this corresponds to a spherical particle with a diameter of a few micrometers. After this there is a slight increase in the cross-over particle size with increasing number of graphene layers.
The effect of deviations from the idealized structures considered so far has also been considered by the introduction of three different types of defects. One is bond rotation, where a pair of neighboring carbon atoms were rotated by 90 degrees around the center of their connecting bond. This causes the conversion of four adjacent hexagons into two pentagons and two heptagons. A second type was the removal of a single atom and the third the removal two adjacent carbon atoms were removed. The defects were introduced at the center of the 20 facets of an icosahedral fullerene. In all cases, the energy increased, although the increas per atom decreased with size. More details are given in the ESI.†
4 Summary and discussion
The results here show that the minimum energy structure of free carbon particles is, in order of increasing size, single shell fullerenes, onions, and graphite. The coefficients to the leading order terms of graphite and onion structures differ for two reasons. One is the inter-layer interaction. This is a free parameter for the graphite sheets and can be optimized unconstrained, whereas the onion structures are limited to the radii defined by the closed shells number of atoms equal to 60n2. The energy penalty of this distance effect is minor, however, seen also from the fact that the optimal distance between graphite layers is close to the distance given by the radii of two consecutive shells in the onion. The close match makes the magnitudes of the leading order terms of the onions and the graphite very similar. Another diffeerence is the vibrational spectra. These will add different vibrational zero point energies to the calculated structures. It has not been possible to treat this question here due to the very large particle numbers involved.The limitations of the numerical calculations notwithstanding, we can nevertheless draw some conclusions and make some conjectures. One aspect concerns the expected reduction in the HOMO–LUMO gap with increasing size predicted by Noël et al.27 The authors extrapolated their calculated gap beyond their highest calculated size of 6 × 10³ to find that the gap vanishes above N = 7 × 10⁴. This is above the calculated largest fullerene size and raises the question of the use of these fullerenes for electronics in analogy to the uses envisioned for graphene.
The implications of our findings could be important for a better understanding of the carbon inventory of interstellar and circumstellar environments. The crossover point from onions to graphite in our model occurs at particle sizes on the order of micrometers. This is of the same order of magnitude as the upper limit of interstellar dust grains,28 which could suggest that onion-like structures are prevalent in these regions. Previous experimental work has indeed suggested that fullerene onion particles could explain certain interstellar extinction features,29 lending support to this possibility.
The main unresolved question of this work is how the energies calculated compare to the reaction barriers between the different allotropes. This will remain a topic for future study. We should also mention the potential role of imperfections in the structures, as well as the possibility of other, more exotic carbon structures.30 These open questions make it difficult to formulate any strong experimental predictions. We will express a guarded optimism concerning conversion rates, however. In contrast to expectations, carbon dimers have been shown to attach barrier-less to C60 in gas phase, and to be incorporated into the cage.31 Hence the combined process of bond breaking and bond formation in a conversion may only experience barriers for the bond breaking part.
Author contributions
Conceptualization: KH; data curation: MG; formal analysis: MG, KH; investigation: MG, HZ, KH; methodology: MG, HZ; visualization: MG; writing – original draft: MG, HZ, KH; writing – review & editing: MG, HZ, KH.Conflicts of interest
There are no conflicts to declare.Acknowledgements
KH acknowledges support form the National Science Foundation of China with the grant ‘NSFC No. 12047501’ and the 111 Project under Grant No. B20063 from the Ministry of Science and Technology of People's Republic of China. HZ and MG acknowledge financial support from the Swedish Research Council (contracts 2020-03437 and 2020-03104) and from the project grant “Probing charge- and mass-transfer reactions on the atomic level” (2018.0028) from the Knut and Alice Wallenberg Foundation. This publication is based upon work from COST Action CA18212 – Molecular Dynamics in the GAS phase (MD-GAS), supported by COST (European Cooperation in Science and Technology).References
- T. Kiyobayashi and M. Sakiyama, Fullerene Sci. Technol., 1993, 1, 269 CrossRef CAS.
- W. V. Steele, R. D. Chirico, N. K. Smith, W. E. Billups, P. R. Elmore and A. E. Wheeler, J. Phys. Chem., 1992, 96, 4731–4733 CrossRef CAS.
- H. W. Kroto, J. R. Heath, S. C. O’Brien, R. F. Curl and R. E. Smalley, Nature, 1985, 318, 162 CrossRef CAS.
- D. Ugarte, Nature, 1992, 359, 707–709 CrossRef CAS PubMed.
- K. S. Novoselov, A. K. Geim, S. V. Morozov, D. Jiang, Y. Zhang, S. V. Dubonos, I. V. Grigorieva and A. A. Firsov, Science, 2004, 306, 666–669 CrossRef CAS PubMed.
- K. Hansen and H. Zettergren, J. Phys. Chem. A, 2022, 8173–8187 CrossRef CAS PubMed.
- S. J. Austin, P. W. Fowler, D. E. Manolopoulos, G. Orlandi and F. Zerbetto, J. Phys. Chem., 1995, 99, 8076–8081 CrossRef CAS.
- S. Itoh, P. Ordejón, D. A. Drabold and R. M. Martin, Phys. Rev. B, 1996, 53, 2132–2140 CrossRef CAS PubMed.
- Y. Achiba, P. W. Fowler, D. Mitchell and F. Zerbetto, J Phys. Chem. A, 1998, 102, 6835–6841 CrossRef CAS.
- J. Cioslowski, N. Rao and D. Moncrieff, J. Am. Chem. Soc., 2000, 122, 8265–8270 CrossRef CAS.
- M. Alcamí, G. Sánchez, S. Díaz-Tendero, Y. Wang and F. Martín, J. Nanosci. Nanotechnol., 2007, 7, 1329–1338 CrossRef PubMed.
- Y. Wang, S. Diaz-Tendero, M. Alcami and F. Martin, Phys. Chem. Chem. Phys., 2017, 19, 19646 RSC.
- S. J. Stuart, A. B. Tutein and J. A. Harrison, J. Chem. Phys., 2000, 112, 6472–6486 CrossRef CAS.
- S. Irle, G. Zheng, Z. Wang and K. Morokuma, J. Phys. Chem. B, 2006, 110, 14531–14545 CrossRef CAS PubMed.
- G. Cao, Polymers, 2014, 6, 2404–2432 CrossRef.
- K.-J. Seo and D.-E. Kim, Nanoscale, 2020, 12, 9849–9858 RSC.
- H. S. M. Coxeter, A Spectrum of Mathematics: Essays Presented to H.G. Forder, Oxford University Press, 1971, pp. 98–107 Search PubMed.
- P. W. Fowler and D. E. Manolopoulos, An Atlas of Fullerenes, Courier Corporation, 2007 Search PubMed.
- A. Šiber, Symmetry, 2020, 12, 556 CrossRef.
- P. Schwerdtfeger, L. N. Wirz and J. Avery, WIREs Comput. Mol. Sci., 2015, 5, 96–145 CrossRef CAS PubMed.
- K. R. Bates and G. E. Scuseria, Theor. Chem. Acc., 1998, 99, 29–33 Search PubMed.
- S. Plimpton, J. Comp. Phys., 1995, 117, 1–19 Search PubMed.
- Dataset: The Largest Fullerene DOI:10.5281/zenodo.7766450.
- J. Tersoff, Phys. Rev. B: Condens. Matter Mater. Phys., 1992, 46, 15546–15549 CrossRef CAS PubMed.
- A. Šiber, Eur. Phys. J. D, 2006, 53, 395 CrossRef.
- J. Guan, Z. Jin, Z. Zhu, C. Chuang, B.-Y. Jin and D. Tománek, Phys. Rev. B: Condens. Matter Mater. Phys., 2014, 90, 245403 CrossRef.
- Y. Noël, M. D. L. Pierre, C. M. Zicovich-Wilson, R. Orlando and R. Dovesi, Phys. Chem. Chem. Phys., 2014, 16, 13390 RSC.
- J. C. Weingartner and B. T. Draine, Astrophys. J., 2001, 548, 296 CrossRef.
- S. Tomita, M. Fujii and S. Hayashi, Astrophys. J., 2004, 609, 220 CrossRef CAS.
- E. Meirzadeh, A. M. Evans, M. Rezaee, M. Milich, C. J. Dionne, T. P. Darlington, S. T. Bao, A. K. Bartholomew, T. Handa, D. J. Rizzo, R. A. Wiscons, M. Reza, A. Zangiabadi, N. Fardian-Melamed, A. C. Crowther, P. J. Schuck, D. N. Basov, X. Zhu, A. Giri, P. E. Hopkins, P. Kim, M. L. Steigerwald, J. Yang, C. Nuckolls and X. Roy, Nature, 2023, 613, 71–76 CrossRef CAS PubMed.
- P. W. Dunk, N. K. Kaiser, C. L. Hendrickson, J. P. Quinn, C. P. Ewels, Y. Nakanishi, Y. Sasaki, H. Shinohara, A. G. Marshall and H. W. Kroto, Nat. Commun., 2012, 3, 855 CrossRef PubMed.
Footnote |
| † Electronic supplementary information (ESI) available: Calculated effects that defects in the carbon lattice have on the potential energy of large fullerene molecules. See DOI: https://doi.org/10.1039/d3cp01716h |
| This journal is © the Owner Societies 2023 |


