 Open Access Article
Creative Commons Attribution 3.0 Unported Licence
NEXAFS spectra of model sulfide chains: implications for sulfur networks obtained from inverse vulcanization†
Sunel
de Kock
*a,
Konstantin
Skudler
 b,
Rukiya
Matsidik
cf,
Michael
Sommer
 cf,
Matthias
Müller
 b and
Michael
Walter
 ade
ade
aFreiburg Center for Interactive Materials and Bioinspired Technologies (FIT), University of Freiburg, Georges-Köhler-Allee 105, 79110 Freiburg, Germany. E-mail: sunel.de.kock@mail.fit.uni-freiburg.de
bPhysikalisch-Technische Bundesanstalt, Abbestr. 2-12, 10587 Berlin, Germany
cInstitute for Chemistry, Polymer Chemistry, Chemnitz University of Technology, 09111 Chemnitz, Germany
dCluster of Excellence livMatS @ FIT, Freiburg, Germany
eFraunhofer IWM, MikroTribologie Centrum μTC, Freiburg, Germany
fForschungszentrum MAIN, TU Chemnitz, Rosenbergstraße 6, 09126 Chemnitz, Germany
First published on 11th July 2023
Abstract
Inverse vulcanization is a promising route to stabilize sulfur in lithium–sulfur batteries, but the resulting sulfur strand lengths in the materials are elusive. We address the strand length by characterization via sulfur near edge X-ray absorption fine structure (NEXAFS) spectroscopy. Theoretical predictions of NEXAFS spectra for model molecules containing strands with up to three sulfur atoms are verified by experiment. The near perfect agreement between simulation and experiment on the absolute energy scale allows for the predictions for larger chain lengths also. Inspection and interpretation of NEXAFS spectra from real battery materials on this basis reveals the appearance of single connecting sulfur atoms for very low sulfur content, and of longer strands when the sulfur fraction increases.
1 Introduction
Lithium–sulfur (LiS) batteries with their high specific capacities are promising alternatives to conventional lithium-ion batteries, yet there are some degradation mechanisms limiting their cycle stability.1 One of the most investigated effects is the polysulfide shuttle, which is known to continuously decrease battery capacity during operation.2A variety of approaches has been attempted to combat the polysulfide shuttle.3 One approach involves the incorporation of sulfur into a polymer network by inverse vulcanization.4–6 The C–S bond, being much stronger than the S–S bond, acts as a chemical anchor, counteracting the shuttle effect. Mechanistic insight on this was provided by a study in which dimethyl trisulfide (DMTS) was used as a catholyte.7 The discharge products were shown to be primarily LiSCH3 and Li2S, with LiSSCH3 likely an incomplete discharge product. C–S bonds remained intact, and charging resulted in the reformation of S–S bonds. The impact of the organic moieties in improving cyclability was demonstrated by a solid state NMR study of sulfur–diisopropenylbenzene copolymers (S-DIB).8 Signals associated with longer S-strands could be identified both before and after cycling, indicating the reformation of the S-copolymer network. Cyclic voltammetry also revealed different redox behaviour in two copolymers of differing sulfur weight percent, with the cell with less sulfur displaying only a negligible cathode peak at the voltage associated with the production of long-chain polysulfides, while this peak was prominent in the higher S-loading cell.
The length of the sulfur chains connecting the organic moieties in inverse vulcanized S-copolymers may be tuned by the feed ratio of sulfur and monomer in the reaction. Several studies have demonstrated that better long-term cycle stability may be achieved by limiting the length of the crosslinking S-strands, albeit at the cost of lowering specific capacity.9 The electrochemical behaviour of S-DIB cells was investigated using operando Fourier transform-infrared spectroscopy with attenuated total reflection (FTIR-ATR).10 This study provided further evidence for C–S bonds remaining intact during battery operation, as well as a different discharge mechanism occurring in cathodes composed of high and low S-content copolymers, with little to no formation of higher order Li-polysulfides in the latter. The significantly higher cycle stability found for the low S-content polymer was attributed to this, and it was proposed that the shuttle effect may be successfully mitigated by keeping the S-strand length below 4. Interestingly, a recent DFT study found that the most thermodynamically favored S-strand length for DIB/S copolymers is 4.11 However, this is in contrast to another recent theoretical study which found an energetic drive towards infinite chain lengths.12
Although analysing cathode materials after stopping battery operation at different depths of discharge may provide useful information, exposure to air and the dependence of certain species on the battery potential can distort the results. Analytical techniques which may be applied in situ or operando are therefore invaluable in developing a better mechanistic understanding of LiS battery chemistry. Sulfur S(1s) (K-edge) spectroscopy is a powerful method to characterize the chemical environment of the sulfur atoms.13 Specifically near edge X-ray absorption fine structure (NEXAFS) spectroscopy has been successfully performed in operando during cycling of lithium sulfur batteries,14,15 where the average lithium polysulfide chain length has been found to cycle parallel to the state of charge of the battery.16 Qureshi et al. have performed NEXAFS measurements and presented both X-ray emission and absorption spectra of a monosulfide (diheptyl sulfide) and a disulfide (dihexyl disulfide).17 The dependence of ligands to the NEXAFS spectra of several disulfides has been investigated by Behyan et al.18 For dibenzyl disulfide, dibutyl disulfide and methyl ethyl disulfide, experimental and calculated spectra with respective energy axes were presented and compared to each other with respect to length and symmetry of the functional groups.
The goal of the measurements and theoretical calculations presented here is to identify the length of sulfur chains in organic sulfide molecules by their characteristic sulfur K-edge NEXAFS spectra with the same experimental setup in order to draw conclusions regarding the nature of the batteries' polymer material. We show that the comparison and consistency between experimental and calculated NEXAFS spectra allows for an extrapolating prediction of NEXAFS spectra of molecules with longer sulfur chains. These can be transferred to a first application case from lithium sulfur battery research.19
2 Results and discussion
2.1 Determination of experimental NEXAFS spectra
In the first step, we analyze the best way to investigate the experimental NEXAFS spectra of liquids with maximal resolution. We use coin cells with a Kapton window that are optimized for operando measurements of battery functions.16 The spectra obtained for dimethyl disulfide (DMDS) are displayed in Fig. 1 for a completely filled cell compared to moistening only the cell window with the material producing a thin layer of the liquid.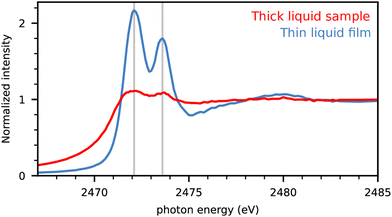 | ||
| Fig. 1 S-Kα intensities of dimethyl disulfide (DMDS) in completely filled cells (red) and cells with moistened window only (blue). The intensity is normalized to the high energy region. | ||
The full cell produced only weak resonance signals below the absorption edge at 2475 eV. The fluorescence signal is damped because of the self-absorption effect for the incident X-rays.20 Here the moistened window sample preparation led to a significant improvement in signal quality with drastically reduced self-absorption and uniform information depth due to the significantly decreased sample thickness. We assume to have produced thin films well below the critical thickness for self-absorption yielding in the optimal ratio of peak signals and the absorption edge by only moistening the window inside the coin cell. Therefore experimental spectra of pure substances are obtained with moistened cell windows in what follows, unless otherwise indicated.
The experimental spectrum of DMDS shows a lower energy peak at 2472.1 eV and a higher energy peak of slightly lower intensity at 2473.6 eV. The lower energy peak can be assigned to a transition of the S(1s) core electron to the anti-bonding (S–S)σ* orbital, while the higher energy peak corresponds to a transition to the anti-bonding (S–C)σ* orbital.21 We use these two energies indicated by the vertical thin lines as guiding lines for all NEXAFS spectra in the following.
2.2 Choice of method for computational NEXAFS spectra
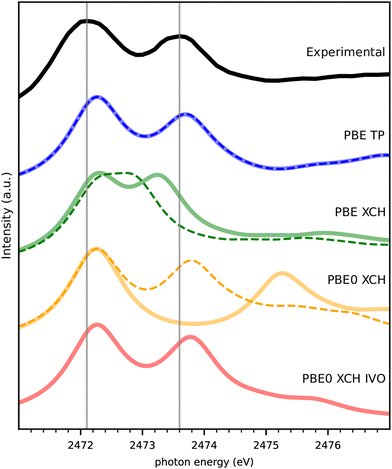
The experimental spectrum of DMDS is compared to our theoretical spectra calculated by several different methods in Fig. 2. Spin-paired spectra are drawn in thin dashed lines, and spin-polarized spectra in thick, solid lines. The first peak of all calculated spectra is shifted to the semi-empirically corrected transition energy obtained from a spin-polarized delta Kohn–Sham (Δ-KS) approximation using an excited core-hole (XCH) approach22 as detailed in Section 4 below. There is thus no other experimental information in the spectra than this semi-empirical shift that should be valid across different S(1s) related experiments. Fig. 2 shows the nearly perfect match of this approach to the first peak in the experiment (the so called “white line”), which allows us to predict experimental spectra on the absolute scale. The small deviation of 0.17 eV for the first peak maximum compared to experiment is well within the experimental uncertainty, i.e. the systematic error, and we do not further correct for it.Fig. 2 also reveals that the combination of the transition potential (TP) method with the PBE functional23 shows an excellent agreement to the experimental spectrum, with the PBE-TP peaks appearing only slightly higher in energy than the experimental ones caused be the uncertainty in absolute scale. Spin polarization has a negligible effect on these spectra, causing the two theoretical spectra to be superimposed. The combination of XCH and PBE results in an underestimation of the energy gap between the two peaks, which is particularly bad when spin polarization is not included in the calculation. The consideration of spin-polarization of the valence electron in the spin-densities containing a full core-hole in XCH has a considerably larger effect than for the half core-hole in TP. Nevertheless, this does not account for the full peak splitting seen in experiment.
We also compare computationally much more demanding calculations using the hybrid functional PBE0.24 The spin-polarized PBE0 calculation within XCH leads to a largely overestimated gap between the two peaks probably due to the nature of unoccupied states that describe rather electron affinities than neutral excitations in the Hartree–Fock part of the functional. Interestingly, a good match with experiment is recovered with PBE0-XCH when neglecting spin polarization. The spin polarized improved virtual orbitals (PBE0-XCH-IVO)25 also satisfactorily describe the neutral nature of the excitation of the second peak, this matching with experiment.
The excellent match of TP with experiment despite the underlying strong approximations is not unknown in the literature.26,27 We will see below that this holds also for the other spectra in our study and therefore stick to this computationally facile method in what follows.
2.3 Spectra of model compounds
Fig. 3 gives an overview of all measured spectra of pure substances compared to spectra simulated using the TP approximation. The experimental spectra of the following pure substances were obtained for moistened cell windows: monosulfide dipropyl sulfide (DPS), disulfides dimethyl disulfide (DMDS), dipropyl disulfide (DPDS), diisopropyl disulfide (DIPDS), di-tert-butyl disulfide (DTBDS), and trisulfide dimethyl trisulfide (DMTS). The experimental spectrum of crystalline dibenzyl disulfide (DBDS) was obtained by fixing the powder to the window by carbon tape. See Fig. S1 to S7 in ESI† for a more detailed description of the experimental spectra.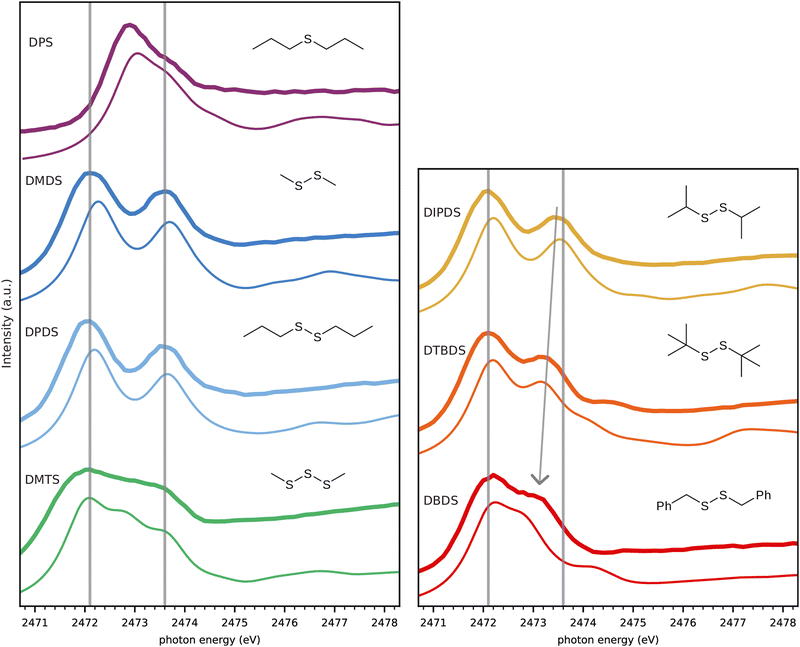 | ||
| Fig. 3 Comparison of experimental (thick lines) and calculated (thin lines) spectra, with guiding lines at the experimental DMDS peak energies (c.f. Fig. 2). The arrow indicates the evolution of the higher energy peak towards lower energies depending on the substituent. | ||
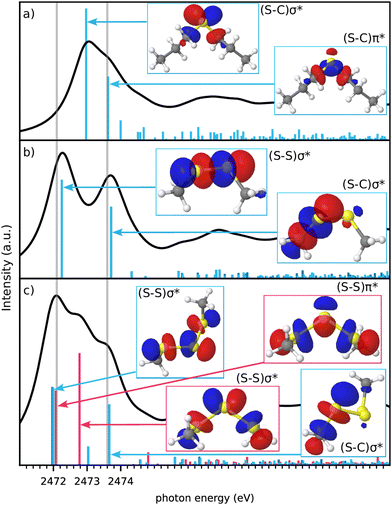
The simulated spectra are the folded combination of spectra obtained for half core-holes on each of the sulfur atoms within the molecule. The inclusion of the half core-hole in the calculation breaks the symmetry of the sulfur atoms and very generally there are two main transitions for each sulfur atom. We will detail more on the nature of these transitions in Fig. 4 below.
We observe an overall very good agreement in both appearance of the features as well as in their energetic positions between experiment and calculations. The lower energy guiding line energy from DMDS describes the first peak of all disulfides very well. The second peak shows some variation for DIPDS, DTBDS and in particular for DBDS, where the higher energy (S–C)σ* peak appears as a shoulder on the lower energy (S–S)σ* peak. The substitution effects on the (S–C)σ* peak in disulfides is well known and was shown to correlate with the induced Hammett-parameter,28 a measure of the capacity of a functional group to donate/withdraw electrons.29,30
Turning to DPS which has only one sulfur atom, the S–S bond and the corresponding peak is obviously missing. The (S–C)σ* peak is shifted to a lower energy, while the so called (S–C)π* peak is present as a shoulder at the position of the DMDS (S–C)σ* peak.27,31 The spectrum of the trisulfide, DMTS, has two peaks at similar positions to the disulfide, both very slightly redshifted,21 but also an additional peak in between.
We now address the origin of these possibly unexpected peaks for mono- and trisulfides. X-ray absorption in the single-particle picture corresponds to an excitation of a core orbital into an unoccupied valence orbital. The local nature of the core orbitals only allows for sufficient overlap with valence orbitals from the same core-excited atom. For the molecules investigated in this work, the lowest unoccupied orbitals in case of a S(1s) core excitation are the anti-bonding σ* orbitals of the S–S or S–C bonds. The (S–S)σ* orbitals are generally found at lower energies than the (S–C)σ* orbitals.18
Fig. 4 analyzes the valence orbitals corresponding to the strongest transitions in DPS, DMDS and DMTS. The simplest case is DMDS, where the orbitals are of clear anti-bonding (S–S)σ* type for the lower energy peak and anti-bonding (S–C)σ* type for the higher energy peak involving the S atom that contains the core-hole. Each S atom has a single S–C and a single S–S bond only.
This is different in DPS, where there are two S–C bonds and thus two degenerate (S–C)σ* orbitals now. These two orbitals couple to two states of distinct energy. Their asymmetric combination, labeled as (S–C)σ*, is found at lower energy, while their symmetric combination, labelled as (S–C)π* following literature,27,31 matches the S–C energy in DMDS. We note, that the orbital labelled as (S–C)π* has pure σ-character from the viewpoint of the carbon atom, however. We keep this traditional labelling nevertheless.
Turning to DMTS, there are two distinct types of sulfur atoms, those bonded to one C and one S atom, referred to as terminal S atoms, and those bonded only to other sulfur atoms, referred to as internal S atoms. The resonances of the terminal S atoms match those of the DMDS S atoms, with nearly the same energies. This shows the local nature of the corresponding transitions and involved states. The internal S atoms have distinctly different peak positions. Similar to the two degenerate (S–C)σ* bonds, the two degenerate (S–S)σ* bonds of the internal S atom couple to produce symmetric and asymmetric combinations. In accordance with the nomenclature for the S–C bonds, we call these (S–S)σ* and (S–S)π* resonances despite the clear σ-symmetry from the viewpoint of the sulfur atom without the core-hole. In contrast to S–C bonds, the symmetric combination is lower in energy than the asymmetric combination in the case of S–S bonds. The (S–S)π* resonance from the internal S atoms occurs at almost the same energy as the (S–S)σ* resonance from the terminal S atoms.
2.4 Longer sulfur chains
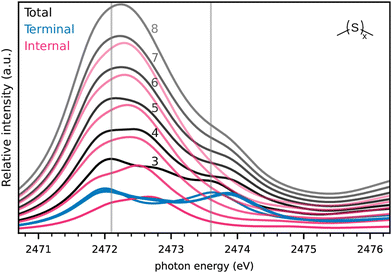
After this analysis and the confidence that the calculated spectra match with experiment even on an absolute energy scale, we turn to simulated spectra of longer sulfur chains in Fig. 5. These were simulated with methyl end-groups as dimethyl sulfides DMSx for computational simplicity corresponding to DMDS (=DMS2) and DMTS (=DMS3) above. We want to explore the possibility to obtain the strand length x from NEXAFS spectra. For these larger molecules, with their larger conformational spaces, we opted to generate Boltzmann-weighted spectra based on electronic energies at room temperature. The corresponding spectra using the lowest energy conformer only have been found to be very similar (see Fig. S8 in ESI†), however.The number of terminal S atoms is the same irrespective of the chain length and such is the corresponding contribution to the NEXAFS spectrum seen in Fig. 5: the contribution of the terminal S atoms (blue) to the total spectrum is practically constant in terms of intensity and energy underlining the locality of the corresponding states for chains of length 3 to 8.
Increasing the chain length increases the number of internal S atoms, however. Therefore the contribution of internal S atoms increases with increasing chain length as a rather broad peak around 2472 eV. Our results suggest that the S–C resonances centered at approximately 2473.8 eV are sufficiently higher in energy compared to the S–S resonances. This allows a determination of the S-chain length by comparing the corresponding peak areas at least at a qualitative level.
2.5 Application: cathodic sulfur network
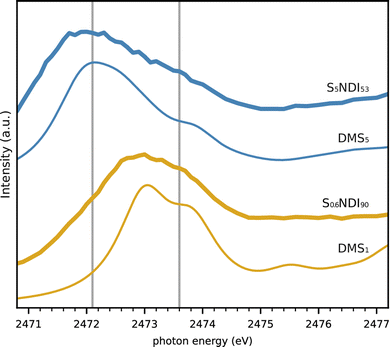
Sulfur is incorporated into a copolymer network via inverse vulcanisation in lithium sulfur batteries of interest here. Varying the ratio of sulfur to monomer in this reaction modifies the average length of the sulfur-crosslinks, i.e. the strand length. As an application to the experimental and theoretical findings regarding organic sulfide molecules, two polymer cathodes with different sulfur load have been investigated regarding their sulfur NEXAFS spectra. Here we have used two different ratios of S8 and the organic crosslinker N,N′-bis(2-propenyl)-1,4,5,8-naphthalenetetracarboxylic diimide (NDI), that produces an aliphatic residue next to S.19 In contrast to the common cross-linker 1,3-diisopro-penylbenzene (DIB)4 that does not allow for an easy differentiation between C–S and S–S bonds (c.f. Fig. S9 and S10 in ESI†), NDI allows for qualitative determination of S-strand lengths similar to DMSx in Fig. 5.The measurements were performed on coin cells of the same type as described above, equipped with cathodes containing 10 and 47 weight percent sulfur resulting in sulfur strands of average nominal length of 0.6 and 5 S atoms (S0.6NDI90 and S5NDI53), respectively. Electrolyte solvent without LiTFSI was added in order to reduce the concentration avoiding self-absorption effects. The equivalent measurements on SDIB cathodes (Fig. S11, ESI†) suggest that this is accomplished for sulfur loads of less than 50%. These S-NDI cathode NEXAFS spectra are shown in Fig. 6, along with guiding lines at the DMDS S–S and S–C peak energies. Both spectra display a peak with a shoulder on the high energy side, but the white lines occur at significantly different energies. For S0.6NDI90 the peak is situated at approximately 2473 eV, similarly to DPS, whereas the spectrum of S5NDI53 has its white line at approximately 2472 eV, similar to the species in this work containing 3 or more S atoms. Based on these spectra and the average S-strand lengths estimated from feed ratios, it is clear that S-strand lengths of 1 predominate in S0.6NDI90, while longer S-strands predominate in S5NDI53.
3 Conclusions
We have shown that experimental and simulated NEXAFS spectra of model components match perfectly for our model substances on the absolute energy scale if the semi-empirically corrected full-core-hole energy is taken for the first peak (the white line), while higher excitations are obtained from the transition potential approximation. Despite the harsh approximations of the latter, the transition potential has proved to be a computationally cheap method to predict measured spectra accurately.The locality of the NEXAFS excitations leads to two characteristic frequencies, one at lower energy corresponding to S–S anti-bonding states and one at higher energy corresponding to S–C anti-bonding states. This motivated us to use the corresponding frequencies from dimethyl-disulfide (DMDS) as general guidelines for the analysis of all spectra. The simulation of methyl-capped longer sulfur chains confirms the locality of the NEXAFS excitations and the resulting similarity of the peaks originating from the carbon bonded terminal S atoms to DMDS. The other sulfur atoms containing exclusively S–S bonds contribute to a broad peak in the lower energy region, which allows for an assignment of the average strand length at least at a qualitative level.
Measured NEXAFS spectra of NDI-sulfur reverse vulcanized material reveals the dominance of single sulfur atoms connected to carbon for very low sulfur content during polymerization. Larger sulfur content shows clear changes in the NEXAFS spectra, which much better comply with predictions for longer chain lengths. A quantitative determination of the average S-strand length in S5NDI53 based on NEXAFS spectra may be possible by applying a peak fitting procedure and comparing the areas of peaks centered at the S–S and S–C energies. We plan to explore this possibility in follow up studies.
4 Materials and methods
4.1 SNDI cathode preparation
4.2 NEXAFS experimental settings
The dimethyl trisulfide was purchased from Thermo Scientific, the remaining chemicals were purchased from Sigma-Aldrich Chemie GmbH, each in the highest available quality. All chemicals have not been dissolved.The experiments were run at the four crystal monochromator (FCM) beamline33 using the Si(111) crystal in the PTB laboratory of the Berlin Electron Storagy Ring for Synchrotron Radiation (BESSY II).
The experimental setup is optimized for X-ray spectrometric measurements on batteries,16 therefore the samples were prepared in CR2032 coin cell housings to fit in the previously used sample holder. This procedure also allows for measurements on liquid samples in a UHV setting. The exciting X-ray beam reaches the sample through a 12.7 μm thick Kapton window from Caplinq Europe BV or a 4 μm thick highly oriented pyrolytic graphite (HOPG) window from optigraph GmbH covering a hole in the positive case of the coin cell housing with a diameter of 2 mm.
In a 60 degree geometry between incident beam and detector, the emitted X-rays are detected in fluorescence yield mode with an energy-dispersive silicon drift detector (SDD) to integrate the characteristic X-ray radiation of sulfur in the sulfur K-edge energy range.
Chauvistré measured at ELSA with an InSb(111) DCM which has a resolution of 1.0 eV.21 However, the reproducibility of the ZnSO4 white line at 2481.44 eV was better than 0.03 eV. Compared to that, the uncertainty of the absolute energy scale at PTB's FCM beamline was much larger with up to 0.5 eV, but the resolution using the Si(111) FCM is also 0.5 eV and thus higher by the factor of 2. The repeatability is well below 0.1 eV because of the systematic energy calibration. The comparable quantity is therefore the relative energy shifts between the different samples. The S–S peak energy does not shift more than 0.2 eV in neither Chauvistré's values nor in our results. It also agrees with other reported results, e.g. by Behyan et al.18
4.3 Computational settings
The functional approximation devised by Perdew, Burke and Ernzerhof23 (PBE) was used throughout if not noted otherwise. The Kohn–Sham states were represented on real space grids with a grid spacing of 0.2 Å. Zero boundary conditions as appropriate for finite systems were applied, where the simulation box was ensured to contain at least 5 Å around each atom. The use of grids enables an easy and systematic convergence towards the complete basis set limit.36,38 Occupation number smearing (Fermi–Dirac distribution function, width 0.1 eV) was applied. GPAW interfaces with the Atomic Simulation Environment (ASE),39 a set of python modules and tools for managing atomistic simulation workflows.
DFT is a ground state theory, that should be unable to describe excited states in particular if these are at very different energy to the ground state after absorption of a X-ray photon. Therefore time-dependent DFT (TDDFT)41 or wave-function methods42 are employed for the calculation of NEXAFS spectra in the literature. In spite of this conceptual difficulty, the description of the core-hole excited states within a DFT ground state calculation involving a core-hole as employed here43 are extremely successful and match experimental observations.22,44 This success is understandable as the picture is very similar to the equivalent core approximation, where the atom with atomic number Z containing the core-hole is replaced by an atom with atomic number Z + 145 and the calculation of the ground state using DFT is completely valid.
Here we describe the presence of a core-excitation by the inclusion of the core-hole in the frozen core approximation.43 The frozen core of the sulfur atom containing the core-hole is obtained from a self-consistent calculation of a sulfur atom in the gas phase that contains only a singly occupied 1s shell. The resulting orbitals are used to construct the frozen core containing a core hole. This frozen core is then applied to each of the core-excited sulfur atoms in the molecules individually, i.e. a separate calculation is performed for each of the sulfur atoms in the system. The appearance of possibly problematic delocalized core-excitaions45 is thus excluded by construction. The spectra reported are the sum of all individual S(1s) spectra unless stated otherwise.
Despite the success in the prediction of experimental spectra, DFT calculations of these highly excited states either within TDDFT or within the single particle picture including a core-hole tend to differ largely in their total energy in comparison to experiment. Therefore, the theoretical spectra usually rigidly shifted, where shifts between 4.62 eV and 61.33 eV have been applied to match experiment for S(1s) NEXAFS studies.26,31,41,46,47 Similar large shifts are applied in related S(1s) X-ray emission spectroscopy simulations.17,48–50
We found similar shifts in the simulation of XPS spectra investigating a large number molecules, where accurate and well defined experimental molecular gas-phase studies exist.40 The value of the shift depends mainly on the nature of the core-hole and on the density functional approximation used, but is largely independent from the chemical environment of the core-excited atom. The exact reason for this shift is unclear, but it is reasonable to assume that probably difficulties in the description of the highly excited core-hole state within the single particle picture as well as due to small errors in the functional approximations are enhanced by the large energy differences involved in core excitations. As a practical solution, we have fitted these shifts to available experimental gas-phase data and used the resulting difference as a semi-empirical correction to obtain absolute core-excitation energies directly from DFT. The corrections obtained are found to be transferable for example to cationic clusters without change.51
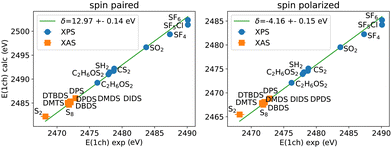
Here we use experimental gas-phase S(1s) XPS values52–56 to determine the corresponding semi-empirical correction for S(1s) core-excitations using the PBE functional as shown in Fig. 7. The calculations can be performed by spin paired or spin polarized treatment, where the missing electron density is included in the (valence) majority spin density for the latter.43 Similar to other core-excitations, also in S(1s) core-excitations a single shift independent of the chemical environment can be used to match experiment and calculations.
Assuming that the correction is connected to the nature of the core-hole excitation only, the same correction should appear in NEXAFS spectra also. We therefore have included the NEXAFS lowest energy peak positions (the so-called white line) from experiment for S2, S813,57,58 as well as the molecules measured in this work into the comparison shown in Fig. 7 (refer to Tables S1 and S2 in ESI† for the exact numbers). The NEXAFS first peaks align to the linear trend seen in XPS and extend the range of energies covered. As in the case of XPS for other elements and core states, we obtain two different values for spin-unpolarized and spin-polarized calculations‡. These have the same accuracy, however.
In an alternative approach, the orbitals are calculated with a core-hole that is forced to be fixed in some way. Such orbitals correspond much better to the core-excited state than the ground state orbitals do. Further valence excitations can in principle be determined via wave-function methods or TDDFT based on these orbitals. Often, however, the unoccupied orbital energies are taken as approximate excitation energies, despite the unclear nature of Kohn–Sham unoccupied states. A popular and often strikingly accurate approximation is that of using orbitals and their energies in the field of a partial core-hole. While rationalized by Slater's transition state (TS) theory60,61 and Janak's theorem it is not at all clear whether the underlying assumptions apply here. The best occupation numbers to use for both the empty core as well as the additional valence state and agreement with experiment varies for different assumptions. The so called excited core-hole (XCH) approximation, applied here for determining the energy of the first peak, assumes a completely empty core-state, while a single electron is placed in the lowest unoccupied orbital (LUMO), making it a singly occupied molecular orbital (SOMO). Then the total number of electrons is the same as in the ground state and thus usually an even number in case of molecules with a singlet ground state.
In the transition state (TS) approximation inspired by Slater's transition state theory, the core-hole as well as the LUMO (or any other unoccupied orbital) are half occupied and their energy difference should give a good approximation to the total energy difference between ground and core-excited states. A further simplification is achieved by the transition potential (TP) method,43,44,62 where only the (frozen) core orbital is half occupied, but the conduction band states are empty. This is computationally effective as all the excitations are calculated in a single step.
In all approximations, the NEXAFS intensities (oscillator strengths) are calculated from the dipole matrix elements between the unoccupied Kohn–sham states and the corresponding core-orbital within the frozen core approximation.43 The oscillator strengths are folded by Lorentzians (Cauchy distributions) with full width at half maximum of 1.1 eV to match experimental resolution.
Author contributions
SdK and MW performed calculations. KS measured NEXAFS spectra and RM synthesized the inverse vulcanized NDI-sulfur battery material. MM, MS and MW designed the full project and all authors participated in writing.Conflicts of interest
There are no conflicts to declare.Acknowledgements
M. S., M. M. and M. W. thank Soumyadip Choudhury for intense discussion about lithium–sulfur cathode materials. S. d. K and M. W. thank Rolf Würdemann and Yannik Schütze for useful discussions. We acknowledge funding by the German Research Foundation (DFG) through the Priority Programme “Polymer-based Batteries” (SPP 2248) under the projects CH 2376/2-1, MU 4632/1-1 and WA 1687/12-1. S. d. K. and M. W. acknowledge computational ressources from the state of Baden-Württemberg through bw-HPC and DFG through grant no INST 40/575-1 FUGG (JUSTUS2 cluster). K. S. and M. M. thank Burkhard Beckhoff and Claudia Zech for providing the instrumentation and give access to previous experimental works.Notes and references
- A. Manthiram, Y. Fu, S.-H. Chung, C. Zu and Y.-S. Su, Chem. Rev., 2014, 114, 11751–11787 CrossRef CAS PubMed.
- N. Nitta, F. Wu, J. T. Lee and G. Yushin, Mater. Today, 2015, 18, 252–264 CrossRef CAS.
- T. Li, X. Bai, U. Gulzar, Y. Bai, C. Capiglia, W. Deng, X. Zhou, Z. Liu, Z. Feng and R. Proietti Zaccaria, Adv. Funct. Mater., 2019, 29, 1901730 CrossRef.
- W. J. Chung, J. J. Griebel, E. T. Kim, H. Yoon, A. G. Simmonds, H. Jun Ji, P. T. Dirlam, R. S. Glass, J. J. Wie, N. A. Nguyen, B. W. Guralnick, J. Park, A. Somogyi, P. Theato, M. E. Mackay, Y.-E. Sung, K. Char and J. Pyun, Nat. Chem., 2013, 5, 518–524 CrossRef CAS PubMed.
- A. G. Simmonds, J. J. Griebel, J. Park, K. R. Kim, W. J. Chung, V. P. Oleshko, J. Kim, E. T. Kim, R. S. Glass, C. L. Soles, Y.-E. Sung, K. Char and J. Pyun, ACS Macro Lett., 2014, 3, 229–232 CrossRef CAS PubMed.
- J. Park, E. T. Kim, C. Kim, J. Pyun, H.-S. Jang, J. Shin, J. W. Choi, K. Char and Y.-E. Sung, Adv. Energy Mater., 2017, 7, 1700074 CrossRef.
- M. Wu, Y. Cui, A. Bhargav, Y. Losovyj, A. Siegel, M. Agarwal, Y. Ma and Y. Fu, Angew. Chem., Int. Ed., 2016, 55, 10027–10031 CrossRef CAS PubMed.
- A. Hoefling, D. T. Nguyen, P. Partovi-Azar, D. Sebastiani, P. Theato, S.-W. Song and Y. J. Lee, Chem. Mater., 2018, 30, 2915–2923 CrossRef CAS.
- S. Park, S.-J. Kim, Y.-E. Sung, K. Char and J. G. Son, ACS Appl. Mater. Interfaces, 2019, 11, 45785–45795 CrossRef CAS PubMed.
- A. Rafie, R. Pereira, A. A. Shamsabadi and V. Kalra, J. Phys. Chem. C, 2022, 126, 12327–12338 CrossRef CAS.
- R. Kiani, D. Sebastiani and P. Partovi-Azar, ChemPhysChem, 2022, 23, e202100519 CrossRef CAS PubMed.
- Y. Schütze, R. de Oliveira Silva, J. Ning, J. Rappich, Y. Lu, V. G. Ruiz, A. Bande and J. Dzubiella, Phys. Chem. Chem. Phys., 2021, 23, 26709–26720 RSC.
- M. Müller, S. Choudhury, K. Gruber, V. B. Cruz, B. Fuchsbichler, T. Jacob, S. Koller, M. Stamm, L. Ionov and B. Beckhoff, Spectrochim. Acta, Part B, 2014, 94–95, 22–26 CrossRef.
- Y. Gorlin, A. Siebel, M. Piana, T. Huthwelker, H. Jha, G. Monsch, F. Kraus, H. A. Gasteiger and M. Tromp, J. Electrochem. Soc., 2015, 162, A1146 CrossRef CAS.
- L. Zhang and J. Guo, Arabian J. Sci. Eng., 2019, 44, 6217–6229 CrossRef CAS.
- C. Zech, P. Hönicke, Y. Kayser, S. Risse, O. Grätz, M. Stamm and B. Beckhoff, J. Mater. Chem. A, 2021, 9, 10231–10239 RSC.
- M. Qureshi, S. H. Nowak, L. I. Vogt, J. J. H. Cotelesage, N. V. Dolgova, S. Sharifi, T. Kroll, D. Nordlund, R. Alonso-Mori, T.-C. Weng, I. J. Pickering, G. N. George and D. Sokaras, Phys. Chem. Chem. Phys., 2021, 23, 4500–4508 RSC.
- S. Behyan, Y. Hu and S. G. Urquhart, Chem. Phys. Lett., 2014, 592, 109–113 CrossRef CAS.
- R. Matsidik, K. Skudler, S. de Kock, A. Seifert, S. Choudhury, M. Müller, M. Walter and M. Sommer, to be published.
- L. Tröger, D. Arvanitis, K. Baberschke, H. Michaelis, U. Grimm and E. Zschech, Phys. Rev. B: Condens. Matter Mater. Phys., 1992, 46, 3283–3289 CrossRef PubMed.
- R. Chauvistré, J. Hormes, E. Hartmann, N. Etzenbach, R. Hosch and J. Hahn, Chem. Phys., 1997, 223, 293–302 CrossRef.
- D. Prendergast and G. Galli, Phys. Rev. Lett., 2006, 96, 215502 CrossRef PubMed.
- J. P. Perdew, K. Burke and M. Ernzerhof, Phys. Rev. Lett., 1996, 77, 3865–3868 CrossRef CAS PubMed.
- J. P. Perdew, M. Ernzerhof and K. Burke, J. Chem. Phys., 1996, 105, 9982–9985 CrossRef CAS.
- R. Würdemann and M. Walter, J. Chem. Theory Comput., 2018, 14, 3667–3676 CrossRef PubMed.
- A. Mijovilovich, L. G. M. Pettersson, S. Mangold, M. Janousch, J. Susini, M. Salome, F. M. F. de Groot and B. M. Weckhuysen, J. Phys. Chem. A, 2009, 113, 2750–2756 CrossRef CAS PubMed.
- A. Mijovilovich, L. G. M. Pettersson, F. M. F. de Groot and B. M. Weckhuysen, J. Phys. Chem. A, 2010, 114, 9523–9528 CrossRef CAS PubMed.
- I. J. Pickering, M. Barney, J. J. H. Cotelesage, L. Vogt, M. J. Pushie, A. Nissan, R. C. Prince and G. N. George, J. Phys. Chem. A, 2016, 120, 7279–7286 CrossRef CAS PubMed.
- L. P. Hammett, Chem. Rev., 1935, 17, 125–136 CrossRef CAS.
- O. Brügner, T. Reichenbach, M. Sommer and M. Walter, J. Phys. Chem. A, 2017, 121, 2683–2687 CrossRef PubMed.
- J. J. H. Cotelesage, M. Barney, L. Vogt, I. J. Pickering and G. N. George, J. Phys. Chem. A, 2017, 121, 6256–6261 CrossRef CAS PubMed.
- C. Sotirou-Leventis, Z. Mao and A. Rawashdeh, J. Org. Chem., 2000, 65, 6017–6023 CrossRef PubMed.
- M. Krumrey and G. Ulm, Nucl. Instrum. Methods Phys. Res., Sect. A, 2001, 467–468, 1175–1178 CrossRef CAS.
- G. Landrum, P. Tosco, B. Kelley, Ric, Sriniker, Gedeck, R. Vianello, Nadine Schneider, E. Kawashima, D. Cosgrove, A. Dalke, N. Dan, G. Jones, B. Cole, M. Swain, S. Turk, Alexander Savelyev, A. Vaucher, M. Wójcikowski, I. Take, D. Probst, K. Ujihara, V. F. Scalfani, guillaume godin, A. Pahl and F. Berenger, JLVarjo, strets123, JP and Doliath Gavid, rdkit/rdkit: 2022_03_5 (Q1 2022) Release, 2022 DOI:10.5281/zenodo.6961488.
- C. Bannwarth, S. Ehlert and S. Grimme, J. Chem. Theory Comput., 2019, 15, 1652–1671 CrossRef CAS PubMed.
- J. J. Mortensen, L. B. Hansen and K. W. Jacobsen, Phys. Rev. B: Condens. Matter Mater. Phys., 2005, 71, 035109 CrossRef.
- J. Enkovaara, C. Rostgaard, J. J. Mortensen, J. Chen, M. Dułak, L. Ferrighi, J. Gavnholt, C. Glinsvad, V. Haikola, H. A. Hansen, H. H. Kristoffersen, M. Kuisma, A. H. Larsen, L. Lehtovaara, M. Ljungberg, O. Lopez-Acevedo, P. G. Moses, J. Ojanen, T. Olsen, V. Petzold, N. A. Romero, J. Stausholm-Møller, M. Strange, G. A. Tritsaris, M. Vanin, M. Walter, B. Hammer, H. Häkkinen, G. K. H. Madsen, R. M. Nieminen, J. K. Nørskov, M. Puska, T. T. Rantala, J. Schiøtz, K. S. Thygesen and K. W. Jacobsen, J. Phys.: Condens. Matter, 2010, 22, 253202 CrossRef CAS PubMed.
- R. Würdemann, H. H. Kristoffersen, M. Moseler and M. Walter, J. Chem. Phys., 2015, 142, 124316 CrossRef PubMed.
- A. H. Larsen, J. J. Mortensen, J. Blomqvist, I. E. Castelli, R. Christensen, M. Dułak, J. Friis, M. N. Groves, B. Hammer, C. Hargus, E. D. Hermes, P. C. Jennings, P. B. Jensen, J. Kermode, J. R. Kitchin, E. L. Kolsbjerg, J. Kubal, K. Kaasbjerg, S. Lysgaard, J. B. Maronsson, T. Maxson, T. Olsen, L. Pastewka, A. Peterson, C. Rostgaard, J. Schiøtz, O. Schütt, M. Strange, K. S. Thygesen, T. Vegge, L. Vilhelmsen, M. Walter, Z. Zeng and K. W. Jacobsen, J. Phys.: Condens. Matter, 2017, 29, 273002 CrossRef PubMed.
- M. Walter, M. Moseler and L. Pastewka, Phys. Rev. B, 2016, 94, 041112 CrossRef.
- A. Andersen, N. N. Rajput, K. S. Han, H. Pan, N. Govind, K. A. Persson, K. T. Mueller and V. Murugesan, Chem. Mater., 2019, 31, 2308–2319 CrossRef CAS.
- T. Fransson, I. E. Brumboiu, M. L. Vidal, P. Norman, S. Coriani and A. Dreuw, J. Chem. Theory Comput., 2021, 17, 1618–1637 CrossRef CAS PubMed.
- M. Leetmaa, M. P. Ljungberg, A. Lyubartsev, A. Nilsson and L. G. M. Pettersson, J. Electron Spectrosc. Relat. Phenom., 2010, 177, 135–157 CrossRef CAS.
- L. Triguero, L. G. M. Pettersson and H. Ågren, Phys. Rev. B: Condens. Matter Mater. Phys., 1998, 58, 8097–8110 CrossRef CAS.
- P. Norman and A. Dreuw, Chem. Rev., 2018, 118, 7208–7248 CrossRef CAS PubMed.
- S. DeBeer George and F. Neese, Inorg. Chem., 2010, 49, 1849–1853 CrossRef CAS PubMed.
- S. Behyan, Y. Hu and S. G. Urquhart, J. Chem. Phys., 2011, 134, 244304 CrossRef PubMed.
- N. A. Besley, Acc. Chem. Res., 2020, 53, 1306–1315 CrossRef CAS PubMed.
- M. Petric, A. Rajh, A. Vizintin, S. D. Talian, R. Dominko and M. Kavčič, Chem. Commun., 2021, 57, 7573–7576 RSC.
- W. M. Holden, E. P. Jahrman, N. Govind and G. T. Seidler, J. Phys. Chem. A, 2020, 124, 5415–5434 CrossRef CAS PubMed.
- M. Walter, M. Vogel, V. Zamudio-Bayer, R. Lindblad, T. Reichenbach, K. Hirsch, A. Langenberg, J. Rittmann, A. Kulesza, R. Mitrić, M. Moseler, T. Möller, B. von Issendorff and T. J. Lau, Phys. Chem. Chem. Phys., 2019, 21, 6651–6661 RSC.
- W. L. Jolly, K. D. Bomben and C. J. Eyermann, At. Data Nucl. Data Tables, 1984, 31, 433–493 CrossRef CAS.
- C. Reynaud, S. Bodeur, J. Maréchal, D. Bazin, P. Millié, I. Nenner, U. Rockland and H. Baumgärtel, Chem. Phys., 1992, 166, 411–424 CrossRef CAS.
- E. Suoninen, T. Thomas, S. Anderson, M. Runyan and L. Ungier, J. Electron Spectrosc. Relat. Phenom., 1985, 35, 259–272 CrossRef CAS.
- R. N. Sodhi and R. G. Cavell, J. Electron Spectrosc. Relat. Phenom., 1986, 41, 1–24 CrossRef CAS.
- R. C. C. Perera and R. E. LaVilla, J. Chem. Phys., 1984, 81, 3375–3382 CrossRef CAS.
- E. Rül, R. Flesch, W. Tappe, D. Novikov and N. Kosugi, J. Chem. Phys., 2002, 116, 3316–3322 CrossRef.
- T. A. Pascal, K. H. Wujcik, J. Velasco-Velez, C. Wu, A. A. Teran, M. Kapilashrami, J. Cabana, J. Guo, M. Salmeron, N. Balsara and D. Prendergast, J. Phys. Chem. Lett., 2014, 5, 1547–1551 CrossRef CAS PubMed.
- N. T. Maitra, F. Zhang, R. J. Cave and K. Burke, J. Chem. Phys., 2004, 120, 5932–5937 CrossRef CAS PubMed.
- J. C. Slater, Advances in Quantum Chemistry, Elsevier, 1972, vol. 6, pp. 1–92 Search PubMed.
- J. C. Slater and K. H. Johnson, Phys. Rev. B: Solid State, 1972, 5, 844–853 CrossRef.
- M. Ljungberg, J. Mortensen and L. Pettersson, J. Electron Spectrosc. Relat. Phenom., 2011, 184, 427–439 CrossRef CAS.
Footnotes |
| † Electronic supplementary information (ESI) available: Detailed analysis of experimental spectra, tabulated values used for S(1s) total energy correction, simulated and mearued spectra of DIB cathodes. See DOI: https://doi.org/10.1039/d3cp02285d |
| ‡ The core-hole (and the extra valence electron in NEXAFS) is present in the total density in spin-paired calculations, but only in the α-spin density in spin-polarized calculations. |
| This journal is © the Owner Societies 2023 |

