 Open Access Article
Creative Commons Attribution 3.0 Unported Licence
Photoinduced absorption spectroscopy (PIAS) study of water and chloride oxidation by a WO3 photoanode in acidic solution†
James
Johnston
 *,
Christopher
O’Rourke
 and
Andrew
Mills

School of Chemistry and Chemical Engineering, Queens University Belfast, Stranmillis Road, Belfast, BT9 5AG, UK. E-mail: jjohnston497@qub.ac.uk
First published on 2nd November 2023
Abstract
The mechanisms of water and chloride oxidation by a WO3 photoanode are probed by photoinduced absorption spectroscopy (PIAS) coupled with transient photocurrent (TC) measurements. Linear sweep voltammograms (LSVs) and incident photon to current efficiencies (IPCEs) are obtained, in the water oxidation electrolyte (1 M HClO4) and chloride oxidation electrolyte (3.5 M NaCl in 1 M HClO4). Other work shows that the faradaic efficiency of water oxidation to O2 in 1 M HClO4 is ca. 1.0, and that for chloride oxidation to Cl2 in 3.5 M NaCl plus 1 M HClO4 is ca. 0.62. The PIAS/TC data reveals a 0.4 order dependency of the rate of water oxidation on the steady state concentration of photogenerated surface holes, [hs+]ss, and an approximately first order dependency of the rate of chloride oxidation on [hs+]ss. Associated mechanisms and rate determining steps for water and chloride oxidation at the photoanode surface that account for these reaction orders are proposed.
1. Introduction
The development of efficient solar to chemical energy conversion systems continues to be a prominent research topic in the field of semiconductor photochemistry. Most of this research has focused on an overall electrochemical process in which the reduction reaction is that of water by photogenerated electrons to produce hydrogen, and the oxidation reaction by the photogenerated holes, h+, is either that of water (reaction (1)), i.e., water-splitting,1| 2H2O + 4h+ → O2 + 4H+ | (1) |
| 2Cl− + 2h+ → Cl2 + 2e− | (2) |
In any study of a photoanode for reactions (1) or (2), it is necessary to establish that the associated faradaic efficiency, f, is unity, since, depending on the electrolyte used, many other oxidation reactions are possible. For example, in 1987, Desilvestro and Grätzel, using a WO3 photoanode in SO42− solution, found that the faradaic efficiency for O2 generation, fO2, decreased with decreasing pH and increasing SO42− concentration, due to the following competing reaction,6
| 2SO42− + 2h+ → S2O82− + 2e− | (3) |
| Annealed photoanodea | pH | Electrolyte anion (molarity) | f O2 | f Cl | IPCEc | Notes | Ref. |
|---|---|---|---|---|---|---|---|
| a Photoanodes were typically annealed between 450 °C and 550 °C. b f O2 and fCl refer here to the faradaic efficiencies of O2 generation, and Cl− oxidation respectively. c IPCE refers to the incident photon to current efficiency. | |||||||
| WO3 powder dispersion applied to Ti sheet | 1–5.5 | SO42− (0.01–3 M) | From 0.3–0.95 | — | — | In SO42− solutions, fO2 increased with decreasing [SO42−] and increasing pH. Reported generation of S2O82−. fCl determined by iodometric titration. | 6 |
| 1 | ClO4− (0.1 M) | 0.81 | — | ||||
| 0 | Cl− (1 M) | — | 0.76 | ||||
| Electro-deposited on conductive glass | 0 | SO42− (1 M) | 0 | — | — | Proposed that ClO4− is oxidized to a radical, which then generates O2 in solution. | 7 |
| 0 | ClO4− (1 M) | ca. 1 | — | ||||
| Aerosol assisted chemical vapour deposition | 1 | SO42− (0.1 M) | 0.87 | — | ✓ | Suggested the relatively high fO2 value is due to the needle nanostructure of the photoanode. Used transient diffuse reflectance spectroscopy to probe charge recombination. | 10 |
| Electro-deposition on FTO | 1–6 | SO42− (0.1 M) and Cl− (0.01–0.05 M) | — | ≤0.60 | — | Measured free chlorine species by colourimetric method, and noted generation of ClO3− (by ion chromatography) under UV irradiation conditions. | 11 |
| Sol gel precursor applied by doctor blade, layer by layer | 2 | Cl− (0.5 M) | — | 0.70 | ✓ | Colorimetric method was used to determine fCl (0.70). It was assumed that fO2 = 0.30, but not measured. | 12 |
The notes in Table 1 highlight the fact that in most studies conducted using a WO3 photoanode in acidic solution with a high chloride concentration, the faradaic efficiency of chloride oxidation, fCl, has often been determined by a colourimetric method, which can assess the amount of oxidising chlorine species generated photoelectrochemically (such as Cl2, ClO−, HOCl, HClO2, ClO3−), but provides no information about chemical composition and so no insight into what exactly is being generated.11 Thus, in none of this previous work is the faradaic efficiency for Cl2 generation, fCl2, measured.
While most of the studies listed in Table 1 have reported photocurrents, and a few have included incident photon to current efficiency (IPCE) vs. wavelength profiles, such parameters provide little insight into the mechanism of the specific photo-oxidation reactions taking place. Recently, photoinduced absorption spectroscopy (PIAS) coupled with transient current, TC, measurements, i.e., PIAS/TC, has emerged as a method for probing the mechanism of photoanodic water oxidation by relating the rate of reaction (1), as measured by the photocurrent, J, to the steady-state concentration of photogenerated surface holes, [hs+]ss, as measured by the steady state absorbance change ΔAbsss of the photoanode, monitored at an appropriate wavelength.13–16 From such measurements, the order of reaction (1) with respect to the holes, n, can be determined, thereby providing an insight into the mechanism and rate determining step. Consequently, PIAS/TC has been used to probe the mechanism of reaction (1) for a wide variety of different semiconductor oxide photoanodes, including TiO2, Fe2O3, BiVO4 and WO3.13–16 Note, however, that as the latter WO3 PIAS/TC study was performed in H2SO4,16 and fO2 was not measured, it is not reasonable to assume the photo-electrochemical oxidation reaction is that of water to O2, i.e., reaction (1); indeed, for reasons outlined earlier, it is most likely that the values of n reported in this work (namely, 1 at lower surface hole densities and 2.5 at higher surface hole densities)16 relate to either reaction (3) or a mixture of reactions (3) and (1). In contrast, in this paper, the results of a PIAS/TC mechanistic study of reactions (1) and (2), using a WO3 photoanode in HClO4 (1 M), without and with a high (3.5 M) concentration of chloride, are described, along with faradaic efficiency measurements; this combination of results is used to help identify the mechanisms associated with the major electrochemical processes associated with the observed photocurrents.
2. Experimental
2.1. Materials
Unless stated otherwise, all chemicals were purchased from Merck (Darmstadt, Germany) and used as received; the water was doubly distilled and deionised. Argon gas cylinders were purchased from BOC (Woking, UK).2.2. Methods
Linear sweep voltammograms, LSVs, and measurements for the faradaic efficiency of O2 and Cl2 generation (fO2 and fCl2 respectively) were performed with the electrodes and electrolyte housed in a PTFE electrochemical reaction cell illustrated in Section S1 in the ESI.† Prior to recording LSVs, and determining faradaic efficiencies, the electrolyte (10 mL) was purged with Ar for 10 minutes. LSVs were recorded with a scan rate of 5 mV s−1. In all LSV and faradaic efficiency measurements, the photoanode was irradiated with 40 mW cm−2 UVA radiation, which was delivered by a 10 W, 365 nm LED (LZ4-44UV00-0000, LedEngin Inc., San Jose, US). UV irradiance was measured using a UV power meter (C10427 H10428, Hamamatsu Photonics, Hamamatsu City, Japan).
To determine fO2, an O2 sensitive fluorescence-based sensor (O2xyDot®, OxySense, Devens, USA) and probe (NEOFOX-GT, Ocean Insight, Orlando, USA) were used. The WO3 photoanode was placed in the HClO4 electrolyte, and while irradiated with 40 mW cm−2 365 nm UVA, a potentiostat (Autolab PGSTAT128N, Metrohm AG, Herisau, Switzerland) was used to poise it at a potential (ca. 1.0 V vs. Ag/AgCl) which would generate a steady current density of 0.1 mA cm−2. In this work, the reaction cell was continually flushed with Ar (0.1 mL s−1), and the % O2 in the gas outlet monitored by the O2 sensor. The data from this study allowed the value of fO2 (= ca. 1) to be calculated. A schematic illustration of the system, a typical set of results and their use in the subsequent calculation of fO2 = ca. 1 are given in Section S2 of the ESI.†
To determine fCl2 for the WO3 photoanode placed in the NaCl/HClO4 electrolyte, a Drechsel bottle containing a 100 mL aqueous solution of KI (0.36 M), potassium hydrogen phthalate (0.049 M), and NaOH (0.025 M) was placed after the electrochemical cell to trap chemically from the sparging Ar stream any Cl2 produced via the photoelectrochemical anodic reaction (2).18 Thus, in this work, the WO3 photoanode was irradiated (40 mW cm−2, 365 nm) and poised at 1 V vs. Ag/AgCl for 30 minutes, while the sealed PTFE electrochemical reaction cell was purged continuously with Ar, thereby flushing any photogenerated Cl2 from the reaction solution in the photoelectrochemical reactor through to the KI trap solution, where it generated I3−, which absorbs strongly at 353 nm (ε353 = 26![[thin space (1/6-em)]](https://www.rsc.org/images/entities/char_2009.gif) 400 mol−1 cm−1).19 By measuring the absorbance of the trap solution, the concentration of I3−, and by extension the amount of photogenerated Cl2, was determined. From the results of this work a fCl2 value of ca. 0.62 was determined for the WO3 photoanode in the NaCl/HClO4 electrolyte. A schematic illustration of the system, a typical set of results and their use in the subsequent calculation of fCl2 = ca. 0.62 are given in Section S3 in the ESI.† In this Cl2-trapping experiment no O2 was detected in the Ar purge gas stream after the trap, thereby indicating that the 0.38 deficit in the fCl2 value is due to a chloride oxidation product, which still could be Cl2 that has reacted/decomposed before it reaches the KI trap, and/or one or more dissolved Cl− oxidation products, such as ClO4−. The same Cl2-trapping experiment carried out using a much higher irradiance (80 instead of 40 mW cm−2) produced no change in fCl2.
400 mol−1 cm−1).19 By measuring the absorbance of the trap solution, the concentration of I3−, and by extension the amount of photogenerated Cl2, was determined. From the results of this work a fCl2 value of ca. 0.62 was determined for the WO3 photoanode in the NaCl/HClO4 electrolyte. A schematic illustration of the system, a typical set of results and their use in the subsequent calculation of fCl2 = ca. 0.62 are given in Section S3 in the ESI.† In this Cl2-trapping experiment no O2 was detected in the Ar purge gas stream after the trap, thereby indicating that the 0.38 deficit in the fCl2 value is due to a chloride oxidation product, which still could be Cl2 that has reacted/decomposed before it reaches the KI trap, and/or one or more dissolved Cl− oxidation products, such as ClO4−. The same Cl2-trapping experiment carried out using a much higher irradiance (80 instead of 40 mW cm−2) produced no change in fCl2.
3. Results and discussion
3.1. WO3 photoanode characterisation
The thickness of the thin film of WO3 on a typical photoanode used in this work was determined to be ca. 240 nm using a profilometer. The film was quite light scattering, as illustrated by the photograph in Fig. 1. As a result, the diffuse reflectance spectrum of the film was recorded, rather than its absorption spectrum, the results of which are also illustrated in Fig. 1. The results of a Tauc analysis of this spectrum (details of which are given in Section S7 in the ESI†) suggests a band gap energy, Ebg, of 2.7 eV, which is consistent with the value range of 2.6–2.8 eV reported previously by others for this material.5,8,11,20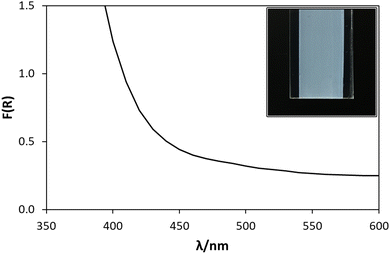 | ||
| Fig. 1 F(R) vs. λ spectrum of the WO3 photoanode (pictured in inset image), where F(R) is the Kubelka–Munk remission function, determined from the diffuse reflectance (Rλ) of the photoanode (F(R)λ = (1 − Rλ2)/2Rλ).21 | ||
SEM images of the surface of the WO3 photoanode film were also recorded and the results are illustrated in Fig. 2. These images show the film comprises agglomerate particles, averaging 130 ± 30 nm in diameter, which are in turn are made up of 10 ± 2 nm diameter particles.
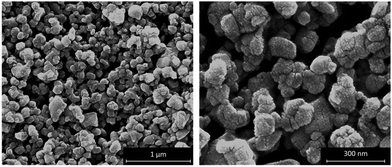 | ||
Fig. 2 SEM images of the surface of WO3 photoanodes at 100![[thin space (1/6-em)]](https://www.rsc.org/images/entities/char_2009.gif) 000× and 300 000× and 300![[thin space (1/6-em)]](https://www.rsc.org/images/entities/char_2009.gif) 000× magnification. The average agglomerate particle size is 130 ± 30 nm agglomerates made up of 10 ± 2 nm particles. 000× magnification. The average agglomerate particle size is 130 ± 30 nm agglomerates made up of 10 ± 2 nm particles. | ||
The XRD pattern of the WO3 powder used to prepare the photoanodes is shown in Section S8 in the ESI† and is consistent with a monoclinic crystal structure.22,23 The above results help define the nature the WO3 photoanode used in this work and so aid its future reproduction by others and comparison with WO3 photoanodes prepared using other methods, such as outlined in Table 1.
3.2. Photoelectrochemical characterisation
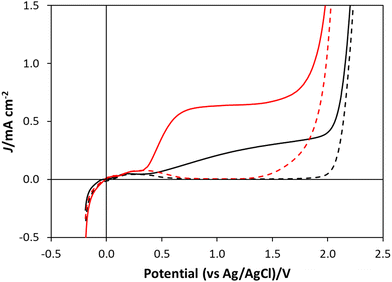
A detailed schematic illustration of the electrochemical cell used in this work is given in Fig. S1 in Section S1 of the ESI.† In this cell the WO3 on FTO photoanode was used to cover the hole in the base of the photo-electrochemical reaction cell and irradiated through the back of the FTO glass. A coiled Pt wire was used as the counter electrode and an Ag/AgCl electrode was used as the reference electrode, with HClO4 as the electrolyte for water oxidation and NaCl/HClO4 as the electrolyte for chloride oxidation. The linear sweep voltammogram, LSV, profiles generated using this setup, both for water oxidation and chloride oxidation electrolyte, in which the applied potential was varied from −0.3 V to 2.5 V vs. Ag/AgCl at a sweep rate of 5 mV s−1, were recorded under dark and illuminated (40 mW cm−2, 365 nm) conditions. The results of this work are shown in Fig. 3, with the black and red traces corresponding to the water and chloride oxidation electrolytes, respectively. These results show that, under UV irradiation, there is an onset of photocurrent at potentials ca. 0.4 V, both in HClO4, and NaCl/HClO4 electrolytes, with the latter exhibiting a notable plateau photocurrent of ca. 0.62 mA cm−2 at ca. 0.8 V vs. Ag/AgCl, and the former reaching a much lower (by a factor of about 2) plateau photocurrent (of ca. 0.28 mA cm−2) at ca. 1.35 V vs. Ag/AgCl.Initially, one might expect the observed photocurrent associated with water oxidation to be larger than that for chloride, since the standard redox potential for the former is only 1.23 V, compared with 1.36 V for the latter,7 but the larger photocurrent in the presence of Cl− is consistent with previous reports;3,7 for example, Lewis et al. reported the plateau photocurrent for their WO3 photoanode in 1 M HCl was ca. 1.5×'s that in 1 M HClO4.7 The high plateau photocurrent for reaction (2), compared to that of reaction (1) is most probably due to the much simpler mechanism, and so more facile kinetics, for reaction (2), a 2 electron process, compared with reaction (1), a 4 electron process since the more complex mechanism of the latter reaction would be expected to result in a much larger overpotential.3 The results of stability studies on the photocurrents exhibited by the WO3 photoanode poised at 1.3 V vs. Ag/AgCl in either HClO4, or NaCl/HClO4 solution, over 24 h irradiation are described in Section S9 in the ESI.† In both cases it appears that the photocurrents are long-lived and stable, which suggests that photocorrosion is minimal in either system.
The incident photon to current efficiency (IPCE) values were also recorded for the WO3 photoanode in the two electrolytes (i.e., HClO4 or NaCl/HClO4) as a function of excitation wavelength, λexcit, and the results of this work are shown in Fig. 4.
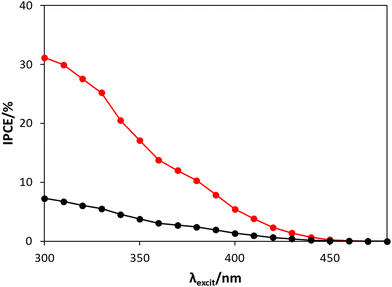 | ||
| Fig. 4 The IPCE spectra between 300 to 480 nm for the WO3 photoanode, poised at 1.3 V vs. Ag/AgCl, in HClO4 (black) and NaCl/HClO4 (red), irradiated by a combined monochromator/1 kW Xe-Arc lamp system. As noted earlier, a detailed description of how this data was obtained is given in Section S5, in the ESI.† | ||
From Fig. 4, the IPCE values at 365 nm in HClO4 (IPCE = 2.9%) and NaCl/HClO4 (IPCE = 12.9%) are both relatively low compared to IPCE values at 365 nm reported by others, such as 62% (for a 1 μm thick WO3 photoanode in 0.1 M HClO4)24 and 71% (for a ca. 3 μm thick WO3 photoanode in 0.01 M HCl/0.5 M NaCl solution).12 However, the lower IPCE values in this work are not too surprising given that much thinner, and so more transparent, WO3 films were used (ca. 240 nm thick) and so, in comparison, will absorb much less of the incident UV radiation. The much greater IPCE values recorded in NaCl/HClO4, compared with HClO4, are consistent with work by others,3,7 and is most likely because (i) the overpotential for chloride oxidation, reaction (2), is significantly lower than that for water oxidation, reaction (1), and (ii) the exchange current density for reaction (2) is much greater than that for water oxidation. The IPCE spectra illustrated in Fig. 4 show that the WO3 photoanode does indeed respond in the visible light range (between 400 nm to 450 nm), but that the photocurrent increases with decreasing λexcit; a feature that is consistent with a previously reported IPCE spectrum for a WO3 photoanode in HClO4.24
3.3. Photoelectrochemical water oxidation: fO2, PIAS and mechanism
As noted earlier, the faradaic efficiency of O2 generation, fO2, using a WO3 photoanode in HClO4 was determined to be approximately unity using the method outlined in Section 2.2.2, and described in more detail in Section S2 in the ESI.† Since fO2 = 1.0, this shows that reaction (1) is the photoelectrochemical reaction that occurs at the WO3 photoanode, in 1 M HClO4, when biased at ca. 1 V vs. Ag/AgCl.The mechanism for reaction (1) was then probed using photoinduced absorbance spectroscopy (PIAS) coupled with transient photocurrent (TC) measurements. In this work, the absorbance change, ΔAbs upon UV (365 nm) irradiation of the WO3 photoanode, poised at 1.3 V vs. Ag/AgCl in the water oxidation electrolyte (HClO4), was monitored at 500 nm as a function of UV irradiance, ρ, as part of the PIAS study of the WO3 photoanodes.
Note, in this work 500 nm was chosen as the monitoring light wavelength, λmon, since the transient absorbance change due to the photogeneration of long-lived, surface holes, hs+, on the WO3 photoanode between 500–900 nm was found to be largest at 500 nm, see ESI,† Section S6. This observation is consistent with many, previously reported, transient absorption and diffuse reflectance studies of photogenerated holes and electrons on WO3.10,25,26 It is generally assumed that these holes are trapped surface holes or oxidising equivalents, hs+.10,26 It is, of course, possible that in such work other trapped oxidising equivalent species (or surface holes) are photogenerated that are involved in the oxidation of water but do not contribute to the transient absorbance. Thus, it is assumed that ΔAbs provides a measure of the concentration of all such surface holes, [hs+].
As observed in most PIAS studies of semiconductor oxide photoelectrodes, other work carried out using this system showed that ΔAbs increased with increasing polarising voltage from 0.4 to 1.8 V vs. Ag/AgCl, as expected if the transient absorbance was associated with photogenerated holes, and not electrons, since the greater the applied anodic bias the greater the efficiency of extracting the photo-excited electrons. In sharp contrast, work by others show that photo-excited electrons on a WO3 photoelectrode biased at much lower potentials exhibit a ΔAbs value that increases with increasing monitoring wavelength, with a maximum ca. 900, not 500 nm.25,26 Finally, note that, unless stated otherwise, all subsequent reference to holes refers to those trapped at the surface, hs+, rather than those generated in the bulk, hb+, of the semiconductor, which, as noted by others, do not make a significant contribution to the transient absorbance, ‘due to their small lifetime in the bulk and the electric field drawing them to the interface with the electrolyte’.27
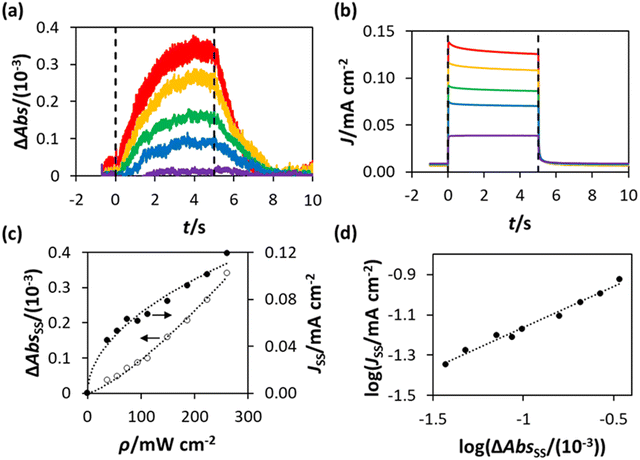
For each and every ΔAbs vs. time (t) plot recorded using PIAS, the corresponding photocurrent, J, vs. t plot was measured. Thus, in this work a series of ΔAbs vs. t and J vs. t plots were measured using the WO3 photoanode in HClO4 at different values of ρ, and the results of this work are illustrated in Fig. 5(a) and (b), respectively. Upon inspection of these figures, it is clear that the photocurrent J reaches a steady state rapidly, in less than 1 s, upon irradiation, whereas the ΔAbs response takes approximately 3 s to attain to a steady state value. Similarly, the decay in J upon the ceasing of irradiation is more rapid than the decay in ΔAbs. This is a noted, common feature of PIAS/TC studies, including those previously performed on TiO2, hematite and BiVO4 photoanodes,13–15,28 and occurs because the electron transport to the external circuit is more rapid than the flux of photogenerated holes to the photoanode surface.14,28
The steady state values of the photoinduced absorbance and photocurrent were determined using the data in Fig. 5(a) and (b), i.e., ΔAbsss and Jss, respectively, by taking the average of the photoinduced absorbance ΔAbs and photocurrent J over the illumination period between t = 2.5 s and t = 4.5 s. The subsequent plots of ΔAbsss and Jss, as a function of ρ are illustrated in Fig. 5(c), with lines of best fit showing that ΔAbsss ∝ ρ1.3 and Jss ∝ ρ0.5. It follows from the latter two expressions that Jss ∝ ΔAbsss0.5/1.3, or ∝ΔAbsss0.38, which is consistent with the log(Jss) vs. log(ΔAbsss) plot in Fig. 5(d), where Jss ∝ ΔAbsss0.4.
As noted earlier, since ΔAbs is assumed to be due to the photogenerated surface holes, it follows that ΔAbsss provides a direct measure of the steady state concentration of holes, [hs+]ss (by Beer's law). In this PIAS study the measured value of Jss is proportional to the rate of reaction (1), R, since the fO2 measurements have demonstrated that all the current is due to O2 generation. Therefore, the rate equation for reaction (1) can be written as follows,
| R = k[hs+]nss | (4) |
| Jss = k′ΔAbsnss | (5) |
Many different mechanisms have been proposed for the electrochemical oxidation of water on various anodes, one of which is the oxide path mechanism.29 The latter reaction mechanism is usually given in terms of electron loss, but can be represented in terms of surface hole (hs+) gain, by the following reaction steps:
 | (6) |
 | (7) |
 | (8) |
 and
and  , then the rate of S–OH generation,
  , will be equal to the rate of S–OH consumption,
  2,
2, | (9) |
 for
for  gives the following expression
 | (10) |
 | (11) |
 | (12) |
 (and
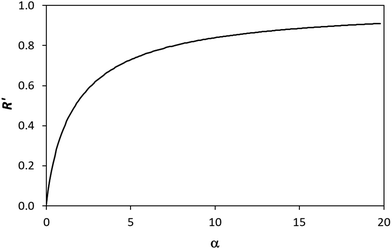
(and  ) with α (which is proportional to [hs+]ss and so ΔAbsss), and the resulting plot is shown in Fig. 6.
This set of model predicted data is very useful as it provides a value of  for every value of α, which allows the calculation of a unitless form of rate of water oxidation, R′, equal to R/k7, where, from eqn (10),
 | (13) |
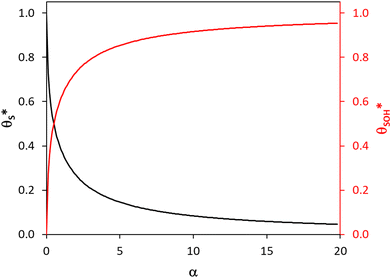 | ||
Fig. 6 The variation in  and and  with α (in black and red respectively), as predicted by eqn (12), and the assumption that with α (in black and red respectively), as predicted by eqn (12), and the assumption that  . . | ||
As R′ is proportional to the actual rate, and therefore the steady state photocurrent, Jss, i.e., J = c1R′, and α is proportional to [hs+]ss, which in turn is proportional to ΔAbsss, or ΔAbsss = c2α, it follows that through a judicious choice of values for the constants, c1 and c2 (0.143 and 0.0588 respectively) it should be possible to fit the observed variation in Jssvs. ΔAbsss, to the kinetic model predicted variation in R′ vs. α. The results of such a plot are illustrated in Fig. 8, and the excellent fit provides considerable support for the above kinetic model.
We have seen that a plot of log(Jss) vs. log(ΔAbsss) yields a straight line of gradient 0.4, implying the order of reaction, n, is 0.4. However, a brief inspection of the Jssvs. ΔAbsss curve illustrated in Fig. 8, or its more expanded, model-generated R′ vs. α equivalent, illustrated in Fig. 7, show that the kinetic model predicts that at low ΔAbsss values (due to a low value of ρ), Jss will be proportional to ΔAbsss, i.e., the reaction order with respect to ΔAbsss, n, is unity, whereas at very high ΔAbsss values (due to high ρ) Jss tends to an independence of ΔAbsss, so that n = 0. Thus, in this work, the observation that n = 0.4 in the photoelectrochemical oxidation of water to O2 by the WO3 photoanode poised at 1.3 V vs. Ag/AgCl, see Fig. 5(d), is a kinetic artifact produced because the UV irradiance range used in this work lies in between these two extremes. Support for this suggestion is provided by a log–log plot of the model predicted Jssvs. ΔAbsss data, represented by the broken red line in Fig. 8, over the ΔAbsss range of 0.05–0.35 that is relevant to this study, which yields a good straight line with a gradient of ca. 0.4.
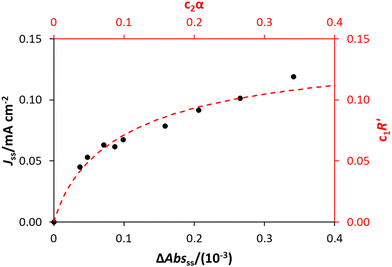 | ||
| Fig. 8 The experimental values of Jss and ΔAbsss are shown (in black, corresponding to the black axes), alongside the model predicted variation in R′ and α according to eqn (12) and (13), multiplied by constants c1 and c2 (0.143 and 0.0588 respectively, shown in red). | ||
The above kinetic model also provides an insight into the dependence of the Jss on the UV irradiance, ρ. In semiconductor photochemistry, the steady state concentration of the holes in the bulk, [hb+]ss, is usually found to depend directly upon ρϕ, where ϕ lies in the range 0.5 (at high ρ)–1.0 (low ρ). It appears reasonable to assume that the rate of generation of the surface (trapped) holes, hs+, rg, is proportional to [hb+]ss, and so ∝ρϕ. If the latter is the rate determining step, rds, and reactions (6) and (7) are fast, it follows that r6 = r7 = rg, which provides a rationale for the model assumption as to why r6 = r7. In addition, given, r6 = r7 = R (see eqn (13)), it follows,
| R = rg = k*ρϕ | (14) |
By incorporating eqn (14), and the relationship R ∝ ρϕ, into the kinetic model, it is possible to show why ΔAbsss, and so [hs+]ss, is ∝ρ1.3, as illustrated in Fig. 5(c). Thus, assuming ϕ = 0.5, the combination of eqn (13) and (14) yields the following expression relating the UV irradiance, ρ, to the product of α (which is proportional to ΔAbsss) and  ,
,
 | (15) |
 , Fig. 9, generated using the model-calculated values of α and
  (illustrated in Fig. 6).
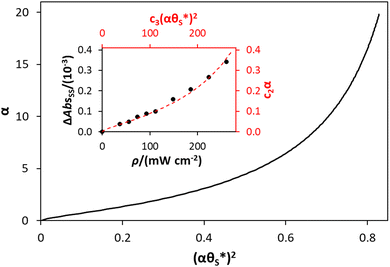 | ||
Fig. 9 Plot of α vs.  (model equivalent to ΔAbsssvs. ρ) using the model-calculated values of α and (model equivalent to ΔAbsssvs. ρ) using the model-calculated values of α and  shown in Fig. 6. The insert diagram is the plot of ΔAbsssvs. ρ data points shown in Fig. 5(c), along with a plot of the appropriate model data in the main diagram in the form of c2α vs. shown in Fig. 6. The insert diagram is the plot of ΔAbsssvs. ρ data points shown in Fig. 5(c), along with a plot of the appropriate model data in the main diagram in the form of c2α vs.  , where c2 and c3 are equal to 0.0588 and 445, respectively. , where c2 and c3 are equal to 0.0588 and 445, respectively. | ||
The results of such a plot are illustrated in Fig. 9 (main diagram) and show that the kinetic model predicted variation of α vs.  , has a similar, non-linear shape to that of the plot of ΔAbsssvs. ρ illustrated in Fig. 5(c). To test this similarity further, the model-generated results illustrated in Fig. 9 were then fitted to the ΔAbsssvs. ρ data points in Fig. 5(c), as illustrated in the insert diagram in Fig. 9, using values for the proportionality constants, c2 and c3 of 0.0588 and 445, respectively. The excellent fit of the kinetic model predicted variation in ΔAbsssvs. ρ (broken red line) to the measured ΔAbsssvs. ρ data points, as illustrated in the insert plot in Fig. 9 provides further support for the proposed kinetic model. A log–log plot of the kinetic model predicted ΔAbsssvs. ρ data used to generate the broken red line in the latter plot yields a straight line with a gradient of 1.3, in agreement with the finding that ΔAbsss ∝ ρ1.3, as noted earlier for the data points in Fig. 5(c).
Alternatively, assuming reaction (7) is the rds, the unreacted sites S would be depleted as ρ is increased, since  and hence the surface hole population will increase to maintain r6 = r7. Thus, as ρ is increased, the concentration of holes accumulated increases, thereby pushing up the ΔAbsssvs. ρ curve to be proportional to ρ1.3.
In summary, in the system under study, it appears that [hb+]ss is proportional to ρ0.5, so that the overall rate, Jss (or R) is ∝ρ0.5 and that ΔAbsss (and so [hs+]ss and α) is proportional to ρ1.3. The latter feature is due to the non-linear decrease in the fraction of reaction sites,  , with increasing α (or ΔAbsss), see Fig. 6. Thus, with increasing ρ,
  is eventually reduced to such an extent that an increasing concentration of photogenerated surface holes is required in order to produce the same incremental increase in rate. This increasing accumulation of surface holes with increasing ρ is responsible for the observation that ΔAbsss (and so [hs+]ss) is ∝ρ1.3.
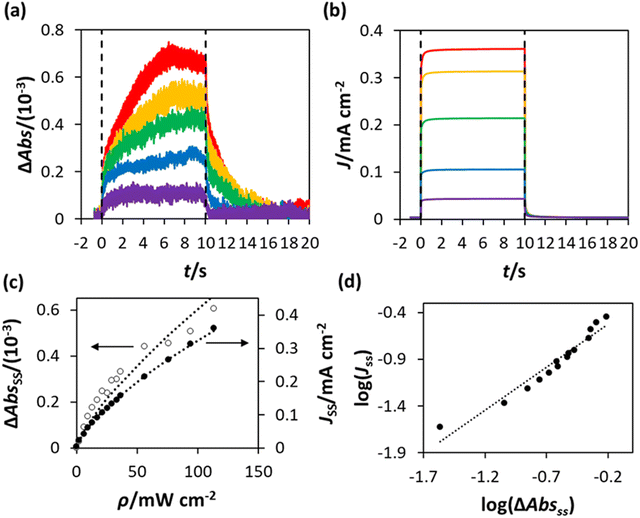
PIAS/TC data was obtained for the WO3 photoanode, poised at 1.3 V (vs. Ag/AgCl), in the chloride oxidation electrolyte (NaCl/HClO4) using the same procedures used when the electrolyte was HClO4. The resulting plots of ΔAbs (λmon = 500 nm) and J vs. t, are shown in Fig. 10(a) and (b) respectively. The plateau, steady-state values of ΔAbs and J upon irradiation (ΔAbsss and Jss) were then calculated as the average values between t = 6 s and t = 9.5 s, and the results plotted as a function of the irradiance used to obtain them, ρ, in Fig. 10(c) with lines of best fit based on ΔAbsss ∝ ρ0.75 and Jss ∝ ρ0.7, so that Jss ∝ ΔAbsss0.9, as also revealed by Fig. 10(d). A plot of the data in Fig. 10(c) in the form of log(Jss) vs. log(ΔAbsss), Fig. 10(d), produced a straight line with a gradient = 0.9, suggesting that the order of reaction, nCl, for the oxidation of chloride by the photogenerated surface holes is ≈1.
As noted above, although fCl2 = 0.62, no O2 evolution was observed, and so the unaccounted 0.38 in faradaic efficiency is most likely due to a chloride oxidation product, such as ClO4−, or even pre-trap Cl2 lost due to its high reactivity. As a consequence, it would seem reasonable to assume that whatever the chloride photoelectrochemical product, the rds is the same. If, as before, we assume that the rate of generation of the surface (trapped) holes, hs+, rg, is proportional to [hb+]ss, and so proportional to ρϕ, and the latter is the rds, then eqn (14) will apply and, since the results in Fig. 10(c) reveal Jss (or R) is proportional to ρ0.7, it follows that in the photo-oxidation of chloride, ϕ = 0.7. The latter value for the photo-oxidation of chloride, compared with 0.5 for water oxidation, appears reasonable given the much lower high UV irradiances employed (<120 mW cm−2). Many proposed mechanisms for chloride oxidation in acidic solution on metal oxide anodes have the same first step, the oxidation of a Cl− ion,31,32
| S + Cl− + hs+ → S–Cl | (16) |
 is ≈1, then, the rate of generation of surface holes, rg, ∝ρ0.7, would be proportional to the rate of their loss, k16[hs+]ss, and since [hs+]ss is proportional to ΔAbsss it follows that ΔAbsss will be proportional to ρ0.7. This prediction appears roughly consistent with the finding that ΔAbsss is proportional to ρ0.75, as illustrated by the data in Fig. 10(c). In addition, a PIAS/TC study of such a system would be expected to yield a set of Jss and ΔAbsss, recorded at different values of ρ, which when plotted in the form of log(Jss) vs. log(ΔAbsss) would produce a straight line with a gradient of unity. The measured variation in log(Jss) vs. log(ΔAbsss), with gradient = 0.9 not 1.0, see Fig. 10(d), appears approximately consistent with this kinetic model prediction, and suggests that whatever the final chloride oxidation product, be it all Cl2 or 62% Cl2 and the rest ClO4−, reaction (16) is likely a common initial step.
4. Conclusion
PIAS/TC was used to identify for a WO3 photoanode the dependency of the rate determining steps of both water and chloride oxidation on photogenerated surface holes, hs+. Water oxidation, in HClO4, proceeds with unity faradaic efficiency, and with a rate proportional to [hs+]ss0.4. This order is best understood as being between the two extremes of first order and zero order, indicating that at lower irradiations, the rate tends towards a first order dependence on [hs+]ss, but at higher irradiances, the photoanode surface becomes saturated with OH and O groups, and the rate tends towards independence of [hs+]ss. The PIAS/TC study of WO3 chloride oxidation, on the other hand, revealed an approximately first order dependence of the rate on [hs+]ss, despite a faradaic efficiency for Cl2 production of 0.62, which possibly suggests a mixture of Cl2 and ClO4− is produced. However, the approximate first order relationship between rate and [hs+]ss observed in the acidic chloride solution indicates that the reaction mechanisms generating both Cl2, and possibly some other chloride oxidation product, have the same initial step, which most likely involves the photoelectrochemical oxidation of an adsorbed Cl− ion. The results of this work provide previously unavailable insights into the mechanism of water and chloride oxidation in acidic solution that occur on a WO3 photoanode which may prove useful in the eventual development of efficient water/saltwater splitting photoelectrochemical systems.Data access
All data is provided in full in the results section of this paper and ESI† accompanying this paper.Author contributions
James Johnston: investigation, visualization, writing (original draft); Christopher O’Rourke: investigation, methodology, visualization; Andrew Mills: conceptualization, supervision, writing (review and editing).Conflicts of interest
There are no conflicts to declare.Acknowledgements
We are grateful for support from the Catalysis Hub funded by EPSRC grant reference EP/R026645/1.References
- C. Jiang, S. J. A. Moniz, A. Wang, T. Zhang and J. Tang, Chem. Soc. Rev., 2017, 46, 4645–4660 RSC.
- C. R. Lhermitte and K. Sivula, ACS Catal., 2019, 9, 2007–2017 CrossRef CAS.
- J. Juodkazytė, M. Petrulevičienė, M. Parvin, B. Šebeka, I. Savickaja, V. Pakštas, A. Naujokaitis, J. Virkutis and A. Gegeckas, J. Electroanal. Chem., 2020, 871, 114277 CrossRef.
- S. Ahmed, I. A. Hassan, H. Roy and F. Marken, J. Phys. Chem. C, 2013, 117, 7005–7012 CrossRef CAS.
- S. S. Kalanur, L. T. Duy and H. Seo, Top. Catal., 2018, 61, 1043–1076 CrossRef CAS.
- J. Desilvestro and M. Grätzel, J. Electroanal. Chem. Interfacial Electrochem., 1987, 238, 129–150 CrossRef CAS.
- Q. Mi, A. Zhanaidarova, B. S. Brunschwig, H. B. Gray and N. S. Lewis, Energy Environ. Sci., 2012, 5, 5694–5700 RSC.
- J. C. Hill and K.-S. Choi, J. Phys. Chem. C, 2012, 116, 7612–7620 CrossRef CAS.
- S. Reinhard, F. Rechberger and M. Niederberger, ChemPlusChem, 2016, 81, 935–940 CrossRef CAS PubMed.
- S. Corby, L. Francàs, S. Selim, M. Sachs, C. Blackman, A. Kafizas and J. R. Durrant, J. Am. Chem. Soc., 2018, 140, 16168–16177 CrossRef CAS PubMed.
- M. S. Koo, X. Chen, K. Cho, T. An and W. Choi, Environ. Sci. Technol., 2019, 53, 9926–9936 CrossRef CAS PubMed.
- M. Jadwiszczak, K. Jakubow-Piotrowska, P. Kedzierzawski, K. Bienkowski and J. Augustynski, Adv. Energy Mater., 2020, 10, 1903213 CrossRef CAS.
- A. Kafizas, Y. Ma, E. Pastor, S. R. Pendlebury, C. Mesa, L. Francàs, F. Le Formal, N. Noor, M. Ling and C. Sotelo-Vazquez, ACS Catal., 2017, 7, 4896–4903 CrossRef CAS.
- F. Le Formal, E. Pastor, S. D. Tilley, C. A. Mesa, S. R. Pendlebury, M. Grätzel and J. R. Durrant, J. Am. Chem. Soc., 2015, 137, 6629–6637 CrossRef CAS PubMed.
- Y. Ma, C. A. Mesa, E. Pastor, A. Kafizas, L. Francàs, F. Le Formal, S. R. Pendlebury and J. R. Durrant, ACS Energy Lett., 2016, 1, 618–623 CrossRef CAS.
- C. A. Mesa, L. Francas, K. R. Yang, P. Garrido-Barros, E. Pastor, Y. Ma, A. Kafizas, T. E. Rosser, M. T. Mayer and E. Reisner, Nat. Chem., 2020, 12, 82–89 CrossRef CAS PubMed.
- C. O’Rourke and A. Mills, Chem. Commun., 2021, 57, 1242–1245 RSC.
- A. Mills and A. Cook, Analyst, 1987, 112, 1289–1291 RSC.
- A. D. Awtrey and R. E. Connick, J. Am. Chem. Soc., 1951, 73, 1842–1843 CrossRef CAS.
- M. Butler, J. Appl. Phys., 1977, 48, 1914–1920 CrossRef CAS.
- K. D. Dahm and D. J. Dahm, in Handbook of Near-Infrared Analysis, ed. E. W. Ciurczak, B. Igne, J. Workman and D. A. Burns, CRC Press, Boca Raton, 4th edn, 2021, ch. 3, p. 33 Search PubMed.
- ICDD, International Centre for Diffraction Data (ICDD), https://www.icdd.com/, (accessed October 2023).
- COD, Crystallography Open Database 1528915, https://qiserver.ugr.es/cod/1528915.html, (accessed October 2023).
- N. Gaikwad, G. Waldner, A. Brüger, A. Belaidi, S. Chaqour and M. Neumann-Spallart, J. Electrochem. Soc., 2005, 152, G411 CrossRef CAS.
- F. M. Pesci, A. J. Cowan, B. D. Alexander, J. R. Durrant and D. R. Klug, J. Phys. Chem. Lett., 2011, 2, 1900–1903 CrossRef CAS.
- S. Corby, E. Pastor, Y. Dong, X. Zheng, L. Francàs, M. Sachs, S. Selim, A. Kafizas, A. A. Bakulin and J. R. Durrant, J. Phys. Chem. Lett., 2019, 10, 5395–5401 CrossRef CAS PubMed.
- L. Francàs, C. A. Mesa, E. Pastor, F. Le Formal and J. R. Durrant, in Advances in Photoelectrochemical Water splitting, ed. S. D. Tilley, S. Lany and R. van de Krol, RSC, Cambridge, 2018, ch. 5, p. 132 Search PubMed.
- C. A. Mesa, A. Kafizas, L. Francàs, S. R. Pendlebury, E. Pastor, Y. Ma, F. Le Formal, M. T. Mayer, M. Grätzel and J. R. Durrant, J. Am. Chem. Soc., 2017, 139, 11537–11543 CrossRef CAS PubMed.
- J. O. M. Bockris, J. Chem. Phys., 1956, 24, 817–827 CrossRef CAS.
- E. C. Walker, Method of electrolytic production of perchloric acid, US. Pat., US1271633A, https://patents.google.com/patent/US1271633A/en, 2023 Search PubMed.
- S. Trasatti, Electrodes of Conductive Metallic Oxides: Part B, Elsevier Science Ltd, 1981 Search PubMed.
- S. Trasatti, Electrochim. Acta, 1987, 32, 369–382 CrossRef CAS.
Footnote |
| † Electronic supplementary information (ESI) available. See DOI: https://doi.org/10.1039/d3cp03167e |
| This journal is © the Owner Societies 2023 |

