 Open Access Article
Creative Commons Attribution 3.0 Unported Licence
High-pressure structural studies and pressure-induced sensitisation of 3,4,5-trinitro-1H-pyrazole†
Nurunnisa
Atceken
 ab,
Jack
Hemingway
 b,
Craig L.
Bull
 bc,
Xiaojiao
Liu
 b,
Adam A. L.
Michalchuk
 d,
Sumit
Konar
 be,
Carole A.
Morrison
 *b and
Colin R.
Pulham
 *b
*b
aDepartment of Materials Science and Engineering, İzmir Institute of Technology, Urla, 35430, İzmir, Turkey
bEaStCHEM School of Chemistry and Centre for Science at Extreme Conditions, The University of Edinburgh, King's Buildings, David Brewster Road, Edinburgh EH9 3FJ, UK. E-mail: c.morrison@ed.ac.uk; c.r.pulham@ed.ac.uk
cISIS Neutron and Muon Facility, STFC Rutherford Appleton Laboratory, Harwell, Oxford, Didcot, Oxfordshire OX11 0QX, UK
dSchool of Chemistry, University of Birmingham, Edgbaston, Birmingham, B15 2TT, UK
eJoseph Banks Laboratories, School of Chemistry, University of Lincoln, Lincoln, UK
First published on 9th November 2023
Abstract
Herein we report the first high-pressure study of the energetic material 3,4,5-trinitro-1H-pyrazole (3,4,5-TNP) using neutron powder diffraction and single-crystal X-ray diffraction. A new high-pressure phase, termed Form II, was first identified through a substantial change in the neutron powder diffraction patterns recorded over the range 4.6–5.3 GPa, and was characterised further by compression of a single crystal to 5.3 GPa in a diamond-anvil cell using X-ray diffraction. 3,4,5-TNP was found to be sensitive to initiation under pressure, as demonstrated by its unexpected and violent decomposition at elevated pressures in successive powder diffraction experiments. Initiation coincided with the sluggish phase transition from Form I to Form II. Using a vibrational up-pumping model, its increased sensitivity under pressure can be explained by pressure-induced mode hardening. These findings have potential implications for the safe handling of 3,4,5-TNP, on the basis that shock- or pressure-loading may lead to significantly increased sensitivity to initiation.
1. Introduction
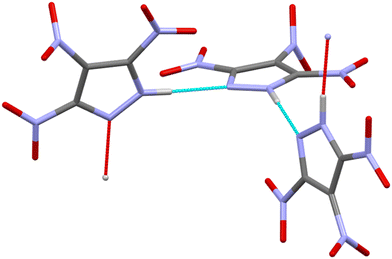
Energetic materials (EMs) are defined as those that release heat and gaseous products upon stimulus by heat, impact, shock, spark, etc.1 The performance of EMs can depend on a number of factors, including sensitivity to initiation by external stimuli, detonation pressure and velocity, chemical reactivity, thermal stability, and crystal density.1,2 This last point highlights that polymorphism and solid-state phase transitions that arise due to changes in temperature and pressure play significant roles in the performance of EM formulations. Research over the last 10–15 years has highlighted that polymorphism within EMs is widespread. For example, five polymorphs of RDX (1,3,5-trinitrohexahydro-1,3,5-triazine) have been identified, including three high-pressure forms.3–8 Three polymorphs of DNAN (2,4-dinitroanisole)9 and five solid forms of HMX (octahydro-1,3,5,7-tetranitro-1,3,5,7-tetrazocine) have been identified.10 In another study, the crystal structure of a high-pressure phase of CL-20 (2,4,6,8,10,12-hexanitro-2,4,6,8,10,12-hexaazaisowurtzitane) has been reported.11 However, it is currently not well understood how changes in crystal structure affect the resulting energetic properties of the bulk EM. Variations in crystal density directly affect calculated heats of formation and the detonation velocities and pressures,1 but these properties are seldom reported for different polymorphs. Mechanical impact sensitivity can also be polymorph-dependent, as recently demonstrated by computational modelling studies of FOX-7 (1,1-diamino-2,2-dinitroethene),12 RDX,13 and by combined experimental and computational studies of CL-20 and HMX.14,15 These studies emphasise the importance of studying the structural evolution of EMs over operational conditions to understand better the structure/property relationships of these technologically important materials.Highly nitrated pyrazoles are both powerful explosives and effective oxidisers for rocket propellants, featuring favorable oxygen balance, crystal density, detonation velocity, and thermal stability.16,17 This current work concerns 3,4,5-trinitro-1H-pyrazole (3,4,5-TNP, see Fig. 1),18,19 which is of particular interest due to its high thermal stability, low hygroscopicity and low sensitivity to external stimuli such as impact, friction and spark, whilst delivering an overall energetic performance that is comparable to those of the more widely used explosives HMX and RDX.19 At ambient conditions, 3,4,5-TNP was initially reported to crystallise in the monoclinic crystal system (space group C2/c, Z′ = 1.5).19 However, Nelyubina et al. subsequently suggested that this structural model was erroneous because of overlooked pseudosymmetry and reassigned the space group to P21/c (Z′ = 3).20
Given the potential technological importance of this EM, this paper investigates the high-pressure response of 3,4,5-TNP using powder neutron diffraction and single-crystal X-ray diffraction as complementary techniques. An equation of state (EoS) is also reported, which describes the compression behaviour of the material. A new high-pressure phase, denoted as Form II, has also been identified and structurally characterised. An additional aim of the study is the prediction of the impact sensitivity of 3,4,5-TNP under both ambient and high-pressure conditions. For molecular crystals, where changes in molecular geometries on application of pressure would be expected to be minor, predictive methods based on molecular properties such as bond dissociation energy or kinetics, electronic charge distribution, NMR chemical shifts, or HOMO–LUMO gaps are not appropriate.21–25 Instead, a model that explicitly includes solid state properties is essential. For this reason we have applied a vibrational up-pumping model, which has demonstrated differentiation with respect to changes in crystal packing.13,26–28 This up-pumping model bridges the gap between molecular and solid-state models by simultaneously describing how mechanical energy enters and moves through a crystal structure, whilst encoding relative bond dissociation energies through the vibrational frequencies. Understanding the high-pressure behavior of 3,4,5-TNP will provide additional confidence in the safe use of this material in practical applications.
2. Experimental and computational methods
2.1 Synthesis of 3,4,5-TNP
Safety warning: 3,4,5-TNP and its precursors are highly energetic and may explode in response to certain external stimuli. The use of highly concentrated mixtures of nitric and sulfuric acids as nitrating mixtures is potentially hazardous. Hence, it is strongly recommended to carry out small-scale reactions and take appropriate precautions such as the use of leather gloves, protective coats, face shields, and explosion-proof baffles to ensure safety.3,4,5-TNP was synthesised from 3-nitro-1H-pyrazole using sequential nitration and subsequent thermal rearrangement steps according to literature procedures.18,19,29–31 The purity of intermediate compounds was verified by 1H and 13C NMR, powder X-ray diffraction, and single-crystal X-ray diffraction. Deuteration of 3,4,5-TNP was achieved by sequential (three times) recrystallisation of a hydrogenous sample from D2O at 50 °C, with >98% deuteration confirmed by FT-IR spectroscopy. The deuterated sample was stored under dry nitrogen at 4 °C until required.
2.2 High-pressure neutron powder diffraction
Experiments were performed on the PEARL instrument at the ISIS Neutron and Muon Source,32 using a V3 variant Paris–Edinburgh press.33 The experiments were performed using two separate sample loadings. For the first compression experiment (up to a pressure of ∼4.4 GPa), a lightly ground polycrystalline sample (∼80 mm3) was loaded between a pair of single-toroidal zirconia-toughened alumina (ZTA) anvils. The sample appeared to be relatively homogeneous with respect to crystallite size, with an average particle size of ca. 10 μm estimated from the width of the Bragg peaks measured at ambient pressure. For the second experiment, the sample was loaded between a pair of tungsten carbide (WC) anvils and data collection accrued to pressures of ∼5.3 GPa. In both loadings, a null-scattering TiZr gasket was used to contain the sample,34 and hydrostatic pressure conditions were achieved by the addition of a 1![[thin space (1/6-em)]](https://www.rsc.org/images/entities/char_2009.gif) :
:![[thin space (1/6-em)]](https://www.rsc.org/images/entities/char_2009.gif) 1 mixture of perdeuterated n-pentane/iso-pentane as the pressure-transmitting medium.35 This medium was chosen because 3,4,5-TNP has negligible solubility in this mixture contrasting with an appreciable solubility in 4
1 mixture of perdeuterated n-pentane/iso-pentane as the pressure-transmitting medium.35 This medium was chosen because 3,4,5-TNP has negligible solubility in this mixture contrasting with an appreciable solubility in 4![[thin space (1/6-em)]](https://www.rsc.org/images/entities/char_2009.gif) :
:![[thin space (1/6-em)]](https://www.rsc.org/images/entities/char_2009.gif) 1 methanol/ethanol, which is the more usual choice of pressure-transmitting medium. A small pellet of lead foil was included in the sample chamber as a pressure marker, with sample pressures then determined from the refined lattice parameters of lead using the known EoS.36 Estimated uncertainties in the measured pressures were ±0.05 GPa for data collected using the ZTA anvils and ±0.2 GPa for data collected using the WC anvils. A beamline-developed correction for the wavelength and scattering-angle dependence of the neutron attenuation by the anvils (ZTA or WC) and gasket materials was applied to the measured patterns. The data were normalised using MANTID,37 and refinements performed using the GSAS-II package.38 Rietveld refinements were performed at each pressure point starting with the data collected at 0.08 GPa, with each of the molecules in the asymmetric unit defined as independent rigid bodies. The data were of sufficient quality to allow refinement of the positions of the 3,4,5-TNP molecules in the unit cell and the torsion angles (τ1–τ9). Principal coefficients of compressibility were determined from extracted lattice parameters using the program PASCal.39
1 methanol/ethanol, which is the more usual choice of pressure-transmitting medium. A small pellet of lead foil was included in the sample chamber as a pressure marker, with sample pressures then determined from the refined lattice parameters of lead using the known EoS.36 Estimated uncertainties in the measured pressures were ±0.05 GPa for data collected using the ZTA anvils and ±0.2 GPa for data collected using the WC anvils. A beamline-developed correction for the wavelength and scattering-angle dependence of the neutron attenuation by the anvils (ZTA or WC) and gasket materials was applied to the measured patterns. The data were normalised using MANTID,37 and refinements performed using the GSAS-II package.38 Rietveld refinements were performed at each pressure point starting with the data collected at 0.08 GPa, with each of the molecules in the asymmetric unit defined as independent rigid bodies. The data were of sufficient quality to allow refinement of the positions of the 3,4,5-TNP molecules in the unit cell and the torsion angles (τ1–τ9). Principal coefficients of compressibility were determined from extracted lattice parameters using the program PASCal.39
2.3 High-pressure single crystal X-ray diffraction
High-pressure single crystal X-ray diffraction measurements were performed on a Bruker D8 Venture X-ray diffractometer equipped with a CCD detector. A crystal of suitable quality for X-ray diffraction was loaded into a Merrill–Bassett diamond anvil cell equipped with 600 μm culets. A stainless-steel gasket with an initial thickness of 250 μm was pre-indented to a thickness of ca. 120 μm and the diameter of the gasket hole was initially 300 μm. The pressure-transmitting medium was n-pentane/iso-pentane (1![[thin space (1/6-em)]](https://www.rsc.org/images/entities/char_2009.gif) :
:![[thin space (1/6-em)]](https://www.rsc.org/images/entities/char_2009.gif) 1). The pressure within the sample chamber was determined by the ruby fluorescence method.40 Estimated uncertainties in the measured pressures were ±0.1 GPa. Data were collected using Mo-Kα radiation at ambient temperature (ca. 297 K). The Bruker APEX III software package was used for data reduction and corrections for the Lorentz polarisation and the absorption, with Olex2 software used for structure determination.41 The structure was solved with the ShelXT program using intrinsic phasing methods. The refinement was performed with the ShelXL program using least-squares minimisation.42
1). The pressure within the sample chamber was determined by the ruby fluorescence method.40 Estimated uncertainties in the measured pressures were ±0.1 GPa. Data were collected using Mo-Kα radiation at ambient temperature (ca. 297 K). The Bruker APEX III software package was used for data reduction and corrections for the Lorentz polarisation and the absorption, with Olex2 software used for structure determination.41 The structure was solved with the ShelXT program using intrinsic phasing methods. The refinement was performed with the ShelXL program using least-squares minimisation.42
2.4 Geometry optimisation and impact sensitivity prediction
Full geometry optimisation calculations were undertaken for the ambient-pressure structure and for the new high-pressure phase at 5.3 GPa using CASTEP v.16.1143 in the primitive unit cell settings in both cases. The GGA functional PBE combined with the TS dispersion correction scheme was used throughout,44 alongside norm-conserving pseudopotentials and a plane-wave basis set with a kinetic-energy cut-off of at least 950 eV. The electronic structure in the Brillouin zone representation was sampled on a Monkhorst Pack grid mesh of 0.05 Å−1. Structures were considered converged when the following criteria were met: residual atomic forces < 0.005 eV Å−1, atomic displacements < 0.003 Å, wavefunction self-consistency < 2 × 10⁻⁶ eV, and lattice vector stresses < 0.005 GPa. Following optimisation gamma-point phonon calculations were performed for both structures using the DFPT method45 to obtain the phonon density of states (g(ω)), which were plotted using a Gaussian smearing width of 5 cm−1. LO-TO splitting was not applied. The g(ω) plots were then used as input data for vibrational up-pumping to predict respective relative impact sensitivities. Full details of this procedure have been reported elsewhere,13,26–29 while further details on its application to 3,4,5-TNP can be found in the ESI.† Eigenvectors were assigned visually using Jmol.463. Results and discussion
3.1 Neutron powder diffraction experiments
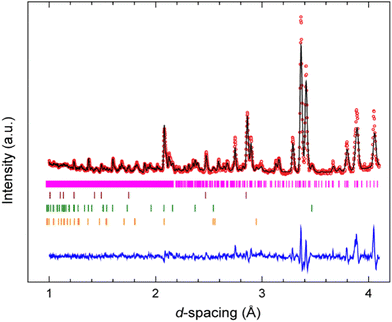
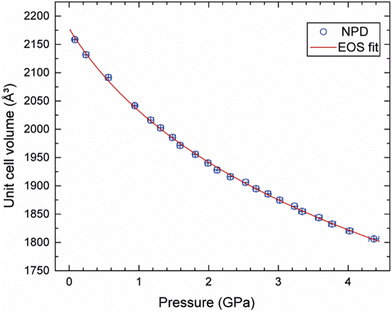
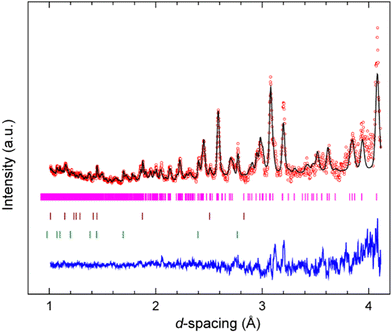
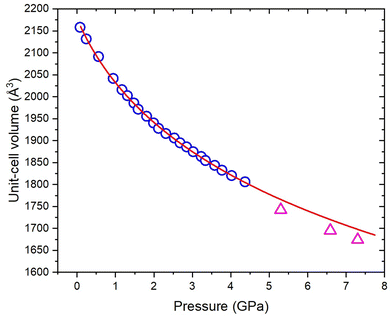
A Rietveld refinement was performed for the neutron powder diffraction pattern collected immediately after loading at 0.08(3) GPa (see Fig. 2). This confirmed that the sample was both phase-pure and fully deuterated. Additional peaks corresponding to Pb (the pressure calibrant), alumina, and zirconia (the anvil materials) were also fitted in the refinement.Fig. S1 in the ESI† shows the sequence of powder diffraction patterns recorded over the pressure range 0.08(3)–4.37(7) GPa, with a data collection time of 2 hours for each pressure point. Unfortunately, data collection at 4.37 GPa ended abruptly when the sample violently decomposed after sitting for ca. 1 hour at this pressure, resulting in rupture of the gasket and cracking of the anvils (see Fig. S2 in the ESI†). Superficially, no significant changes were observed in the diffraction patterns over this pressure range, other than the expected shifting of Bragg peaks to lower d-spacings. Rietveld refinements of each of the patterns based on the monoclinic structure (P21/c) observed at ambient pressure allowed lattice parameters to be determined at each pressure point (see Fig. S3 in ESI† for full Rietveld refinement details at each pressure point). No discontinuities were observed in the unit-cell volume over the pressure range 0.08–4.37 GPa. The unit-cell volumes were fitted to a 3rd order Birch–Murnaghan equation-of-state (see Fig. 3) using EoSFit7,47 to give the following parameters: V0 = 2178(5) Å3, B0 = 10.7(7) GPa, and B′ = 8.9(8). This B0 value lies within the typical range found for organic EMs,48 metal–organic frameworks (MOFs),49,50 hybrid perovskites,51,52 and solid noble gases.53,54
To explore the mechanical behaviour of 3,4,5-TNP upon compression in more detail, the three directions (X1–X3) in which the material responds in a purely linear fashion (the principal axes) have been determined relative to the crystallographic axes using the program PASCal.39 The corresponding data are presented in Table 1 and the compressibility indicatrix is shown in Fig. S4 in the ESI.† The compressibilities of X1–X3 are relatively isotropic up to ca. 0.8 GPa, but become increasingly anisotropic thereafter (Fig. 4). Here X1, the most compressible axis, coincides entirely with the b-direction. Conversely, X3, which is largely coincident with the c-direction, is the least compressible; this most likely arises due to head-to-tail repulsions between neighbouring –NO2 groups along this crystallographic direction.
| Axes | K (TPa−1) | a | b | c |
|---|---|---|---|---|
| X1 | 15.45(1) | 0 | 1 | 0 |
| X2 | 12.2(2) | 1 | 0 | −0.1 |
| X3 | 5.4(1) | 0.2 | 0 | 1 |
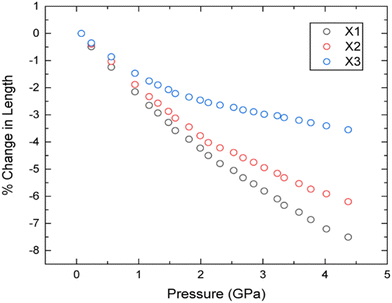 | ||
| Fig. 4 Percentage changes in lengths of principal axes with increasing pressure according to the powder neutron diffraction data. | ||
The small steps used for data collection in the neutron diffraction experiment enabled structural changes to be followed over the pressure range 0.08–4.37 GPa. Within the limits of experimental uncertainty, no significant changes were observed in any of the torsional angles τ(1–9) associated with the NO2 groups (see Fig. S6 in ESI†).
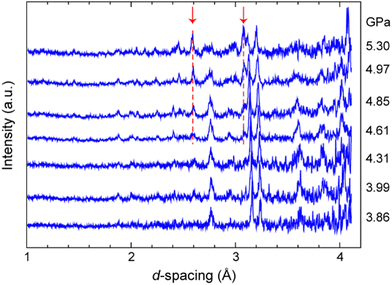
As the abrupt rupture of the Ti–Zr gasket limited the pressure range for data collection, a second set of high-pressure neutron powder diffraction experiments were performed using more robust WC anvils. Fig. 5 shows the resulting diffraction patterns obtained over the pressure range 3.86–5.30 GPa. Despite the substantially larger attenuation caused by the WC anvils in the d-spacing range 3–4 Å, it is immediately apparent that there are substantial changes (highlighted with dashed lines) in the patterns over this wide pressure range. This indicates the potential appearance and co-existence of a new phase (denoted as Form II) associated with a sluggish phase transition (onset pressure in the range 4.3–4.6 GPa) that appears to be complete at ca. 5.3 GPa. For a second time, however, the sample spontaneously and violently decomposed after sitting for several hours at 5.3 GPa, suggesting that Form II might be more sensitive to initiation than Form I. Unfortunately, the quality of the data obtained, combined with the restricted d-spacing range, precluded the successful indexing of these patterns. For these reasons, we then turned our attention to high-pressure single crystal X-ray measurements.
3.2 High-pressure single crystal X-ray diffraction studies
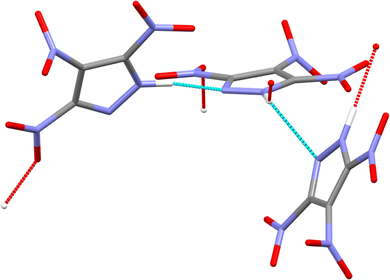
Experiments were conducted to explore further the pressure-induced structural changes observed for 3,4,5-TNP. A single non-deuterated crystal of 3,4,5-TNP was compressed over the range 0.2–7.3 GPa in a standard Merrill–Bassett diamond anvil cell. Table S2 in the ESI† lists the unit-cell parameters obtained from these measurements. At pressures up to and including 3.81 GPa, all of the data sets could be indexed and refined to the ambient-pressure structure. However, the diffraction pattern collected at 5.30 GPa was indexed to give a new monoclinic unit cell with space group Cc. The structure was solved and subsequently refined to give an R-factor of 3.99%. It was not possible to refine the positions of the hydrogen atoms for each of the three independent molecules in the asymmetric unit, and so these were placed in calculated positions. Using this structure, a Rietveld refinement was then performed for the neutron powder diffraction pattern previously recorded at 5.30 GPa, by defining each of the independent molecules in the asymmetric unit as rigid bodies. Fig. 6 shows a very good fit (wRp = 0.041 and χ2 = 1.02), thereby confirming that the same phase was produced at 5.30 GPa in both the X-ray and neutron diffraction experiments. Single crystal X-ray diffraction data were also recorded at 6.59 GPa and 7.30 GPa, but showed no further phase changes. On decompression of the sample to ambient pressure, Form II reverted to Form I, thereby demonstrating the reversibility of the pressure-induced phase transition. Fig. 7 shows the variation of unit-cell volume as a function of pressure for both Forms I and II across the complete pressure range of this study. The plot highlights the abrupt decrease in volume over the phase transition indicating that this is a first-order transition.Fig. 8 shows the arrangement of 3,4,5-TNP molecules in Form II. A comparison of the NO2 torsional angles across both phases is provided in Fig. S6 of the ESI,† which shows that the variation is typically less than 10–20° across this pressure range. A more extensive hydrogen-bonding network is observed for Form II compared to Form I, in which the N–H bonds of each of the molecules form bifurcated interactions. The crystal density of Form II at 5.3 GPa is 23.7% higher than for Form I measured at ambient pressure. X-Ray crystallographic data obtained for both phases are summarised in Table 2. Table S3 of the ESI† shows a comparison of calculated Hirshfeld charge distributions for the two forms. The almost identical values indicate that the molecular properties (e.g. electrostatic potentials and bond dissociation energies) should remain largely conserved between the two forms. Thus, it is likely that the different sensitivities of Form I and Form II are not molecular in origin, but rather that pressure-induced changes in the crystal lattice play an important role in accounting for the change in energetic behaviour.
| Form I | Form II | |
|---|---|---|
| Formula | C3HN5O6 | C3HN5O6 |
| Crystal system | Monoclinic | Monoclinic |
| Z, Z′ | 12, 3 | 12, 3 |
| Space group | P21/c | Cc |
| a (Å) | 14.7836(11) | 19.5713(11) |
| b (Å) | 8.0383(8) | 7.6509(8) |
| c (Å) | 16.8670(12) | 14.6982(9) |
| β (°) | 92.078(4) | 127.661(2) |
| Unit-cell volume (Å3) | 2003.1(3) | 1742.3(3) |
| Density (g cm−3) | 2.020 | 2.321 |
| R-Factor | 0.0488 | 0.0399 |
| Temperature (K) | 297 | 297 |
| Pressure (GPa) | 1.11 | 5.30 |
3.4 Predicting impact sensitivities of Forms I and II
3,4,5-TNP is known to be a relatively insensitive secondary explosive and so its initiation and violent decomposition in both neutron diffraction experiments at high pressure was unexpected. It is not clear what the mechanism of initiation is under these extreme conditions. One possibility is that frictional contacts between crystallites might be responsible. Alternatively, there may be localised changes in pressure/shear associated with the application of pressure. These experiments suggest a sluggish phase transition and so these localised pressures may be delayed as phase boundaries progress slowly through the bulk and cause transient, high stresses at interfaces.To understand the origins of this observation, we applied a sensitivity-prediction model based on vibrational up-pumping to compare predicted sensitivities for Forms I and II. Full details of this methodology, which despite its simplicity has successfully been applied to a broad range of EMs, can be found elsewhere.13,26–29 In essence, the model accounts for the ease with which the vibrational modes of the crystal g(ω) can channel the energy from a dynamic, mechanical impact event through the low-energy phonon bath modes (modes that fall below Ωmax, where Ωmax denotes the highest frequency lattice vibration) to reach the molecular vibrations. Following mechanical perturbation, the phonon acoustic modes, and subsequently the bath optical modes, superheat and scatter, creating a new set of phonons that propagate through the quantized vibrational states of the crystal, as defined by the two-phonon density of states, Ω(2). The degree to which Ω(2) projects onto the original g(ω) in the region 1–3Ωmax (the up-pumping window) provides the metric that describes how efficiently the molecular crystal can trap the mechanical energy in the molecular vibrations. Vibrational excitation of the 1–3Ωmax molecular modes induces large amplitude vibrations that distort the molecular structure to the degree that electronic changes occur: band gaps narrow, electrons flow and unstable species emerge over the timescale of a molecular vibration.55
Geometry optimisation of both structures produced good outcomes, with simulated unit-cell parameters reproduced to within 5% of the experimentally determined structures (see Table S4 in ESI†). The simulated g(ω) and Ω(2) plots for Forms I and II are shown in Fig. 9, together with those obtained for the structure of Form I re-optimised at 5.3 GPa; this last calculation was performed to ascertain the effect of the external pressure on the appearance of g(ω), and hence Ω(2), separate to the effects of changing phase. Note that attempts to optimise Form II in the absence of the external pressure resulted in a unit-cell volume expansion of >25%, which is too significant a change to give confidence that the simulation had generated a meaningful and realistic structure.
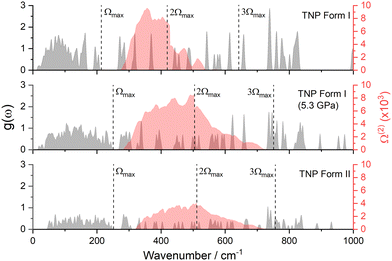 | ||
| Fig. 9 Vibrational g(ω) plots (grey) for Form I at ambient pressure, Form I re-optimised at 5.3 GPa, and Form II at 5.3 GPa, alongside their corresponding Ω(2) envelopes (red). | ||
The first point to note is that the g(ω) plots for Form I and Form II are notably different, with the phonon bath region for the latter extending to higher wavenumbers by 42 cm−1. The number of amalgamated modes (molecular vibrations that fall into the phonon bath, where they mix with the lattice vibrations) is consistent across both phases (see Fig. S7 in the ESI†). Thus the most likely explanation for the increased phonon bath region in Form II is mode hardening, induced by the presence of the external pressure. This is supported by the g(ω) obtained for Form I re-optimised at 5.3 GPa, which shows that Ωmax of compressed Form I closely resembles that of Form II. Mode hardening also affects peaks in the up-pumping window (1–3Ωmax), which typically shift upwards by 10–20 cm−1 in Form II compared to Form I. The overall effect is a broader phonon bath in Form II that creates a broader Ω(2), which in turn is captured by more modes of vibration in the 1–3Ωmax up-pumping window.
Integrating the overlap between g(ω) and Ω(2) provides the metric for the efficiency of vibrational up-pumping, which we take as a measure for IS; this is plotted in Fig. 10, taking an experimental IS value for 3,4,5-TNP of 17 J alongside previously reported values for a well-known set of EMs.13,19 Three points arise from this plot. First, the predicted IS for Form I 3,4,5-TNP fits very well with experiment and correctly sits between the predicted sensitivities of α-RDX and α-FOX-7 using the same computational up-pumping model.13 Second, the model indicates a substantially increased sensitivity for Form II, with its IS predicted to be greater than that of β-HMX. Third, because of mode hardening, the predicted IS for Form I compressed to 5.3 GPa is almost identical to that obtained for Form II.
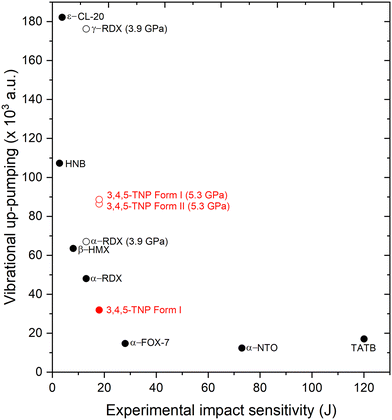 | ||
| Fig. 10 Vibrational up-pumped densities versus experimental IS values for a range of EMs alongside predictions for Forms I and II of 3,4,5-TNP, shown in red. Filled symbols correspond to experimentally measured data points, unfilled to predicted values only. Experimental value selected for TATB is based on an estimate from ref. 56. | ||
Significant variation in predicted IS associated with polymorphism has previously been observed for RDX (see Fig. 10), where the high-pressure γ-form, which can be produced under both static compression and shock conditions, is predicted to be markedly more sensitive to initiation by mechanical impact than the ambient-pressure α-form.13 For RDX the different sensitivities of the polymorphs was further amplified by the presence of a second molecular conformer for the γ-form, which resulted in a more crowded vibrational up-pumping window to both enhance and capture the Ω(2) signal. The same effect does not occur for 3,4,5-TNP, where the g(ω) up-pumping windows for Forms I and II at 5.3 GPa are already broadly similar; this arises because of the similarities in molecular conformations adopted in the two phases (see Table S5 in ESI†).
Although the vibrational up-pumping model is based on an impact/compression excitation, the mechanism for initiation of 3,4,5-TNP in the neutron diffraction experiments is clearly not direct impact and instead is likely to be caused by frictional contacts between crystallites or localised changes in shear, possibly associated with the phase transition. However, impact- and friction-sensitivities of energetic materials are frequently correlated,57 and hence the computational study provides a very plausible explanation for the substantially increased intrinsic sensitivity of 3,4,5-TNP with pressure. In both neutron diffraction experiments it is significant that initiation occurred either just at the onset or during completion of the sluggish phase transition. This can be explained by considering the automated mode of operation of the Paris–Edinburgh press, which maintains a constant load on the sample volume. Hence, for a sample that undergoes a pressure-induced phase transition associated with a decrease in volume, the press will continuously and dynamically adjust the load by moving the piston against the encapsulated gasket. Inevitably, this will lead to movement of the sample within the gasket causing frictional and/or shear contacts between crystallites. It should be noted that there is a significant volume change of ∼2% between Forms I and II, based on calculated unit-cell volumes at 5.3 GPa and more qualitatively from the plot of experimental unit-cell volumes in Fig. 7, and so this would have required significant movement of the piston to maintain the load.
4. Conclusions
Compression of 3,4,5-TNP up to 7.3 GPa has identified a new high-pressure form that has been structurally characterised using neutron powder and single-crystal X-ray diffraction. The ambient-pressure Form I is stable up to 4.4 GPa, with neutron powder diffraction studies identifying a sluggish transition at 4.6–5.3 GPa to give Form II. The crystal structure of this new phase was subsequently solved by single-crystal X-ray diffraction, and shown to be consistent with the neutron powder diffraction pattern recorded at 5.3 GPa. Form II features a more extensive hydrogen-bonding network than observed for Form I, and an increase of ∼24% in crystal density at 5.3 GPa compared to Form I at ambient pressure. On decompression to ambient pressure, Form II reverts to Form I. During the collection of high-pressure neutron diffraction data, initiation and violent decomposition of the sample occurred, coinciding with the sluggish phase transition from Form I to Form II. This apparent increased sensitivity was successfully rationalised using a vibrational up-pumping model, which concluded that mode hardening associated with compression was the main reason for the increase in mechanical sensitivity, with both compressed Form I and Form II exhibiting very similar vibrational up-pumping behaviour. This has potential implications for the safe handling of 3,4,5-TNP, on the basis that shock- or pressure-loading may lead to significantly increased sensitivity to initiation.Author contributions
The experimental work and preparation of the manuscript were through the contributions of all authors. All authors have given approval to the final version of the manuscript.Conflicts of interest
There are no conflicts of interest to declare.Acknowledgements
We thank the Turkish Ministry of National Education for providing financial support for a studentship. All neutron powder diffraction data were collected on the PEARL instrument at the ISIS Neutron and Muon Source, UK (https://doi.org/10.5286/ISIS.E.RB1920623). We thank Nicholas Funnell and Christopher Ridley (ISIS, STFC) for their help in performing the high-pressure neutron experiments on PEARL. This material is also based upon work supported by the Air Force Office of Scientific Research under award number FA8655-20-1-7000. We are grateful for computational support from the United Kingdom Materials and Molecular Modelling Hub, which is partly funded by EPSRC (EP/PO20194 and EP/TO22213), for which access was obtained via the UKCP consortium and funded by EPSRC grant ref EP/PO22561/1.References
- J. Akhavan, The Chemistry of Explosives, Royal Society of Chemistry, Cambridge, UK, 4th edn, 2022 Search PubMed.
- J. P. Agrawal, High Energy Materials: Propellants, Explosives and Pyrotechnics, John Wiley & Sons, 2010 Search PubMed.
- D. I. A. Millar, W. G. Marshall, I. D. H. Oswald and C. R. Pulham, Crystallogr. Rev., 2010, 16, 115–132 CrossRef CAS.
- P. Hakey, W. Ouellette, J. Zubieta and T. Korter, Acta Crystallogr., Sect. E: Struct. Rep. Online, 2008, 64, o1428 CrossRef CAS.
- C. S. Choi and E. Prince, Acta Crystallogr., Sect. B, 1972, 28, 2857–2862 CrossRef CAS.
- J. A. Ciezak, T. A. Jenkins, Z. Liu and R. J. Hemley, J. Phys. Chem. A, 2007, 111, 59–63 CrossRef CAS.
- J. A. Ciezak and T. A. Jenkins, Propellants, Explos., Pyrotech., 2008, 33, 390–395 CrossRef CAS.
- D. I. A. Millar, I. D. H. Oswald, D. J. Francis, W. G. Marshall, C. R. Pulham and A. S. Cumming, Chem. Commun., 2009, 562–564 RSC.
- C. Denekamp, O. Meikler, M. Zelner, K. Suwinska and Y. Eichen, Cryst. Growth Des., 2018, 18, 1350–1357 CrossRef CAS.
- C.-S. Yoo and H. Cynn, J. Chem. Phys., 1999, 111, 10229–10235 CrossRef CAS.
- D. I. A. Millar, H. E. Maynard-Casely, A. K. Kleppe, W. G. Marshall, C. R. Pulham and A. S. Cumming, CrystEngComm, 2010, 12, 2524–2527 RSC.
- A. A. L. Michalchuk, S. Rudić, C. R. Pulham and C. A. Morrison, Chem. Commun., 2021, 57, 11213–11216 RSC.
- I. L. Christopher, C. R. Pulham, A. A. L. Michalchuk and C. A. Morrison, J. Chem. Phys., 2023, 158, 124115 CrossRef CAS.
- X. Bidault and S. Chaudhuri, RSC Adv., 2022, 12, 31282–31292 RSC.
- P. D. Peterson, K. Y. Lee, D. S. Moore, R. J. Scharff and G. R. Avilucea, Shock Compression Condens. Matter., 2007, 955, 987–990 CAS.
- I. Dalinger, S. Shevelev, V. Korolev, D. Khakimov, T. Pivina, A. Pivkina, O. Ordzhonikidze and Y. Frolov, J. Therm. Anal. Calorim., 2011, 105, 509–516 CrossRef CAS.
- A. A. Zaitsev, I. L. Dalinger and S. A. Shevelev, Russ. Chem. Rev., 2009, 78, 589–627 CrossRef CAS.
- I. L. Dalinger, G. P. Popova, I. A. Vatsadze, T. K. Shkineva and S. A. Shevelev, Russ. Chem. Bull., 2009, 58, 2185 CrossRef CAS.
- G. Hervé, C. Roussel and H. Graindorge, Angew. Chem., Int. Ed., 2010, 49, 3177–3181 CrossRef.
- Y. V. Nelyubina, I. L. Dalinger and K. A. Lyssenko, Angew. Chem., Int. Ed., 2011, 50, 2892–2894 CrossRef CAS.
- P. Politzer and J. S. Murray, J. Mol. Model., 2015, 21, 25 CrossRef.
- A. A. Aina, A. J. Misquitta, M. J. S. Phipps and S. L. Price, ACS Omega, 2019, 4, 8614–8625 CrossRef CAS.
- T. L. Jenson, J. F. Moxnes, E. Unneberg and D. J. Christensen, J. Mol. Model., 2020, 26, 65 CrossRef.
- M. J. Cawkwell, J. Davis, N. Lease, F. W. Marrs, A. Burch, S. Ferreira and V. W. Manner, ACS Phys. Chem. Au, 2022, 2, 448–458 CrossRef CAS.
- D. Mathieu, Ind. Eng. Chem. Res., 2017, 56, 8191–8201 CrossRef CAS.
- A. A. L. Michalchuk, J. Hemingway and C. A. Morrison, J. Chem. Phys., 2021, 154, 064105 CrossRef CAS.
- A. A. L. Michalchuk, P. T. Fincham, P. Portius, C. R. Pulham and C. A. Morrison, J. Phys. Chem. C, 2018, 122, 19395–19408 CrossRef CAS.
- A. A. L. Michalchuk, M. Trestman, S. Rudić, P. Portius, P. T. Fincham, C. R. Pulham and C. A. Morrison, J. Mater. Chem. A, 2019, 7, 19539–19553 RSC.
- C. L. Habraken and J. W. A. M. Janssen, J. Org. Chem., 1971, 36, 3081–3084 CrossRef CAS.
- R. D. Schmidt, G. S. Lee, P. F. Pagoria, A. R. Mitchell and R. Gilardi, J. Heterocycl. Chem., 2001, 38, 1227–1230 CrossRef CAS.
- Y. Zhang, Y. Guo, Y.-H. Joo, D. A. Parrish and J. N. Shreeve, Chem. – Eur. J., 2010, 16, 10778–10784 CrossRef CAS.
- C. L. Bull, N. P. Funnell, M. G. Tucker, S. Hull, D. J. Francis and W. G. Marshall, High Pressure Res., 2016, 36, 493–511 CrossRef.
- J. M. Besson, R. J. Nelmes, G. Hamel, J. S. Loveday, G. Weill and S. Hull, Phys. Rev. B: Condens. Matter Mater. Phys., 1992, 180–181, 907–910 CrossRef CAS.
- W. G. Marshall and D. J. Francis, J. Appl. Crystallogr., 2002, 35, 122–125 CrossRef CAS.
- S. Klotz, J. Philippe and E. Cochard, J. Phys. D: Appl. Phys., 2006, 39, 1674–1677 CrossRef CAS.
- T. Strässle, S. Klotz, K. Kunc, V. Pomjakushin and J. S. White, Phys. Rev. B: Condens. Matter Mater. Phys., 2014, 90, 014101 CrossRef.
- O. Arnold, J. C. Bilheux, J. M. Borreguero, A. Buts, S. I. Campbell, L. Chapon, M. Doucet, N. Draper, R. Ferraz Leal, M. A. Gigg, V. E. Lynch, A. Markvardsen, D. J. Mikkelson, R. L. Mikkelson, R. Miller, K. Palmen, P. Parker, G. Passos, T. G. Perring, P. F. Peterson, S. Ren, M. A. Reuterc, A. T. Savici, J. W. Taylor, R. J. Taylor, R. Tolchenov, W. Zhou and J. Zikovsky, Nucl. Instrum. Methods Phys. Res., Sect. A, 2014, 764, 156–166 CrossRef CAS.
- B. H. Toby and R. B. Von Dreele, J. Appl. Crystallogr., 2013, 46, 544–549 CrossRef CAS.
- M. J. Cliffe and A. L. Goodwin, J. Appl. Crystallogr., 2012, 45, 1321–1329 CrossRef CAS.
- G. J. Piermarini, S. Block, J. D. Barnett and R. A. Forman, J. Appl. Phys., 1975, 46, 2774–2780 CrossRef CAS.
- G. M. Sheldrick, Acta Crystallogr., Sect. C: Struct. Chem., 2015, 71, 3–8 Search PubMed.
- O. V. Dolomanov, L. J. Bourhis, R. J. Gildea, J. A. K. Howard and H. Puschmann, J. Appl. Crystallogr., 2009, 42, 339–341 CrossRef CAS.
- S. J. Clark, M. D. Segall, C. J. Pickard, P. J. Hasnip, M. J. Probert, K. Refson and M. C. Payne, Z. Kristallogr. – Cryst. Mater., 2005, 220, 567–570 CrossRef CAS.
- A. Tkatchenko and M. Scheffler, Phys. Rev. Lett., 2009, 102, 073005 CrossRef.
- K. Refson, P. R. Tulip and S. J. Clark, Phys. Rev. B: Condens. Matter Mater. Phys., 2006, 73, 155114 CrossRef.
- Jmol: an open-source Java viewer for chemical structures in 3D, https://www.jmol.org/, accessed June 16, 2023.
- J. Gonzalez-Platas, M. Alvaro, F. Nestola and R. Angel, J. Appl. Crystallogr., 2016, 49, 1377–1382 CrossRef CAS.
- S. Konar, S. Hunter, C. A. Morrison, P. L. Coster, H. E. Maynard-Casely, J. G. Richardson, W. G. Marshall, A. Kleppe, S. F. Parker and C. R. Pulham, J. Phys. Chem. C, 2020, 124, 27985–27995 CrossRef CAS.
- J. Navarro-Sanchez, I. Mullor-Ruíz, C. Popescu, D. Santamaría-Pérez, A. Segura, D. Errandonea, J. González-Platas and C. Martí-Gastaldo, Dalton Trans., 2018, 47, 10654–10659 RSC.
- S. J. Baxter, N. C. Burtch, J. D. Evans, A. D. Ready, A. P. Wilkinson and A. Schneemann, Chem. Mater., 2022, 34(2), 768–776 CrossRef CAS.
- A. Liang, J. Gonzalez-Platas, R. Turnbull, C. Popescu, I. Fernandez-Guillen, R. Abargues, P. P. Boix, L.-T. Shi and D. Errandonea, J. Am. Chem. Soc., 2022, 144, 20099–20108 CrossRef CAS.
- A. Jaffe, Y. Lin, C. M. Beavers, J. Voss, W. L. Mao and H. I. Karunadasa, ACS Cent. Sci., 2016, 2, 201–209 CrossRef CAS.
- D. Errandonea, R. Boehler, S. Japel, M. Mezouar and L. R. Benedetti, Phys. Rev. B: Condens. Matter Mater. Phys., 2006, 73, 092106 CrossRef.
- H. Cynn, C. S. Yoo, B. Baer, V. Iota-Herbei, A. K. McMahan, M. Nicol and S. Carlson, Phys. Rev. Lett., 2001, 86, 4552–4555 CrossRef CAS.
- A. A. L. Michalchuk, S. Rudić, C. R. Pulham and C. A. Morrison, Phys. Chem. Chem. Phys., 2018, 20, 29061–29069 RSC.
- C. B. Storm, J. R. Stine and J. F. Kramer, in Sensitivity Relationships in Energetic Materials, Chemistry and Physics of Energetic Material, ed. S. N. Bulusu, Springer, Dordrecht, 1990, pp. 605–639 Search PubMed.
- T. M. Klapötke, G. Lemarchand, T. Lenz, M. Mühlemann, J. Stierstorfer and R. Weber, Propellants, Explos., Pyrotech., 2022, 47, e202200150 CrossRef.
Footnote |
| † Electronic supplementary information (ESI) available: (1) Additional data from the neutron powder diffraction experiments including Rietveld refinement plots and lattice parameters at each of the pressure points; (2) additional data from the single-crystal X-ray diffraction experiment including lattice parameters at each of the pressure points and the calculated Hirshfeld charge populations for molecules in each of the two forms; and (3) further details of the computational modelling approach including geometry optimisation of the crystal structures and the procedure used to estimate impact sensitivities of the two crystalline forms. CCDC 2129266–2129275. For ESI and crystallographic data in CIF or other electronic format see DOI: https://doi.org/10.1039/d3cp04526a |
| This journal is © the Owner Societies 2023 |

