 Open Access Article
Creative Commons Attribution 3.0 Unported Licence
Co3O4/TiO2 catalysts studied in situ during the preferential oxidation of carbon monoxide: the effect of different TiO2 polymorphs†
Thulani M.
Nyathi
 a,
Mohamed I.
Fadlalla
 a,
Nico
Fischer
 a,
Andrew P. E.
York
 b,
Ezra J.
Olivier
 c,
Emma K.
Gibson
 de,
Peter P.
Wells
 efg and
Michael
Claeys
 *a
*a
aCatalysis Institute and c*change (DSI-NRF Centre of Excellence in Catalysis), Department of Chemical Engineering, University of Cape Town, Rondebosch 7701, South Africa. E-mail: michael.claeys@uct.ac.za
bJohnson Matthey Technology Centre, Sonning Common, Reading RG4 9NH, UK
cCentre for High Resolution Transmission Electron Microscopy, Physics Department, Nelson Mandela University, PO Box 77000, Gqeberha, 6031, South Africa
dSchool of Chemistry, Joseph Black Building, University of Glasgow, Glasgow G12 8QQ, UK
eUK Catalysis Hub, Research Complex at Harwell, Rutherford Appleton Laboratory, Harwell, Oxon, OX11 0FA, UK
fSchool of Chemistry, University of Southampton, University Road, Southampton SO17 1BJ, UK
gDiamond Light Source Ltd., Harwell Science and Innovation Campus, Chilton, Didcot OX11 0DE, UK
First published on 24th February 2023
Abstract
Co3O4 nanoparticles were supported on different TiO2 polymorphs, namely, rutile, anatase, and a 15![[thin space (1/6-em)]](https://www.rsc.org/images/entities/char_2009.gif) :
:![[thin space (1/6-em)]](https://www.rsc.org/images/entities/char_2009.gif) 85 mixture of rutile and anatase (also known as P25), via incipient wetness impregnation. The Co3O4/TiO2 catalysts were evaluated in the preferential oxidation of CO (CO-PrOx) in a H2-rich gas environment and characterised in situ using PXRD and magnetometry. Our results show that supporting Co3O4 on P25 resulted in better catalytic performance, that is, a higher maximum CO conversion to CO2 of 72.7% at 200 °C was achieved than on rutile (60.7%) and anatase (51.5%). However, the degree of reduction (DoR) of Co3O4 to Co0 was highest on P25 (91.9% at 450 °C), with no CoTiO3 detected in the spent catalyst. The DoR of Co3O4 was lowest on anatase (76.4%), with the presence of TixOy-encapsulated CoOx nanoparticles and bulk CoTiO3 (13.8%) also confirmed in the spent catalyst. Relatively low amounts of CoTiO3 (8.9%) were detected in the spent rutile-supported catalyst, while a higher DoR (85.9%) was reached under reaction conditions. The Co0 nanoparticles formed on P25 and rutile existed in the fcc and hcp crystal phases, while only fcc Co0 was detected on anatase. Furthermore, undesired CH4 formation took place over the Co0 present in the P25- and rutile-supported catalysts, while CH4 was not formed over the Co0 on anatase possibly due to encapsulation by TixOy species. For the first time, this study revealed the influence of different TiO2 polymorphs (used as catalyst supports) on the chemical and crystal phase transformations of Co3O4, which in turn affect its activity and selectivity during CO-PrOx.
85 mixture of rutile and anatase (also known as P25), via incipient wetness impregnation. The Co3O4/TiO2 catalysts were evaluated in the preferential oxidation of CO (CO-PrOx) in a H2-rich gas environment and characterised in situ using PXRD and magnetometry. Our results show that supporting Co3O4 on P25 resulted in better catalytic performance, that is, a higher maximum CO conversion to CO2 of 72.7% at 200 °C was achieved than on rutile (60.7%) and anatase (51.5%). However, the degree of reduction (DoR) of Co3O4 to Co0 was highest on P25 (91.9% at 450 °C), with no CoTiO3 detected in the spent catalyst. The DoR of Co3O4 was lowest on anatase (76.4%), with the presence of TixOy-encapsulated CoOx nanoparticles and bulk CoTiO3 (13.8%) also confirmed in the spent catalyst. Relatively low amounts of CoTiO3 (8.9%) were detected in the spent rutile-supported catalyst, while a higher DoR (85.9%) was reached under reaction conditions. The Co0 nanoparticles formed on P25 and rutile existed in the fcc and hcp crystal phases, while only fcc Co0 was detected on anatase. Furthermore, undesired CH4 formation took place over the Co0 present in the P25- and rutile-supported catalysts, while CH4 was not formed over the Co0 on anatase possibly due to encapsulation by TixOy species. For the first time, this study revealed the influence of different TiO2 polymorphs (used as catalyst supports) on the chemical and crystal phase transformations of Co3O4, which in turn affect its activity and selectivity during CO-PrOx.
1. Introduction
Titanium(IV) oxide (or titania, TiO2) is a highly versatile material with applications in the manufacture of paint, paper, and plastic products as a pigmentation agent.1 It is also used by the cosmetics industry as a sun-blocking agent in sunscreen products.2 Owing to its excellent capability to absorb sunlight, TiO2 has found great use as a photocatalyst, for example, to produce carbon-free hydrogen (H2) and oxygen (O2) via water (H2O) electrolysis.3,4 In other catalysed reactions, TiO2 is employed as a support material that anchors active nanoparticles to minimise their growth in size (i.e., sintering) and loss of chemical phase (e.g., via reduction or oxidation).5–9Depending on the catalytic process, strong nanoparticle–support interactions (NPSI) may have a negative impact on the performance of the catalyst as the active phase can be lost through reacting with TiO2 to form Ti-containing mixed metal oxides such as titanates.6,7,9 For example, the formation of cobalt titanates (e.g., CoTiO3) has been observed in the Fischer–Tropsch synthesis (FTS) when operating Co/TiO2 catalysts under high synthesis gas conversion environments because of the high H2O![[thin space (1/6-em)]](https://www.rsc.org/images/entities/char_2009.gif) :
:![[thin space (1/6-em)]](https://www.rsc.org/images/entities/char_2009.gif) H2 partial pressure ratios realised.10–12 In other cases, the surface of TiO2 can be partially reduced to form TixOy species that subsequently migrate and encapsulate the reduced Co particles due to the surface energy of TiO2 (e.g., anatase: 0.44 J m−2) being lower than that of metallic Co (e.g., face-centred cubic (fcc) Co0: 2.6 J m−2).13–15 The encapsulation can also lead to the formation of cobalt titanates.7,10,16
H2 partial pressure ratios realised.10–12 In other cases, the surface of TiO2 can be partially reduced to form TixOy species that subsequently migrate and encapsulate the reduced Co particles due to the surface energy of TiO2 (e.g., anatase: 0.44 J m−2) being lower than that of metallic Co (e.g., face-centred cubic (fcc) Co0: 2.6 J m−2).13–15 The encapsulation can also lead to the formation of cobalt titanates.7,10,16
There are three well reported crystal forms or polymorphs of TiO2, namely, rutile, anatase, and brookite. Rutile is the most stable of all the three polymorphs and can be produced in pure bulk form typically at high temperatures (600–800 °C) from either anatase or brookite.17 Rutile and anatase are the widely utilised forms of TiO2 in the industries/fields mentioned earlier, and the application can either involve the pure form of one of the polymorphs or a mixture of both polymorphs. Owing to their different physical properties (such as surface area and porosity) and differences in the arrangement of atoms in their respective crystal lattices, the behaviours of rutile and anatase may also differ.1,18
For example, anatase is generally considered a better photocatalyst than rutile because of its greater charge transfer capability.19,20 On the other hand, rutile-supported Co catalysts often exhibit a superior catalytic performance than that of their anatase-supported counterparts in the FTS.21,22 The lower activity of anatase-supported Co catalysts may be caused by the encapsulation and/or loss of active Co via cobalt titanate formation, both of which are kinetically and thermodynamically more facile in H2O–H2 environments when anatase is used as the support.10–12 However, some researchers have reported improved catalytic performance when a mixture of rutile and anatase is employed, which has given rise to the wide range of nano-sized rutile–anatase mixtures being applied in various catalytic processes in recent years.4,21
In this study, we have supported cobalt(II,III) oxide (Co3O4) nanoparticles via incipient wetness impregnation on rutile, anatase, and the commercially available mixture of rutile and anatase (at a 15![[thin space (1/6-em)]](https://www.rsc.org/images/entities/char_2009.gif) :
:![[thin space (1/6-em)]](https://www.rsc.org/images/entities/char_2009.gif) 85 ratio) called “P25” (from Evonik Industries). The three supported catalysts were evaluated for activity, selectivity, and phase stability in the preferential oxidation of carbon monoxide (CO-PrOx) in a H2-rich gas environment. CO-PrOx is an essential H2 ‘clean-up’ process that helps remove the trace amounts of CO (0.5–2%) that adsorb and deactivate the Pt-containing anode catalyst of proton-exchange membrane fuel cells (PEMFCs).23,24 Co3O4 is generally regarded as the most active phase of Co in the context of CO oxidation and CO-PrOx, which take place via the Mars–van Krevelen (MvK) mechanism.25,26 Therefore, the loss of this oxide phase through reduction by the abundant H2 (40–75%) decreases the carbon dioxide (CO2) yield and selectivity in CO-PrOx. Moreover, the ultimate formation of Co0 changes the conversion pathway of CO from oxidation to hydrogenation, which produces undesired methane (CH4).27–33
85 ratio) called “P25” (from Evonik Industries). The three supported catalysts were evaluated for activity, selectivity, and phase stability in the preferential oxidation of carbon monoxide (CO-PrOx) in a H2-rich gas environment. CO-PrOx is an essential H2 ‘clean-up’ process that helps remove the trace amounts of CO (0.5–2%) that adsorb and deactivate the Pt-containing anode catalyst of proton-exchange membrane fuel cells (PEMFCs).23,24 Co3O4 is generally regarded as the most active phase of Co in the context of CO oxidation and CO-PrOx, which take place via the Mars–van Krevelen (MvK) mechanism.25,26 Therefore, the loss of this oxide phase through reduction by the abundant H2 (40–75%) decreases the carbon dioxide (CO2) yield and selectivity in CO-PrOx. Moreover, the ultimate formation of Co0 changes the conversion pathway of CO from oxidation to hydrogenation, which produces undesired methane (CH4).27–33
Our previous study reported the effect of different support materials (viz., CeO2, ZrO2, SiC, SiO2, and Al2O3) on the performance and phase stability of Co3O4 nanoparticles during CO-PrOx.32 More specifically, we proposed that weak NPSI (e.g., in Co3O4/ZrO2) allow for high CO2 yields to be achieved via the MvK mechanism, which relies on the high surface reducibility (and re-oxidation) of the nanoparticles. However, the weak NPSI do not help stabilise the Co3O4 phase against surface and bulk reduction as Co0 (and associated CH4) is formed at relatively low temperatures. On the other hand, strong NPSI (e.g., in Co3O4/Al2O3) helped stabilise the cobalt oxide phase and consequently limited CH4 formation. However, we further showed that a less reducible catalyst is less active for CO oxidation because the MvK cycle becomes kinetically hindered.
To the best of our knowledge, there has not been a study reporting the effect of different TiO2 polymorphs on the catalytic performance and phase stability of Co-based catalysts in the CO-PrOx reaction. Therefore, our current work involves the performance evaluation of Co3O4/TiO2 catalysts (where TiO2 = P25, rutile, or anatase) coupled with their in situ characterisation using powder X-ray diffraction (PXRD)34–36 and magnetometry36,37 during CO-PrOx. For the first time, we report a dependence of the catalytic performance of Co3O4 on the polymorph of TiO2 used as the support. Furthermore, our in situ studies showed that certain chemical and crystallographic phase changes of Co3O4 (leading to CoO, CoTiO3, fcc and/or hcp (hexagonal close-packed) Co0) may also be dependent on the type of TiO2 polymorph.
2. Experimental
2.1. Catalyst preparation
In the subsequent sections of the paper, the bare TiO2 supports used are referred to as “P25”, “rutile”, and “anatase”, while the Co3O4-loaded supports are referred to as “Co3O4/P25”, “Co3O4/rutile”, and “Co3O4/anatase”.The supported catalysts for this study were prepared via the incipient wetness impregnation of pre-calcined (300 °C) P25 (99.5% purity, Evonik Industries), rutile (99.5% purity, Merck), and anatase (99.7% purity, Merck) with an aqueous solution containing 1.2 g of Co(NO3)2·6H2O (reagent grade 98% purity, Merck) for every 1 mL of deionised water. The impregnated supports were dried overnight at 60 °C under a flow of nitrogen (N2, 50 mL(NTP) min−1) and annealed for 60 min at 350 °C (heating rate: 2 °C min−1) under the same gas flow at atmospheric pressure38 in a glass tube (I.D.: 15 mm, length: 240 mm; Lasec SA). In the case of rutile, two impregnation steps were conducted to achieve the targeted Co3O4 loading of 10 wt% as this support had a low pore volume of 0.12 cm3 g−1 (Table 1). The calcined material obtained after the first impregnation was used for the second impregnation.
| Sample name | d PXRD (nm) | d STEM,v (nm) | d STEM,n (nm) | MSSAd (m2 g−1) | v pore (cm3 g−1) | Relative fraction of Co3O4a (wt%) | Co3O4 loadinge (wt%) |
|---|---|---|---|---|---|---|---|
| a Average volume-based crystallite size and relative weight fraction (with associated errors) of Co3O4. b Average volume-based particle size and standard deviation. c Average number-based particle size and standard deviation. d Values in parentheses are for the corresponding bare support. e Calculated based on the concentration of Co determined using ICP-OES. | |||||||
| Co3O4/P25 | 11.8 ± 0.3 | 14.2 ± 4.6 | 9.9 ± 3.7 | 37.0 (48.7) | 0.19 (0.21) | 10.3 ± 0.3 | 9.4 |
| Co3O4/rutile | 14.7 ± 0.3 | 15.5 ± 3.8 | 13.0 ± 3.3 | 23.7 (26.6) | 0.08 (0.12) | 10.3 ± 0.5 | 9.8 |
| Co3O4/anatase | 9.8 ± 0.2 | 16.6 ± 3.9 | 13.3 ± 3.9 | 73.5 (97.6) | 0.23 (0.28) | 8.5 ± 0.3 | 9.9 |
The bare support materials as well as the fresh and spent TiO2-supported Co3O4 catalysts were characterised ex situ using PXRD, scanning transmission electron microscopy coupled with electron energy loss spectroscopy (STEM-EELS), N2 physisorption, inductively coupled plasma-optical emission spectroscopy (ICP-OES), and X-ray absorption spectroscopy (XAS). The details pertaining to these ex situ techniques can be found under the section “ex situ catalyst characterisation” in the ESI.†
2.2. In situ catalyst characterisation and evaluation
The magnetometer enables the detection of Co0 (with no distinction between fcc and hcp Co0) as it is the only ferromagnetic Co-based phase39 among those that can be formed in the current study (e.g., Co3O4, CoO, and CoTiO3). However, the magnetometer is highly sensitive as very small amounts of Co0 (ca. 0.23 mg, which is equivalent to 0.1 wt% in this study) can be detected,30 while PXRD requires relative amounts of Co0 (and of the other phases, viz., Co3O4, CoO, and CoTiO3) that are above 2–3 wt% for adequate detection.
The PXRD capillary reactor was loaded with approximately 0.012 g of catalyst each time, and while the magnetometry reactor was loaded with approximately 0.26 g. The reactors were heated from 50 to 450 °C at a rate of 1 °C min−1 while holding the temperature at every 25 °C for 60 min. The reaction feed was flowed at 1.2 mL(NTP) min−1 in the PXRD-based experiments and 25 mL(NTP) min−1 in the magnetometry-based experiments to achieve a gas-hourly space velocity (GHSV) of 60![[thin space (1/6-em)]](https://www.rsc.org/images/entities/char_2009.gif) 000 mL(NTP) gCo3O4−1 h−1, which is based on the Co3O4 loadings determined using ICP-OES (Table 1).
000 mL(NTP) gCo3O4−1 h−1, which is based on the Co3O4 loadings determined using ICP-OES (Table 1).
The reactor effluent gas from the CO-PrOx experiments was sampled on-line every 5 min using a Varian CP-4900 micro-GC (Agilent) fitted with thermal conductivity detectors for detecting CO, O2, H2, CO2, CH4, and N2 in three different columns (see Table S1† for the identity of the columns and full set of parameters applied to achieve gas separation). The chromatographic analysis was operated using the Varian Galaxie Chromatography Data System (version 1.9.3.2). The relevant peak areas in each chromatogram were used to calculate the volumetric flow rates of each eluting gas using eqn (S1) and (S2).† The volumetric flow rates were subsequently used to calculate normalised gas outlet flow rates (eqn (S3)†), conversions/yields (eqn (S4) and (S5)†), and selectivities (eqn (S6)†). The formation of H2O was inferred based on the results obtained using the abovementioned equations because H2O could not be analysed in the micro-GC due to its prior condensation in a cold trapping vessel.
3. Results and discussion
3.1. Ex situ characterisation of fresh catalysts
Various ex situ characterisation techniques (viz., PXRD, STEM-EELS, N2 physisorption, and ICP-OES) were employed to determine the physicochemical properties of the bare supports and fresh supported Co3O4 catalysts. As mentioned earlier, the support material “P25” contains the rutile and anatase polymorphs at a 15![[thin space (1/6-em)]](https://www.rsc.org/images/entities/char_2009.gif) :
:![[thin space (1/6-em)]](https://www.rsc.org/images/entities/char_2009.gif) 85 ratio, which was confirmed using Rietveld refinement in the TOPAS 5.0 software package40 (see results in Fig. S3 and Table S3†). Additionally, this composition is qualitatively shown in the STEM-EELS Ti map of the bare P25 support (Fig. S4†), where the method ELNES (energy loss near edge structure) was used to distinguish the areas with rutile from those with anatase.
85 ratio, which was confirmed using Rietveld refinement in the TOPAS 5.0 software package40 (see results in Fig. S3 and Table S3†). Additionally, this composition is qualitatively shown in the STEM-EELS Ti map of the bare P25 support (Fig. S4†), where the method ELNES (energy loss near edge structure) was used to distinguish the areas with rutile from those with anatase.
The diffraction patterns of the fresh catalysts are shown in Fig. 1 and those of the bare supports can be found in Fig. S5.† Despite the crystalline nature of the three supports used, most of the reflections from the Co3O4 phase are visible in the diffraction patterns shown in Fig. 1(b) and do not overlap with those from the support materials. The presence of CoTiO3 was also considered (either with a cubic or rhombohedral crystal structure) but no reflections from this phase can be observed in the acquired diffraction patterns (Fig. S6†). Based on Rietveld refinement, the average volume-based crystallite sizes of Co3O4 in the P25-, rutile-, and anatase-supported catalysts are 11.8 ± 0.3 nm, 14.7 ± 0.3 nm, and 9.8 ± 0.2 nm, respectively, while the relative weight fractions of Co3O4 in each catalyst are 10.3 ± 0.3 wt%, 10.3 ± 0.5 wt%, and 8.5 ± 0.3 wt%, respectively. It is worth noting that the relative weight fractions of Co3O4 for the P25- and rutile-supported catalysts are close to 10 wt%, which is the targeted loading in this study. The low Co3O4 weight fraction for the anatase-supported catalyst is likely a result of the excessive overlap of the Co3O4 and anatase reflections. This excessive overlap causes the Co3O4 reflections to be less visible, leading to a lower Co3O4 weight fraction being estimated using Rietveld refinement. Other Rietveld refinement results, based on the diffraction patterns in Fig. 1 (e.g., the fitted phases and Rwp values), can be found in Fig. S7 and Table S4.†
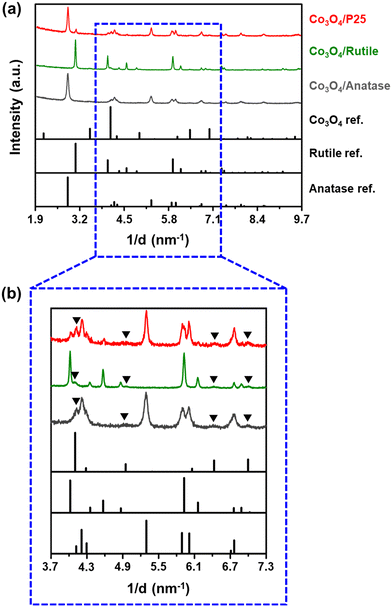 | ||
| Fig. 1 (a) PXRD patterns (radiation source: Co Kα1 = 0.178897 nm) of the fresh supported catalysts and the reference reflection lines of Co3O4, rutile, and anatase as recorded in the ICDD PDF-2 database (see Table S2† for their PDF entry numbers). (b) Magnified short 1/d range of the recorded PXRD patterns for clarity of the Co3O4 reflections. The black triangles indicate the identified Co3O4 reflections in each diffraction pattern. | ||
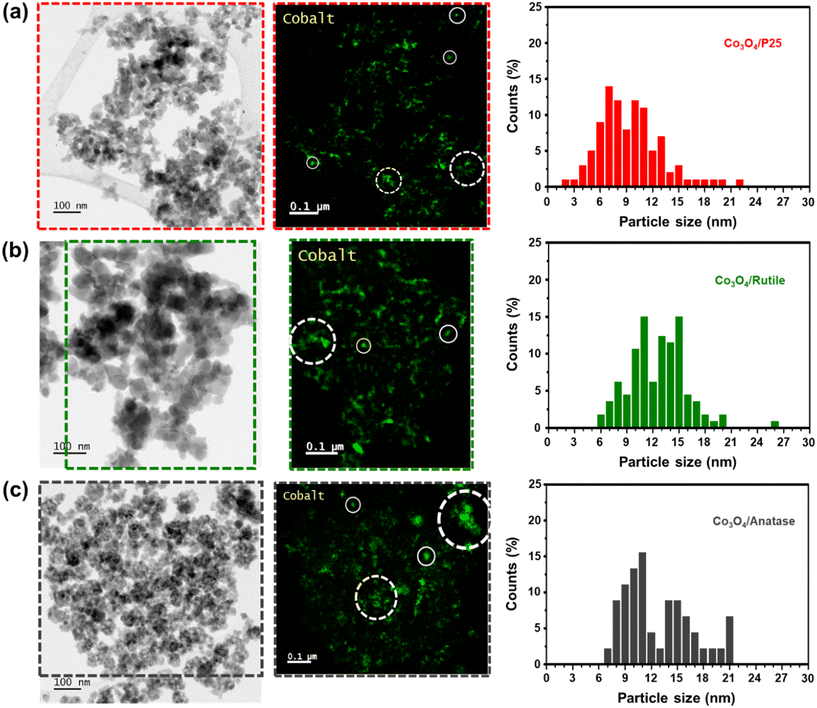
Bright-field STEM micrographs, corresponding Co maps (generated based on the Co L-edge), and derived number-based size distributions for each catalyst are shown in Fig. 2. The Co maps generally show a good distribution of the Co3O4 particles over the various supports, but with some clustered particles also identifiable. For particle size analysis, only the Co-bearing entities that appear as single particles were measured to obtain number-based size distributions as well as average number- and volume-based particle sizes (see eqn (S8)–(S11)† and the results in Table 1). The average Co3O4 particles sizes (on a number and volume basis) vary within a narrow range of approximately 3 nm among the three catalysts prepared, and the STEM-derived volume-based sizes are larger than the PXRD-derived volume-based sizes. This could indicate the presence of smaller Co3O4 crystalline domains (detected using PXRD) that constitute the larger particles identified using STEM-EELS.41
The BET (Brunauer–Emmett–Teller) surface areas and BJH (Barrett–Joyner–Halenda) pore volumes of the bare and Co3O4-loaded supports are shown in Table 1. The surface areas and pore volumes of the supports decrease after supporting Co3O4, which is often observed with supported catalysts prepared using incipient wetness impregnation (as in the current study).32,42 The decrease in the pore volume may indicate the presence of (most of the) Co3O4 particles in the pores of each support. The ICP-OES-derived Co loading (in the form of Co3O4) in each catalyst is close to the targeted 10 wt% loading and in agreement with the Co3O4 relative weight fractions calculated using Rietveld refinement, especially for Co3O4/P25 and Co3O4/rutile (Table 1).
3.2. In situ reduction studies
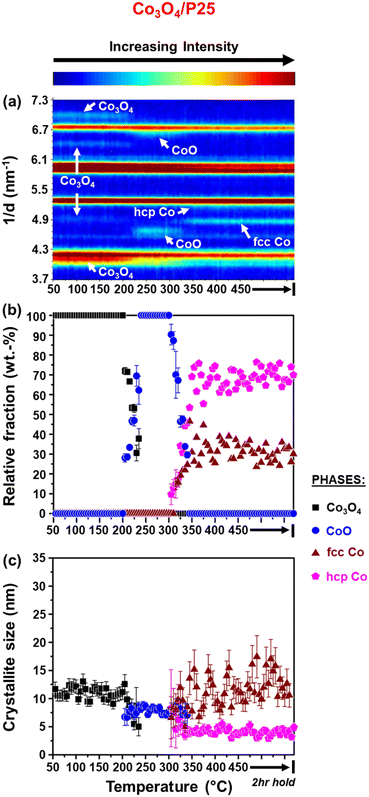
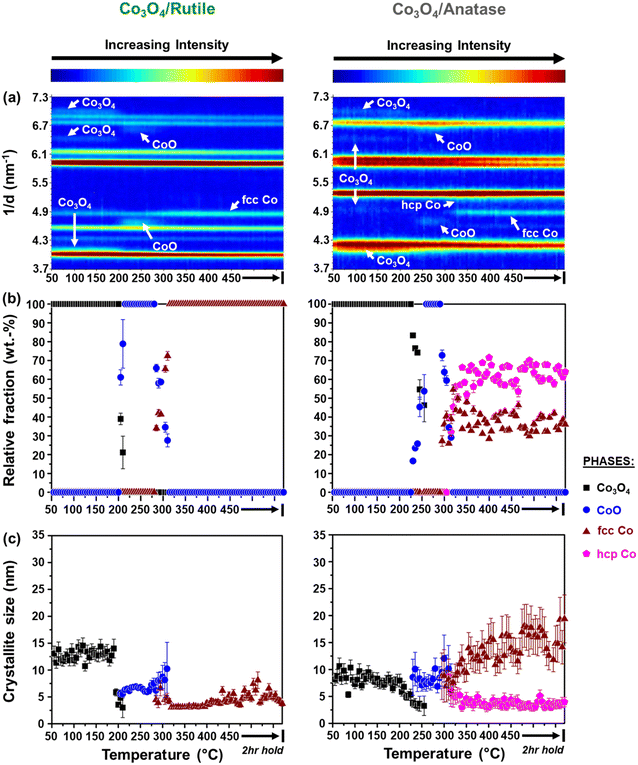
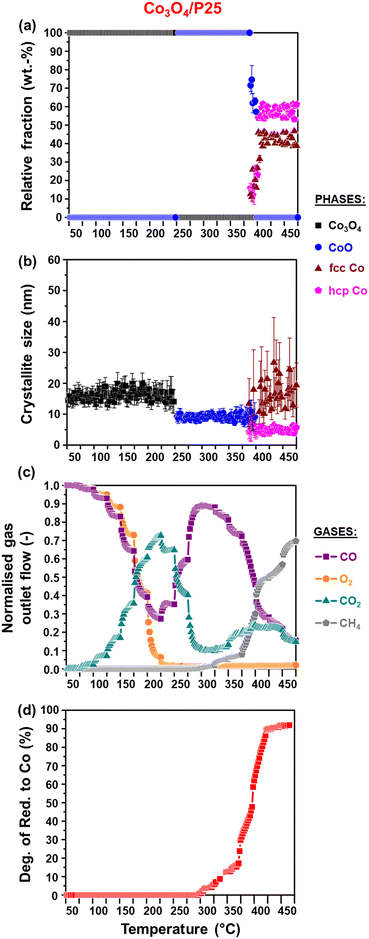
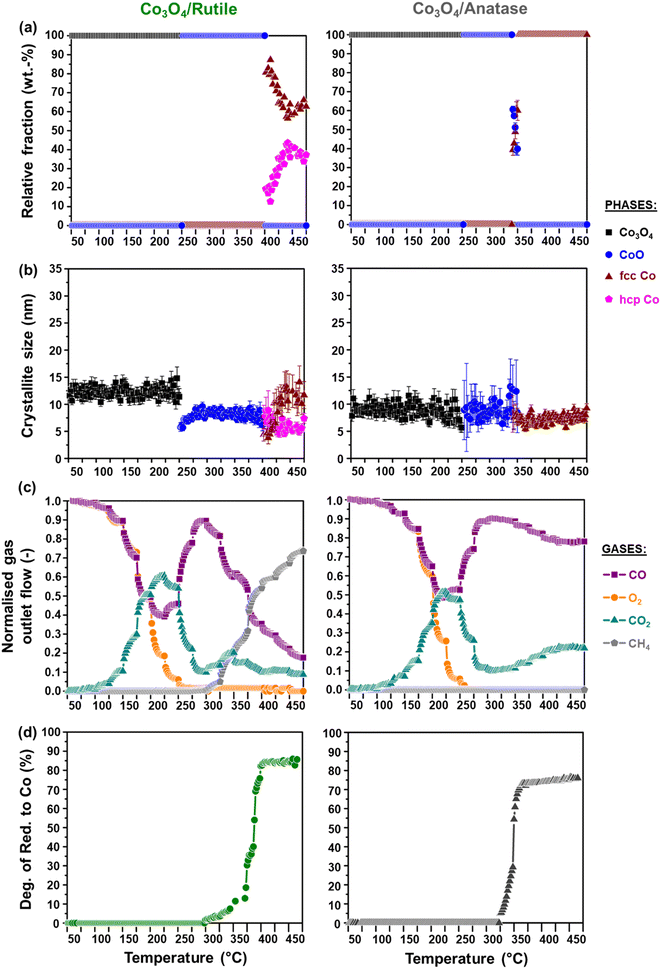
It can be observed that the Co3O4 crystallites supported on P25 and rutile reduce to CoO at 205 °C, while on anatase, this reduction step is first observed at 230 °C. Based on Rietveld refinement, the starting Co3O4 crystallites supported on anatase have a smaller size than those supported on rutile and P25 (Table 1 as well as Fig. 3(c) and 4(c)), which might explain their delayed reduction.43–45 This may be further enhanced by the existence of stronger NPSI between Co3O4 and anatase.7,10,16,21,22 In general, the CoO crystallites formed are either similar (in the case of Co3O4/anatase) or smaller than the starting Co3O4 crystallites (as in the case of Co3O4/P25 and Co3O4/rutile), which indicates minimal or no sintering. The CoO crystallites supported on rutile reduce at 285 °C to fcc Co0 only, while the CoO crystallites on P25 and anatase reduce later at 305 °C to fcc and hcp Co0 (also see Fig. S8† for further evidence of hcp Co0 formation).
The formation of fcc Co0 only or both fcc and hcp Co0 during the reduction of cobalt oxides is common and may be influenced by the starting crystallite size (or size distribution) of cobalt oxide among other things.46 Pure hcp Co0 is thermodynamically stable above 20 nm, while fcc Co0 is stable below 20 nm.47,48 In this study, the metallic crystallites formed on P25 and anatase are generally smaller than 20 nm (Fig. 3(c) and 4(c)), with the size of hcp Co0 (<5 nm) being smaller than that of fcc Co0. It can also be seen that the fcc Co0 crystallites are larger than the starting Co3O4 crystallites, especially on the anatase support. There is a possibility that the metallic crystallites on P25 and anatase are composed of (partially) intergrown domains of fcc and hcp Co0, which may help stabilise the small hcp Co0 crystallites. Although the existence of intergrowth could not be confirmed using Rietveld refinement, this has been reported as a possible phenomenon by other researchers.31,46,49
We note that there is some degree of scatter in the Rietveld refinement data obtained for the co-existing fcc and hcp Co0 crystallites on P25 (Fig. 3(a) and (b)) and anatase (Fig. 4(a) and (b), right). This might be due to the inability to account for the possible (partial) intergrowth of the two Co0 allotropes.31 Furthermore, there is extensive overlap between the PXRD reflections of anatase, rutile (in P25), as well as fcc and hcp Co0, which could also contribute to the scatter in the data. Nonetheless, for the P25- and anatase-supported catalysts, the relative fraction of hcp Co0 is higher than that of fcc Co0, with both catalysts exhibiting similar average hcp![[thin space (1/6-em)]](https://www.rsc.org/images/entities/char_2009.gif) :
:![[thin space (1/6-em)]](https://www.rsc.org/images/entities/char_2009.gif) fcc Co0 ratios at 450 °C (i.e., 2.3 for Co3O4/P25 and 1.8 for Co3O4/anatase).
fcc Co0 ratios at 450 °C (i.e., 2.3 for Co3O4/P25 and 1.8 for Co3O4/anatase).
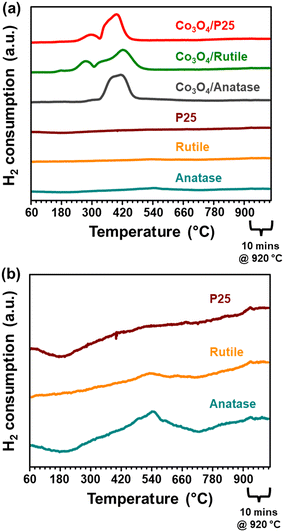
The reduction profile of each catalyst displays multiple peaks between 200 and 660 °C, with some of the peaks appearing as broad and convoluted. Nonetheless, the P25- and rutile-supported catalysts may have undergone a stepwise reduction where Co3O4 first reduces to CoO, and then CoO reduces to Co0.5,8,45,50 The peak maxima at 270 °C for Co3O4/rutile and 280 °C for Co3O4/P25 may be assigned to the formation of CoO. The temperature ranges of 300–540 °C for Co3O4/rutile and 320–450 °C for Co3O4/P25 possibly represent the reduction to Co0. However, the broad and convoluted nature of the reduction peaks in these temperature ranges may also suggest other contributing factors, such as particle size (or size distribution). In other words, different size CoO particles may be reducing at different temperatures, with larger particles reducing earlier.28,43,44 It is also possible that some smaller Co3O4 particles reduce within the abovementioned temperature ranges, and not below 300 °C.
The reduction profile of Co3O4/anatase displays a small peak maximum at 300 °C possibly due to the reduction of a small amount of large Co3O4 particles. Between 330 and 490 °C, Co3O4/anatase also exhibits a broad reduction peak, which may be assigned to the reduction of relatively smaller Co3O4 particles to form metallic Co.21,22 There may be some other CoOx or CoxTiyOz species reducing between 500 and 660 °C (Fig. 5(a) and S9†) due to the existence of strong NPSI in this catalyst. The in situ formation of CoxTiyOz could have been facilitated by the partial surface reduction of anatase, followed by the migration and reaction of TixOy with CoOx species.7,10,16Fig. 5(b) shows a partial reduction of the bare anatase support (possibly occurring in two steps) between 220 and 730 °C as well as 730 and 920 °C, unlike the bare P25 and rutile supports. However, the H2 consumption of the bare anatase is almost negligible when compared with that of the supported Co3O4 catalysts (Fig. 5(a)). The degree of reduction (DoR) to Co0 of each supported Co3O4 catalyst was calculated using eqn (S12)–(S14)† and the results are presented in Table 2. The DoR trend is as follows: Co3O4/P25 (92.5%) > Co3O4/rutile (90.3%) > Co3O4/anatase (85.5%), which suggests a higher proportion of unreduced Co-based oxides on the anatase support, likely due to the existence of strong NPSI.
| Sample name | DoR (%) |
|---|---|
| Co3O4/P25 | 92.5 |
| Co3O4/rutile | 90.3 |
| Co3O4/anatase | 85.3 |
3.3. In situ catalyst characterisation and evaluation
The activity and selectivity of the TiO2-supported catalysts were evaluated under model/dry CO-PrOx conditions, which involved co-feeding 1% CO, 1% O2, 50% H2, and 48% N2 at a GHSV of 60![[thin space (1/6-em)]](https://www.rsc.org/images/entities/char_2009.gif) 000 mL(NTP) gCo3O4−1 h−1. The temperature was varied stepwise between 50 and 450 °C at atmospheric pressure while analysing the reactor effluent gas using on-line gas chromatography. Furthermore, the catalysts were characterised in situ using PXRD and magnetometry to monitor their chemical and crystallographic phase changes. Fig. 6(a) and 7(a) show the calculated relative weight fractions of the Co-based crystalline phases detected using PXRD, and Fig. 6(b) and 7(b) show the crystallite sizes of the detected phases as a function of temperature for all three catalysts. The recorded diffraction patterns are plotted in Fig. S10.†Fig. 6(c) and 7(c) display the normalised gas outlet flow rates of CO, O2, CO2, and CH4; while Fig. 8(a)–(c) display a summary of the CO conversion to CO2 (XCO→CO2), O2 selectivity to CO2 (SO2→CO2), and CO conversion to CH4 (XCO→CH4), respectively. The magnetometry-derived DoR of Co3O4 to Co0 is plotted in Fig. 6(d), 7(d), and 8(d) for all evaluated catalysts. The DoR was calculated using eqn (S15),† which is based on an instrument calibration curve (Fig. S2†). The XCO→CO2 and XCO→CH4 values for the bare TiO2 supports can be found in Fig. S11.†
000 mL(NTP) gCo3O4−1 h−1. The temperature was varied stepwise between 50 and 450 °C at atmospheric pressure while analysing the reactor effluent gas using on-line gas chromatography. Furthermore, the catalysts were characterised in situ using PXRD and magnetometry to monitor their chemical and crystallographic phase changes. Fig. 6(a) and 7(a) show the calculated relative weight fractions of the Co-based crystalline phases detected using PXRD, and Fig. 6(b) and 7(b) show the crystallite sizes of the detected phases as a function of temperature for all three catalysts. The recorded diffraction patterns are plotted in Fig. S10.†Fig. 6(c) and 7(c) display the normalised gas outlet flow rates of CO, O2, CO2, and CH4; while Fig. 8(a)–(c) display a summary of the CO conversion to CO2 (XCO→CO2), O2 selectivity to CO2 (SO2→CO2), and CO conversion to CH4 (XCO→CH4), respectively. The magnetometry-derived DoR of Co3O4 to Co0 is plotted in Fig. 6(d), 7(d), and 8(d) for all evaluated catalysts. The DoR was calculated using eqn (S15),† which is based on an instrument calibration curve (Fig. S2†). The XCO→CO2 and XCO→CH4 values for the bare TiO2 supports can be found in Fig. S11.†
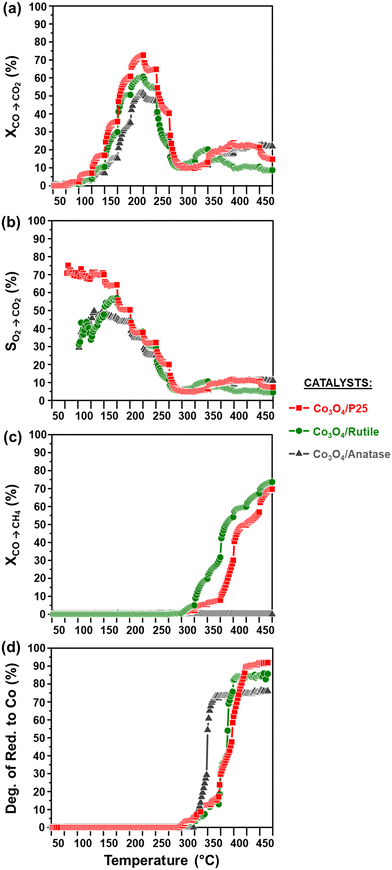 | ||
Fig. 8 (a) CO conversion to CO2 (XCO→CO2), (b) O2 selectivity to CO2 (SO2→CO2), (c) CO conversion to CH4 (XCO→CH4), and (d) magnetometry-derived DoR of Co3O4 to Co0 during CO-PrOx for all prepared catalysts. The SO2→CO2 was calculated at temperatures where both CO and O2 were converted (see Fig. 6(c), 7(c), and 8(a)). (Gas composition: 1% CO, 1% O2, 50% H2, and 48% N2; pressure: atmospheric; GHSV: 60![[thin space (1/6-em)]](https://www.rsc.org/images/entities/char_2009.gif) 000 mL(NTP) gCo3O4−1 h−1). 000 mL(NTP) gCo3O4−1 h−1). | ||
Below 200 °C, the normalised outlet flow rates of CO and O2 decrease while the outlet flow of CO2 increases with increasing temperature, which confirms the oxidation of CO to CO2 over all three catalysts. However, at 200 °C, the outlet flow of CO reaches a minimum (correspondingly, the XCO→CO2 reaches a maximum (Fig. 8(a))), while the outlet flow of O2 continues to decrease until reaching zero at 225 °C for Co3O4/P25 (Fig. 6(c)) and 250 °C for Co3O4/rutile and Co3O4/anatase (Fig. 7(c)). According to eqn (1), half a mole of O2 is required to convert one mole of CO to one mole of CO2. In the current experiments, a 1![[thin space (1/6-em)]](https://www.rsc.org/images/entities/char_2009.gif) :
:![[thin space (1/6-em)]](https://www.rsc.org/images/entities/char_2009.gif) 1 CO
1 CO![[thin space (1/6-em)]](https://www.rsc.org/images/entities/char_2009.gif) :
:![[thin space (1/6-em)]](https://www.rsc.org/images/entities/char_2009.gif) O2 feed ratio was used, implying that the conversion of O2 should ideally be half of the conversion of CO. However, the continued decrease in the outlet flow of O2 suggests the simultaneous occurrence of H2 oxidation (eqn (2)), which is a well-known competing reaction in CO-PrOx.23,24,27–33 This is also confirmed by the SO2→CO2, which is below 100% from 75 °C for all three catalysts and continues to decrease as the reaction temperature is increased (Fig. 8(b)).
O2 feed ratio was used, implying that the conversion of O2 should ideally be half of the conversion of CO. However, the continued decrease in the outlet flow of O2 suggests the simultaneous occurrence of H2 oxidation (eqn (2)), which is a well-known competing reaction in CO-PrOx.23,24,27–33 This is also confirmed by the SO2→CO2, which is below 100% from 75 °C for all three catalysts and continues to decrease as the reaction temperature is increased (Fig. 8(b)).
 | (1) |
 | (2) |
Fig. S11(a)† shows the XCO→CO2 values plotted as a function of temperature for the three bare supports. It can be seen that the bare supports also exhibit some CO oxidation activity, with XCO→CO2 values that are below 10%. However, the Co3O4-loaded supports display much higher XCO→CO2 values than those of the bare supports, which emphasises the importance of the Co3O4 phase. There may be contributions to the CO oxidation activity from each support, but this can be expected to be minor.
Based on the in situ PXRD measurements performed (Fig. 6, 7, and S10†), the Co3O4 phase is stable between 50 and 225 °C in all three catalysts, which explains the overall increase in the XCO→CO2 values within this temperature range. However, it is possible that the slight decrease in the XCO→CO2 observed for all three catalysts from 225 °C (Fig. 6(c), 7(c), and 8(a)) is caused by the reduction of the Co3O4 surface to CoO,27–32 despite this being undetected using bulk-sensitive PXRD. Furthermore, the increase in the amount of O2 converted via H2 oxidation might also explain the decrease in the XCO→CO2 values from 225 °C. With reference to the MvK mechanism, the ultimate depletion of O2 at 225 °C for Co3O4/P25 and 250 °C for Co3O4/rutile and Co3O4/anatase may have led to the onset formation of CoO at these temperatures as there was no O2 available to stabilise (or regenerate) the active Co3O4 phase.25,26
In situ PXRD adequately shows the formation of CoO at 250 °C in all three catalysts, which is later converted to fcc Co0 on anatase (325 °C) and to fcc and hcp Co0 on P25 (375 °C) and rutile (400 °C) (Fig. 6, 7, S10, and S12†). However, Co0 (with no distinction between fcc and hcp Co0) is detected earlier in the magnetometer, that is, at 300 °C for the P25- and rutile-supported catalysts, and at 325 °C for the anatase-supported catalyst (see DoR plots in Fig. 6(d), 7(d), and 8(d)). As stated in section 2.2.2., the magnetometer is more sensitive than PXRD, which explains the earlier detection of Co0 on P25 and rutile during the magnetometry-based experiments.28–32 It can also be observed that within the temperature range where CoO exists in each catalyst, the amount of CO converted to CO2 decreases with increasing temperature, indicating that CoO catalyses H2 oxidation to a greater extent.27–32
Upon forming Co0, CO is converted to CH4, which is an undesired CO conversion pathway because valuable H2 is being consumed (eqn (3)).27–33 However, methanation only takes place over the fcc and hcp Co0 formed on P25 (max. XCO→CH4: 69.7% at 450 °C) and rutile (max. XCO→CH4: 73.7% at 450 °C), and not over the fcc Co0 formed on anatase (Fig. 8(c)). The bare P25 and rutile supports also exhibit XCO→CH4 values that are below 1%, with the anatase support displaying no methanation activity (Fig. 11(b)). At this stage, we propose that the metallic particles on anatase may be encapsulated by TixOy species, thereby blocking active sites on fcc Co0, which has been observed for a reduced Co/anatase catalyst used in the FTS.16 The encapsulation is thought to be driven by the more facile reduction of anatase (also see H2-TPR profile in Fig. 5(b)), followed by the migration of TixOy species to the surface of fcc Co0 due to the significant differences in their surface energies (anatase: 0.44 J m−2, and fcc Co0: 2.6 J m−2).13–15 Evidence for Co encapsulation in this study, based on STEM-EELS analysis, is discussed in section 3.4.2.
 | (3) |
 | (4) |
Sławiński et al.46 and Nyathi et al.31 have shown that the formation of fcc and hcp Co0 (with different ratios) can be influenced by the gas environment. Although this effect was not investigated in-depth, the idea is that different reducing environments may cause the reduction to occur at different temperatures and reduction rates. Consequently, the metallic particles formed can also differ in size, leading to the formation of particles with crystalline domains of either one or both allotropes of Co. Additionally, the strength of the NPSI may influence the reduction of cobalt oxide particles (i.e., Co3O4 and CoO) depending on their size and the type of support used.10,30,32,45 Therefore, the formation of fcc and hcp Co0 on anatase (during the PXRD-based reduction studies only) and rutile (during CO-PrOx only) might have been caused by the different gas environments and the nature of the interactions between these supports and the Co3O4/CoO particles. Moreover, these effects may have also resulted in the higher hcp Co0 content relative to fcc Co0 on P25 (hcp![[thin space (1/6-em)]](https://www.rsc.org/images/entities/char_2009.gif) :
:![[thin space (1/6-em)]](https://www.rsc.org/images/entities/char_2009.gif) fcc ratio: 1.3 at 450 °C), while more fcc Co than hcp Co0 is formed on rutile (hcp
fcc ratio: 1.3 at 450 °C), while more fcc Co than hcp Co0 is formed on rutile (hcp![[thin space (1/6-em)]](https://www.rsc.org/images/entities/char_2009.gif) :
:![[thin space (1/6-em)]](https://www.rsc.org/images/entities/char_2009.gif) fcc ratio: 0.5 at 450 °C) during CO-PrOx (Fig. 6(a) and 7(a)). Similar to the PXRD-based reduction experiments, Rietveld refinement could not be used to confirm fcc–hcp Co0 intergrowth, but the occurrence of this phenomenon cannot be ruled out.31,46,49
fcc ratio: 0.5 at 450 °C) during CO-PrOx (Fig. 6(a) and 7(a)). Similar to the PXRD-based reduction experiments, Rietveld refinement could not be used to confirm fcc–hcp Co0 intergrowth, but the occurrence of this phenomenon cannot be ruled out.31,46,49
The reduction of Co3O4 on all support materials leads to the formation of CoO crystallites of similar sizes (on anatase) or smaller sizes (on P25 and rutile) than the starting Co3O4 crystallites (Fig. 6(b) and 7(b)), indicating minimal or no sintering. On anatase, the fcc Co0 crystallites are also similar in size as the CoO and Co3O4 crystallites, further confirming no significant crystallite growth. However, the fcc Co0 crystallites formed on P25 and rutile are larger than the crystallites of CoO, while hcp Co0 is smaller than CoO. As observed during the magnetometry studies, the P25- and rutile-supported catalysts achieved higher DoRs than the anatase-supported catalyst (Fig. 6(d), 7(d), and 8(d)), which may suggest the existence of weaker NPSIs in the highly reduced catalysts.10,30,32,45 It is also possible that the sintering of fcc Co0 on P25 and rutile is a result of the weak NPSIs.54
3.4. Ex situ characterisation of spent catalysts
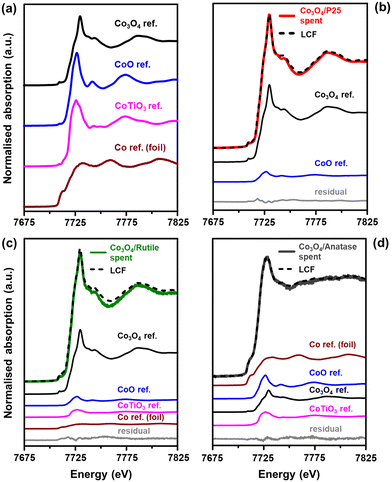
The normalised XANES (X-ray absorption near edge structure) spectra of the reference compounds Co3O4,44 CoO,56 CoTiO3,57 and Co0 (or Co foil)58 are presented in Fig. 9(a). These reference compounds were synthesised according to the procedures outlined in the cited literature. The first derivatives of the XANES spectra for the reference compounds (Fig. S13†) also help to show the differences in their spectral features. Fig. 9(b)–(d) shows the XANES spectra of the spent catalysts together with the linear combination fit (LCF) and the individual fitted components, which have been scaled according to their contribution to the LCF. The phase compositions of the spent samples (based on the LCF) are presented in Table 3 together with the R-factors. It is worth mentioning that the quantities of the Co-based phases reported in Table 3 are on a Co basis because only the Co K-edge was measured. Therefore, the amounts of the different Co-based phases can be expected to be much lower than those presented in Table 3 after factoring in the proportion of the support, which is at least 90 wt% according to ICP-OES analysis.
| Sample name | Co3O4 (%) | CoO (%) | CoTiO3 (%) | Co0 (%) | R-Factor (−) |
|---|---|---|---|---|---|
| Co3O4/P25 spent | 88.9 ± 0.9 | 11.1 ± 0.6 | — | — | 0.003 |
| Co3O4/rutile spent | 73.0 ± 6.1 | 9.8 ± 3.6 | 8.9 ± 4.5 | 8.3 ± 1.2 | 0.010 |
| Co3O4/anatase spent | 21.3 ± 0.7 | 21.8 ± 1.5 | 13.8 ± 1.8 | 43.2 ± 2.5 | 0.002 |
The results of the LCF generally indicate a high concentration of Co3O4 in each spent sample, whereas the in situ PXRD experiments showed the complete disappearance of this phase to CoO and Co0 during CO-PrOx (Fig. 6, 7, and S10†). Therefore, the presence of Co3O4 in the spent samples analysed using XAS is likely due to the re-oxidation of the CoO and Co0 during the long storage times (6–12 months) of the samples in a non-inert environment prior to the XAS measurements. However, since determining the presence of mixed metal oxides using XAS was of primary importance, these oxides would remain stable during sample storage and therefore, should still be detectable.10,57
The Co3O4/P25 spent catalyst underwent extensive re-oxidation as the XANES spectrum mostly exhibits features similar to those of Co3O4 between 7700 and 7825 eV (Fig. 9(b)). The LCF also confirmed the presence of 88.9 ± 0.9% Co3O4 and 11.1 ± 0.6% CoO, with no traces of CoTiO3. The spectrum of the rutile-supported spent catalyst (Fig. 9(c)) is also dominated by features of the Co3O4 phase (73.0 ± 6.1%), but also shows an edge shift of approximately 1.5 eV to the left, relative to the main edge of the Co3O4 reference (which is at 7723 eV). This left shift is indicative of Co species of lower oxidation state, that is, below +3. Indeed, there are also relatively small amounts of CoO (9.8 ± 3.6%), CoTiO3 (8.9 ± 4.5%), and Co0 (8.3 ± 1.2%) in the Co3O4/rutile spent catalyst. In these three phases, Co is either in the +2 or 0 oxidation state.
The XANES spectrum of Co3O4/anatase (Fig. 9(d)) exhibits different features from those observed in the spectra of Co3O4/P25 and Co3O4/rutile. There is a pronounced pre-edge feature at 7710 eV, which indicates the presence of Co0, and the edge and white line have shifted to the left by approximately 3 eV relative to the edge and white line of the Co3O4 reference (which are at 7723 and 7730 eV, respectively). The white line and the spectral features between 7750 and 7825 eV for Co3O4/anatase appear to be less intense (Fig. 9(d)). These observations further indicate the presence of relatively high amounts of Co0 (43.2 ± 2.5%) in this spent sample. There is also CoO (21.8 ± 1.5%), Co3O4 (21.3 ± 0.7%), and CoTiO3 (13.8 ± 1.8%) indicated by the LCF.
The presence of CoTiO3 in the Co3O4/rutile and Co3O4/anatase spent catalysts is in good agreement with the low magnetometry-derived DoRs reached by these samples (85.9% and 76.4%, respectively) at 450 °C during CO-PrOx when compared with Co3O4/P25 (91.9%), which did not form CoTiO3. We note that CoTiO3 was not observed in any supported catalyst during the PXRD-based in situ reduction or CO-PrOx experiments. This may have been a result of the CoTiO3 amounts being below the detection limit of the PXRD instrument. Nonetheless, the higher content of CoTiO3 in Co3O4/anatase is possibly due to the high reduction susceptibility of anatase (also see H2-TPR profile in Fig. 6(b)) followed by the migration and reaction of TixOy with CoOx species.7,10,16 Rutile is generally less susceptible to reduction, which might explain the lower amounts of CoTiO3 formed in Co3O4/rutile. The more facile formation of CoTiO3 in Co3O4/anatase is also supported by thermodynamic calculations (based on bulk phases), which show lower values for the change in the Gibbs free energy (ΔG) and partial pressure ratio of H2-to-H2O (pH2/pH2O) as a function of temperature than for Co3O4/rutile (Fig. S14 and S15†). The P25 support is a 15![[thin space (1/6-em)]](https://www.rsc.org/images/entities/char_2009.gif) :
:![[thin space (1/6-em)]](https://www.rsc.org/images/entities/char_2009.gif) 85 mixture of rutile and anatase, which is thought to make the support (or the anatase fraction) more stable under reduction conditions.21,22 This could explain the absence of CoTiO3 in the Co3O4/P25 spent sample.
85 mixture of rutile and anatase, which is thought to make the support (or the anatase fraction) more stable under reduction conditions.21,22 This could explain the absence of CoTiO3 in the Co3O4/P25 spent sample.
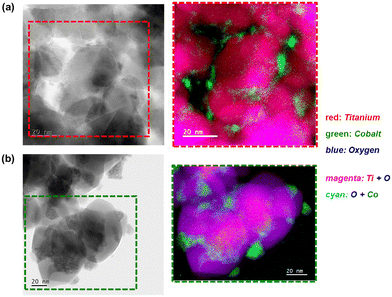 | ||
| Fig. 11 (Left) Bright-field STEM micrographs and the (right) magnified STEM-EELS composite maps showing the regions with Ti, O, and Co in the spent (a) Co3O4/P25 and (b) Co3O4/rutile catalysts. | ||
The exact cause of the size discrepancy between PXRD and STEM-EELS (especially regarding fcc Co0) remains unknown. However, it is possible that there exists a small number of large particles that were not identified using STEM-EELS, but were detected using PXRD, resulting in larger average sizes for fcc Co0 based on PXRD. Furthermore, in the absence of fcc–hcp Co0 intergrowth, the small particles identified using STEM-EELS could be hcp Co0 (although this is thermodynamically less feasible47,48), or could have been derived from hcp Co0, in the case of re-oxidation during sample storage.31
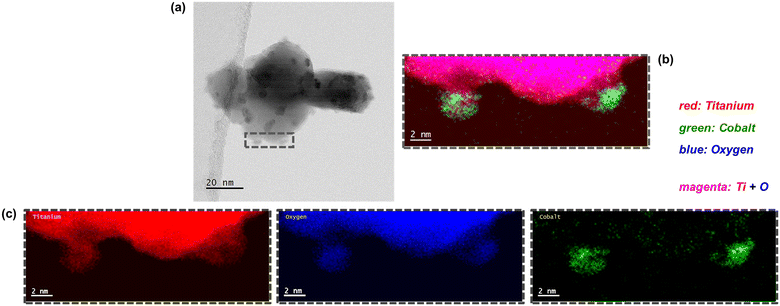
Interestingly, some of the small Co-bearing particles located on the edge of the large anatase particles have been encapsulated by TixOy species (Fig. 10 and S16†). This is not observed in the STEM-EELS micrographs of the Co3O4/P25 and Co3O4/rutile spent samples (Fig. 11). The encapsulation of CoOx particles by anatase-derived TixOy species is well-known under reducing conditions,7,10,16 but this is being observed after CO-PrOx for the first time in this study. In section 3.3., it was proposed that the absence of CH4 in the CO-PrOx product stream of Co3O4/anatase (Fig. 7(c)) was due to the encapsulation of Co0 (or more generally, CoOx species). Therefore, the detection of TixOy-encapsulated Co-bearing particles using STEM-EELS could explain the absence of CH4 formation over the partially reduced anatase-supported catalyst. Furthermore, it has been reported that the encapsulation of CoOx particles by TixOy species may lead to the formation of CoTiO3.7,10,16 This phase was detected in relatively high amounts (13.8 ± 1.8%) in the Co3O4/anatase spent sample using XAS.
4. Conclusions
The presented study investigated the effect of different TiO2 polymorphs (rutile, anatase, and a 15![[thin space (1/6-em)]](https://www.rsc.org/images/entities/char_2009.gif) :
:![[thin space (1/6-em)]](https://www.rsc.org/images/entities/char_2009.gif) 85 mixture of rutile and anatase (also commercially known as P25)), used as supports, on the chemical and crystallographic phase transformations of Co3O4 during dry CO-PrOx. The phase changes were detected in situ using PXRD and magnetometry as a function of temperature, while ex situ XAS and STEM-EELS analyses of the spent catalysts provided further complementary information on the phase changes that occurred. Furthermore, on-line gas product analysis was coupled with the in situ characterisation to evaluate catalytic performance. It was shown that supporting Co3O4 on P25 results in high CO conversions to CO2, with a maximum conversion of 72.7% achieved at 200 °C. Owing to the high concentrations of H2 in the feed (50%), the reduction of Co3O4 to CoO and ultimately to Co0 took place in all three catalysts, which caused a loss in the CO2 yield and selectivity. The DoR of Co3O4 to Co0 was highest on P25 (91.9% at 450 °C), while the DoR (76.4% at 450 °C) and CO2 yield (51.5% at 200 °C) was lowest on anatase. Assuming the MvK mechanism for CO oxidation, which depends on surface reduction (and re-oxidation), the high CO oxidation activity of Co3O4/P25 could be a result of its high surface reducibility. Furthermore, the high surface and bulk reducibility (as determined via in situ characterisation for the latter) of Co3O4/P25 could be due to the existence of weak interactions between the Co3O4 nanoparticles and P25 support.
85 mixture of rutile and anatase (also commercially known as P25)), used as supports, on the chemical and crystallographic phase transformations of Co3O4 during dry CO-PrOx. The phase changes were detected in situ using PXRD and magnetometry as a function of temperature, while ex situ XAS and STEM-EELS analyses of the spent catalysts provided further complementary information on the phase changes that occurred. Furthermore, on-line gas product analysis was coupled with the in situ characterisation to evaluate catalytic performance. It was shown that supporting Co3O4 on P25 results in high CO conversions to CO2, with a maximum conversion of 72.7% achieved at 200 °C. Owing to the high concentrations of H2 in the feed (50%), the reduction of Co3O4 to CoO and ultimately to Co0 took place in all three catalysts, which caused a loss in the CO2 yield and selectivity. The DoR of Co3O4 to Co0 was highest on P25 (91.9% at 450 °C), while the DoR (76.4% at 450 °C) and CO2 yield (51.5% at 200 °C) was lowest on anatase. Assuming the MvK mechanism for CO oxidation, which depends on surface reduction (and re-oxidation), the high CO oxidation activity of Co3O4/P25 could be a result of its high surface reducibility. Furthermore, the high surface and bulk reducibility (as determined via in situ characterisation for the latter) of Co3O4/P25 could be due to the existence of weak interactions between the Co3O4 nanoparticles and P25 support.
The Co0 formed on P25 and rutile existed in the fcc and hcp crystal forms at elevated temperatures during CO-PrOx, while only fcc Co0 was formed on anatase. The average larger size of Co0 crystallites, relative to the size of CoO crystallites, on P25 and rutile may have led to the formation of (partially) intergrown crystalline domains of fcc and hcp Co0. This sintering may have also been a result of the weaker NPSIs in Co3O4/P25 and Co3O4/rutile when compared with the NPSIs in Co3O4/anatase. The formation of CoTiO3 was confirmed in the anatase (13.8%) and rutile (8.9%) supported spent catalysts via ex situ XAS, while the presence of TixOy-encapsulated CoOx particles was only observed in the anatase-supported spent catalyst via ex situ STEM-EELS. The encapsulation of CoOx particles may have occurred because of the relatively high reducibility of the anatase support, which forms highly mobile TixOy species that migrate to the surface of the CoOx particles. In the case of the encapsulated fcc Co0 particles on anatase, CH4 formation did not take place (even at 450 °C) as the required surface active sites may have been blocked. On the other hand, CH4 formation was observed over the fcc and hcp Co0 on P25 and rutile, possibly because of minimal or no encapsulation.
Conflicts of interest
There are no conflicts to declare.Acknowledgements
Johnson Matthey, the DSI-NRF Centre of Excellence in Catalysis (c*change), and the Science and Technology Facilities Council (STFC) via GCRF-START (Global Challenges Research Fund – Synchrotron Techniques for African Research and Technology (ST/R002754/1)) are gratefully acknowledged for their financial support. The authors would also like to thank the staff in the Analytical Laboratory, within the Chemical Engineering department (University of Cape Town), for conducting the ICP-OES analysis. Finally, M. Panchal (University College London and UK Catalysis Hub) and Dr. N. Ramanan (Diamond Light Source) are thanked for assisting with the XAS measurements on beamline B18 at Diamond Light Source (sessions: SP19850-3, SP19850-4, and SP19850-5).References
- S. Farrokhpay, Adv. Colloid Interface Sci., 2009, 151, 24–32 CrossRef CAS PubMed.
- A. Jaroenworaluck, W. Sunsaneeyametha, N. Kosachan and R. Stevens, Surf. Interface Anal., 2006, 38, 473–477 CrossRef CAS.
- A. Fujishima and K. Honda, Nature, 1972, 238, 37–38 CrossRef CAS PubMed.
- D. A. H. Hanaor and C. C. Sorrell, Adv. Eng. Mater., 2014, 16, 248–254 CrossRef.
- G. Jacobs, T. K. Das, Y. Zhang, J. Li, G. Racoillet and B. H. Davis, Appl. Catal., A, 2002, 233, 263–281 CrossRef CAS.
- A. T. Bell, Science, 2003, 299, 1688–1691 CrossRef CAS PubMed.
- C. Hernández Mejía, T. W. van Deelen and K. P. de Jong, Nat. Commun., 2018, 9, 1–8 CrossRef PubMed.
- M. Mehrbod, M. Martinelli, A. G. Martino, D. C. Cronauer, A. Jeremy Kropf, C. L. Marshall and G. Jacobs, Fuel, 2019, 245, 488–504 CrossRef CAS.
- T. W. van Deelen, C. Hernández Mejía and K. P. de Jong, Nat. Catal., 2019, 2, 955–970 CrossRef CAS.
- M. Wolf, E. K. Gibson, E. J. Olivier, J. H. Neethling, C. R. A. Catlow, N. Fischer and M. Claeys, ACS Catal., 2019, 9, 4902–4918 CrossRef CAS.
- M. Wolf, N. Fischer and M. Claeys, Nat. Catal., 2020, 3, 962–965 CrossRef CAS.
- M. Wolf, N. Fischer and M. Claeys, Chem Catal., 2021, 1, 1014–1041 CrossRef CAS.
- U. Diebold, Surf. Sci. Rep., 2003, 48, 53–229 CrossRef CAS.
- Q. Fu, T. Wagner, S. Olliges and H. D. Carstanjen, J. Phys. Chem. B, 2005, 109, 944–951 CrossRef CAS PubMed.
- Q. Fu and T. Wagner, Surf. Sci. Rep., 2007, 62, 431–498 CrossRef CAS.
- V. A. de la Peña O'Shea, M. Consuelo Álvarez Galván, A. E. Platero Prats, J. M. Campos-Martin and J. L. G. Fierro, Chem. Commun., 2011, 47, 7131–7133 RSC.
- N. N. Greenwood and A. Earnshaw, in Chemistry of the Elements, ed. N. N. Greenwood and A. Earnshaw, Elsevier Ltd., 2nd edn, 1997, vol. 92, pp. 954–975 Search PubMed.
- S. Bagheri, N. Muhd Julkapli and S. B. A. Hamid, Sci. World J., 2014, 2014, 1–21 CrossRef PubMed.
- J. Li and D. Xu, Chem. Commun., 2010, 46, 2301 RSC.
- L. Chu, Z. Qin, J. Yang and X. Li, Sci. Rep., 2015, 5, 12143 CrossRef CAS PubMed.
- B. Jongsomjit, C. Sakdamnuson and P. Praserthdam, Mater. Chem. Phys., 2005, 89, 395–401 CrossRef CAS.
- B. Jongsomjit, T. Wongsalee and P. Praserthdam, Mater. Chem. Phys., 2005, 92, 572–577 CrossRef CAS.
- T. V. Choudhary and D. W. Goodman, Catal. Today, 2002, 77, 65–78 CrossRef CAS.
- A. Mishra and R. Prasad, Bull. Chem. React. Eng. Catal., 2011, 6, 1–14 CAS.
- P. Mars and D. W. van Krevelen, Chem. Eng. Sci., 1954, 3, 41–59 CrossRef CAS.
- L. Lukashuk, N. Yigit, R. Rameshan, E. Kolar, D. Teschner, M. Hävecker, A. Knop-Gericke, R. Schlögl, K. Föttinger and G. Rupprechter, ACS Catal., 2018, 8, 8630–8641 CrossRef CAS PubMed.
- L. Lukashuk, K. Föttinger, E. Kolar, C. Rameshan, D. Teschner, M. Hävecker, A. Knop-Gericke, N. Yigit, H. Li, E. McDermott, M. Stöger-Pollach and G. Rupprechter, J. Catal., 2016, 344, 1–15 CrossRef CAS.
- T. M. Nyathi, N. Fischer, A. P. E. York and M. Claeys, Faraday Discuss., 2017, 197, 269–285 RSC.
- M. Khasu, T. Nyathi, D. J. Morgan, G. J. Hutchings, M. Claeys and N. Fischer, Catal. Sci. Technol., 2017, 7, 4806–4817 RSC.
- T. M. Nyathi, N. Fischer, A. P. E. York, D. J. Morgan, G. J. Hutchings, E. K. Gibson, P. P. Wells, C. R. A. Catlow and M. Claeys, ACS Catal., 2019, 9, 7166–7178 CrossRef CAS PubMed.
- T. M. Nyathi, N. Fischer, A. P. E. York and M. Claeys, ACS Catal., 2020, 10, 11892–11911 CrossRef CAS.
- T. M. Nyathi, M. I. Fadlalla, N. Fischer, A. P. E. York, E. J. Olivier, E. K. Gibson, P. P. Wells and M. Claeys, Appl. Catal., B, 2021, 297, 120450 CrossRef CAS.
- M. I. Fadlalla, T. M. Nyathi and M. Claeys, Catalysts, 2022, 12, 118 CrossRef CAS.
- M. C. M. Claeys and N. F. Fischer, Sample Presentation Device for Radiation-Based Analytical Equipment, US Pat., 8597598B2, 2013 Search PubMed.
- N. Fischer and M. Claeys, Catal. Today, 2016, 275, 149–154 CrossRef CAS.
- N. Fischer and M. Claeys, J. Phys. D: Appl. Phys., 2020, 53, 293001 CrossRef CAS.
- M. C. M. Claeys, E. W. J. van Steen, J. L. Visagie and J. van de Loosdrecht, Magnetometer, US Pat., 8773118B2, 2014 Search PubMed.
- P. Munnik, N. A. Krans, P. E. de Jongh and K. P. de Jong, ACS Catal., 2014, 4, 3219–3226 CrossRef CAS.
- V. Sechovský, in Encyclopedia of Materials: Science and Technology, ed. K. H. J. Buschow, R. W. Cahn, M. C. Flemings, B. Ilschner, E. J. Kramer, S. Mahajan and P. Veyssière, Elsevier Science Ltd, 2nd edn, 2001, pp. 5018–5032 Search PubMed.
- A. A. Coelho, J. Appl. Crystallogr., 2003, 36, 86–95 CrossRef CAS.
- C. Weidenthaler, Nanoscale, 2011, 3, 792–810 RSC.
- E. Marceau, X. Carrier, M. Che, O. Clause and C. Marcilly, in Handbook of Heterogeneous Catalysis, ed. G. Ertl, H. Knözinger, F. Schüth and J. Weitkamp, Wiley-VCH Verlag GmbH & Co. KGaA, Weinheim, Germany, 2008, pp. 467–484 Search PubMed.
- E. van Steen, M. Claeys, M. E. Dry, J. van de Loosdrecht, E. L. Viljoen and J. L. Visagie, J. Phys. Chem. B, 2005, 109, 3575–3577 CrossRef CAS PubMed.
- N. Fischer, E. van Steen and M. Claeys, Catal. Today, 2011, 171, 174–179 CrossRef CAS.
- N. Fischer, M. Minnermann, M. Baeumer, E. van Steen and M. Claeys, Catal. Lett., 2012, 142, 830–837 CrossRef CAS.
- W. A. Sławiński, E. Zacharaki, H. Fjellvåg and A. O. Sjåstad, Cryst. Growth Des., 2018, 18, 2316–2325 CrossRef.
- E. Klugmann, H. J. Blythe and F. Walz, Phys. Status Solidi A, 1994, 146, 803–813 CrossRef CAS.
- S. Ram, Mater. Sci. Eng., A, 2001, 304–306, 923–927 CrossRef.
- H. E. du Plessis, J. P. R. de Villiers, A. Tuling and E. J. Olivier, Phys. Chem. Chem. Phys., 2016, 18, 30183–30188 RSC.
- E. van Steen, G. S. Sewell, R. A. Makhothe, C. Micklethwaite, H. Manstein, M. de Lange and C. T. O'Connor, J. Catal., 1996, 162, 220–229 CrossRef CAS.
- L. Zhong, T. Kropp, W. Baaziz, O. Ersen, D. Teschner, R. Schlögl, M. Mavrikakis and S. Zafeiratos, ACS Catal., 2019, 9, 8325–8336 CrossRef CAS.
- L. Zhong, M. Barreau, V. Caps, V. Papaefthimiou, M. Haevecker, D. Teschner, W. Baaziz, E. Borfecchia, L. Braglia and S. Zafeiratos, ACS Catal., 2021, 11, 5369–5385 CrossRef CAS.
- L. Zhong, M. Barreau, D. Chen, V. Caps, M. Haevecker, D. Teschner, D. H. Simonne, E. Borfecchia, W. Baaziz, B. Šmíd and S. Zafeiratos, Appl. Catal., B, 2021, 297, 120397 CrossRef CAS.
- R. C. Reuel and C. H. Bartholomew, J. Catal., 1984, 85, 78–88 CrossRef CAS.
- R. E. Newnham, J. H. Fang and R. P. Santoro, Acta Crystallogr., 1964, 17, 240–242 CrossRef CAS.
- M. Wolf, N. Fischer and M. Claeys, Mater. Chem. Phys., 2018, 213, 305–312 CrossRef CAS.
- M. Wolf, S. J. Roberts, W. Marquart, E. J. Olivier, N. T. J. Luchters, E. K. Gibson, C. R. A. Catlow, J. H. Neethling, N. Fischer and M. Claeys, Dalton Trans., 2019, 48, 13858–13868 RSC.
- A. J. Dent, G. Cibin, S. Ramos, A. D. Smith, S. M. Scott, L. Varandas, M. R. Pearson, N. A. Krumpa, C. P. Jones and P. E. Robbins, J. Phys.: Conf. Ser., 2009, 190, 012039 CrossRef.
Footnote |
| † Electronic supplementary information (ESI) available. See DOI: https://doi.org/10.1039/d2cy01699k |
| This journal is © The Royal Society of Chemistry 2023 |

