Insights into Pt–CN species on an alumina-supported platinum catalyst as active intermediates or inhibitors for low-temperature hydrogen cyanide synthesis from methane and nitric oxide†
Atsushi
Takagaki
 *a,
Kyoko K.
Bando
 *b,
Tatsuya
Yamasaki
c,
Junichi
Murakami
b,
Nobuya
Suganuma
d,
I. Tyrone
Ghampson
 d,
Tetsuya
Kodaira
 e,
Tatsumi
Ishihara
 cf and
Tetsuya
Shishido
 *dg
*dg
aDivision of Materials and Chemical Engineering, Faculty of Engineering, Yokohama National University, 79-5 Tokiwadai, Hodogaya-ku, Yokohama, Kanagawa 240-8501, Japan. E-mail: takagaki-atsushi-gw@ynu.ac.jp
bNanomaterials Research Institute, National Institute of Advanced Industrial Science and Technology (AIST), 1-1-1, Higashi, Tsukuba, Ibaraki 305-8565, Japan. E-mail: k.k.bando@aist.go.jp
cDepartment of Applied Chemistry, Faculty of Engineering, Kyushu University, 744 Motooka, Nishi-ku, Fukuoka 819-0395, Japan
dDepartment of Applied Chemistry for Environment, Graduate School of Urban Environmental Sciences, Tokyo Metropolitan University, 1-1 Minami-osawa, Hachioji, Tokyo 192-0397, Japan. E-mail: shishido-tetsuya@tmu.ac.jp
eResearch Institute for Chemical Process Technology, National Institute of Advanced Industrial Science and Technology (AIST), 1-1-1, Higashi, Tsukuba, Ibaraki 305-8565, Japan
fInternational Institute for Carbon-Neutral Energy Research (WPI-I2CNER), Kyushu University, 711 Motooka, Nishi-ku, Fukuoka 819-0395, Japan
gElements Strategy Initiative for Catalysts and Batteries, Kyoto University, 1-30 Goryo-Ohara, Nishikyo-ku, Kyoto 615-8245, Japan
First published on 25th July 2023
Abstract
Methane (CH4) was converted to hydrogen cyanide (HCN) at temperatures from 300 to 425 °C using a commercial 5 wt% Pt/Al2O3 catalyst with nitric oxide (NO) as an oxidant. HCN yield of ca. 1% was maintained after 100 h at 400 °C, whereas the yield was increased to 3.2% at 425 °C but rapidly decreased, resulting in 0.24% after 90 h at 425 °C. In situ X-ray absorption fine structure (XAFS) and Fourier-transform infrared (FTIR) measurements showed that Pt–CN species emerged and the extent of the adsorbed species roughly correlated with the production of HCN. However, the Pt–CN species continuously accumulated at higher temperatures than 400 °C regardless of the catalytic activity. The experiment of purging using helium gas followed by hydrogen after the reaction of CH4 and NO at 425 °C showed that the Pt–CN species were strongly adsorbed on the Pt catalyst and removed from the catalyst by hydrogen treatment with simultaneous formation of HCN and NH3. This study revealed that the Pt–CN species can function not only as important reaction intermediates, but also as inhibitors of the reaction. An appropriate balance of Pt–CN species and hydrogen species over the Pt surface is required to produce HCN continuously.
Introduction
The CH4–NO reaction has been investigated a few decades ago as a deNOx reaction in which CH4 was used as a reductant like H2 and NH3.1–3 Pt catalyst could selectively convert hazardous NO in the low concentration (ppm level) to harmless N2 along with the formation of CO2. Recently, low-temperature activation of CH4 has been attracting attention from both academic and industrial fields because of increasing demand for avoiding the use of fossil fuels.4,5 The cleavage of the C–H bond at low temperature usually requires strong oxidant reagents such as H2O2 in liquid-phase reactions,6,7 and NO/O2 (NO/NO2 oxygen atom shuttle) in gas-phase reactions,8,9 or the use of non-thermal plasma,10,11 while a representative exception is the system over Cu–zeolite using molecular oxygen as an ideal oxidant.12–14We found that the use of NO as a sole oxidant in the presence of a Pt/Al2O3 catalyst afforded the selective production of hydrogen cyanide (HCN) from CH4 at relatively low temperatures from 300 to 425 °C.15,16 The production rate of HCN was 11.4 mmol g−1 h−1 and the corresponding turnover frequency was 253 h−1, which was much higher than that of the plasma-assisted HCN synthesis method using a Pt/titanosilicate (TS-1) catalyst from CH4 and NH3 (17.6 h−1).17 The Pt/Al2O3 catalyst was able to have a high durability of 100 h and over when the reaction was carried out at 400 °C. While Pt-based catalyst (Pt–Rh gauze) is used for the industrial production of HCN through Andrussow and BMA (Blausäure aus Methan und Ammoniak) processes operated at high temperature over 1000 °C,18,19 the reaction mechanism of our study is different from that of the industrial processes because negligible formation of HCN was observed from a reaction of CH4 with NH3 and O2 using Pt/Al2O3 at low temperature.15 We previously claimed from the results of in situ FTIR/mass spectroscopy (MS) and in situ XAFS measurements that adsorbed Pt–CN species on platinum is attributable to an intermediate species for the production of HCN because the dependence of corresponding adsorption observed for both FTIR and XAFS spectra on the reaction temperature roughly correlated with that of the activity. However, a more detailed study for the Pt–CN species was necessary to understand the reactivity of Pt/Al2O3 for the low-temperature synthesis of HCN. In the present report, the behaviour of the adsorbed species including Pt–CN was monitored using in situ FTIR and XAFS measurements from 300 to 425 °C in a CH4–NO gas atmosphere together with MS measurements for the detection of gaseous products. The influence of He and H2 purge after the reaction at 425 °C on the reactivity of the adsorbed species was also conducted to clarify the role of the species. In addition, the long-term stability of the Pt/Al2O3 catalyst was studied at 400 and 425 °C and the significant difference of the results was discussed.
Experimental
Materials
The alumina-supported platinum catalyst (5 wt% Pt/Al2O3) was purchased from FUJIFILM Wako Pure Chemical. The reaction gases comprising CH4 (99.9%), 10.4% NO in He, and He (99.9%) for the reactivity study were purchased from Fukuoka Oxygen Co., Ltd, and the gases used for in situ XAFS and FTIR measurements were obtained from Japan Fine Products. These gases were mixed to use as necessary.Characterization
The physicochemical properties of the catalysts were evaluated according to our previous study.15 The crystal structure was determined by X-ray diffraction (XRD, RINT-2500HLR+, Rigaku), and the specific surface area was evaluated with nitrogen adsorption (BELSORP mini-II, Microtrac BEL). The particle size distribution of Pt nanoparticles was observed using transmission electron microscopy (JEM-ARM200, JEOL).Reactivity test
The low-temperature HCN synthesis reaction was conducted under ambient pressure using a fixed-bed continuous flow reactor. 100 mg of the Pt/Al2O3 catalyst was used, which was pelletized, crushed, and sieved to a particle size of 315–630 μm. Prior to each experiment, the catalyst was pretreated at 400 °C for 1 h under a flow of 50% H2/He (100 mL min−1). After the pretreatment, the gas was switched to He, and the reactor was set to the desired temperature. After stabilizing the desired temperature for 30 min, the reaction gas comprising 13.4% CH4, 1.8% NO, and 84.8% He was fed to the reactor at a total flow rate of 100 mL min−1. The reaction temperature was varied from 300 to 425 °C with 25 °C increments. The gaseous products were analysed by two on-line gas chromatographs (GCs) and one Fourier transform infrared (FTIR) spectrometer. Several products including HCN, CH3CN, CO, CO2, NH3, N2, N2O and H2O were detected in addition to the reactants, CH4 and NO. The first GC (Nexis GC-2030, Shimadzu) equipped with a barrier discharge ionization detector (BID) together with a capillary column (Restek, Rt-U-BOND, 30 m × 0.53 mm i.d. × 20 μm film diameter) was used for the analysis of CO2, H2O, HCN and CH3CN. The second GC (GC-2014, Shimadzu) with a thermal conductivity detector (TCD) and a molecular sieve column (MS-13X, 2 m × 3 mm i.d.) was employed for the analysis of O2, N2 and CH4. The on-line FTIR spectrometer (VIR-200, JASCO) equipped with a triglycine sulphate (TGS) detector together with a 10 cm gas cell was used to analyse NO, NO2, N2O, NH3, and CO. The FTIR spectra were taken at a resolution of 1 cm−1 over the range from 7800 to 800 cm−1. Quantitative analysis was based on a calibration curve prepared using a reference gas of known composition. Conversion and yield were calculated using the equations provided below. Here, ni is the number of moles of i at the exit of the reactor, ni,0 is the moles in the feed, and vi is the number of carbon or nitrogen atoms in species i.Caution: This experiment requires special attention because of the highly toxic HCN generated. Always make sure that there are no leaks from the gas line or the reaction apparatus and monitor them with a gas sensor.
In situ XAFS/MS
In situ XAFS and MS measurements were carried out in the BL9C beamline of the Photon Factory at the Institute of Materials Structure Science, High-Energy Accelerator Research Organization (KE-IMSS-PF, proposal nos. 2019G070 and 2020G039). The mass spectrometer (BELMASS, MicrotracBEL) was employed to analyse the gas products. 100 mg of the Pt/Al2O3 powder was pressed into a disc with a diameter of 10 mm, and set in an in situ reactor equipped with Kapton windows which were cooled by circulating water. Pt L3-edge XAFS spectra were measured in the transmission mode using ionization chambers for the detection of primary (I0, 15% Ar/N2) and transmitted (IT, 50% Ar/N2) X-ray. The in situ XAFS measurement was carried out in a quick mode with a 60 s acquisition time per spectrum over an energy range of 11![[thin space (1/6-em)]](https://www.rsc.org/images/entities/char_2009.gif) 057–12
057–12![[thin space (1/6-em)]](https://www.rsc.org/images/entities/char_2009.gif) 661 eV. The composition, and flow rate of the reactant gas and the temperature in the catalyst pretreatment and reaction were the same as those in the reactivity test using the fixed-bed reactor. The spectra of Pt foil and PtO2 were taken as references in a step scan mode and the spectrum of Pt foil was used for energy calibration. Data processing was performed using Athena software ver.0.9.26.20
661 eV. The composition, and flow rate of the reactant gas and the temperature in the catalyst pretreatment and reaction were the same as those in the reactivity test using the fixed-bed reactor. The spectra of Pt foil and PtO2 were taken as references in a step scan mode and the spectrum of Pt foil was used for energy calibration. Data processing was performed using Athena software ver.0.9.26.20
In situ FTIR
In situ FTIR measurement was performed to monitor the behaviour of adsorbed species on the catalyst surface after the reaction followed by hydrogen treatment at 425 °C. An FTIR spectrometer (FT/IR-610, JASCO) equipped with a mercury cadmium telluride (MCT) detector was used. A self-supporting disc with a diameter of 10 mm comprising 15 mg Pt/Al2O3 was placed in an in situ stainless cell equipped with KBr windows which were kept at 25 °C by circulating cooling water. The relative gas composition, and flow rate of the reactant gas and the temperature in the catalyst pretreatment and reaction were the same as those in the reactivity test using the fixed-bed reactor.Results and discussion
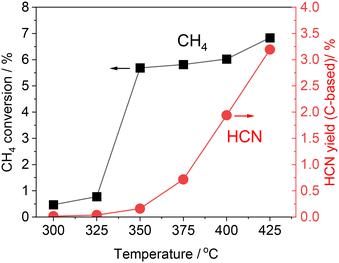
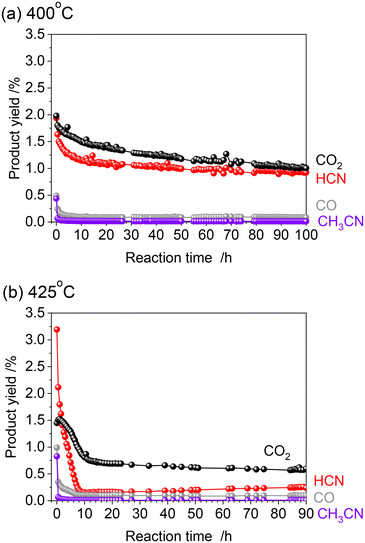
The alumina-supported platinum catalyst (5 wt% Pt/Al2O3) used in this study consists of Pt particles with an average particle size of 4.3 nm and alumina that is primarily in the γ phase with a partial θ phase with a surface area of 99 m2 g−1. The XRD pattern and TEM image of the sample are shown in Fig. S1 (see ESI†). In our previous study, the reactivity was evaluated by increasing temperature from 300 to 425 °C (Fig. 1 and S2†).15 After introduction of the reactant gas at 300 °C, 0.02% of HCN carbon-based yield was obtained, indicating that C–H cleavage, NO dissociation, and C–N coupling reactions occurred at such low temperature. The increase of reaction temperature increased the HCN yield which reached 3.2% at 425 °C. Note that the CH4 conversion increased markedly from 350 °C, and at 350 °C and 375 °C, most of the product was fully oxidized CO2 (Fig. S2†). Thereafter, the yield of CO2 decreased, and at 400 °C, the yields of HCN and CO2 were about the same, and at 425 °C, the yield of CO2 decreased to about 1/3 of that of HCN. The long-term stability has been confirmed at 400 °C for 100 h. Although the HCN yield at 400 °C was initially 1.9% and decreased during the early stages of the reaction, it gradually became steady and reached 0.92% after 100 h. As the initial yield of HCN was higher at 425 °C than at 400 °C, long-term tests were also conducted at 425 °C in the present study.Fig. 2 shows the results of the long-term durability of the catalyst at 400 and 425 °C in terms of product yields. Both experiments were conducted after introducing CH4 and NO starting at 300 °C and increasing the temperature in 25 °C steps in the same manner. As mentioned above, at 425 °C, the initial HCN yield was 3.2%, much higher than at 400 °C. However, a significant decrease in the HCN yield was observed, which was quite different from the long-term test at 400 °C. The HCN yield decreased considerably to 0.15% after 12 h. Interestingly, however, as the reaction was prolonged, the HCN yield gradually increased, reaching 0.24% after 90 h. More than 20 points were measured from 12 to 90 h of reaction, and the yield of HCN increased steadily with time. This suggests that the adsorbed species on the active site changes dynamically during the reaction.
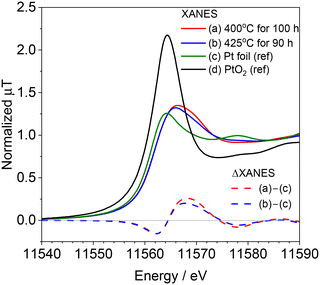
After the long-term reaction, the spent catalysts were taken from the reactor and exposed in air. Fig. 3 shows the ex situ Pt L3-edge XANES spectra of the spent catalysts after the reaction at 400 and 425 °C along with the spectra of Pt foil and PtO2 as references. The intensity of the white line in the XANES spectra of the spent catalyst was weak and closer to that of Pt foil than that of PtO2. In addition, none of the spectra of the spent catalysts were represented by a linear combination fitting of Pt and PtO2. Fig. 3 also shows the difference in XANES spectra of the spent catalyst and that of the Pt foil. Both spent catalysts for the reaction at 400 and 425 °C showed similar spectra. Negative absorptions were observed at 11![[thin space (1/6-em)]](https://www.rsc.org/images/entities/char_2009.gif) 562 eV whereas positive ones at 11
562 eV whereas positive ones at 11![[thin space (1/6-em)]](https://www.rsc.org/images/entities/char_2009.gif) 569 eV, indicating that the energy was shifted due to the formation of adsorbed species on the catalyst surface. In our previous study, the increase of absorbance at 11
569 eV, indicating that the energy was shifted due to the formation of adsorbed species on the catalyst surface. In our previous study, the increase of absorbance at 11![[thin space (1/6-em)]](https://www.rsc.org/images/entities/char_2009.gif) 569 eV (Δ7 eV from E0) was attributed to the adsorption of Pt–CN species.15 Because this absorbance at 11
569 eV (Δ7 eV from E0) was attributed to the adsorption of Pt–CN species.15 Because this absorbance at 11![[thin space (1/6-em)]](https://www.rsc.org/images/entities/char_2009.gif) 569 eV became stronger with reaction temperature in the in situ measurement, we assumed that this Pt–CN species was the active species in the reaction. However, in the present study, the difference XANES spectrum of the catalyst reacted at 425 °C, where deactivation was observed, appears to be similar to that of the spent catalyst reacted at 400 °C, where HCN was steadily produced, suggesting that this Pt–CN species is not merely contributing as an active species.
569 eV became stronger with reaction temperature in the in situ measurement, we assumed that this Pt–CN species was the active species in the reaction. However, in the present study, the difference XANES spectrum of the catalyst reacted at 425 °C, where deactivation was observed, appears to be similar to that of the spent catalyst reacted at 400 °C, where HCN was steadily produced, suggesting that this Pt–CN species is not merely contributing as an active species.
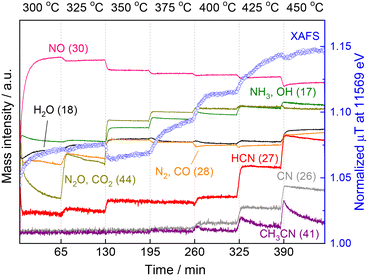
These results motivated us to investigate in situ XAFS/MS measurements from 300 to 450 °C because in the previous study the XAFS and MS measurements were carried out separately and the in situ XAFS measurement was examined from 300 to 400 °C and the data above 400 °C were lacking.15Fig. 4 shows the in situ XAFS/MS spectroscopy result for the reaction of CH4 and NO over the Pt/Al2O3 catalyst. The reaction temperature was increased by 25 °C increments from 300 to 450 °C. Each temperature was held for 60 min and then raised to the next temperature at a rate of 5 °C min−1. Eight mass signals corresponding to NO and several products including HCN are shown together with the Pt L3-edge XAFS absorbance at 11![[thin space (1/6-em)]](https://www.rsc.org/images/entities/char_2009.gif) 569 eV characteristic of the Pt–CN species. At the initial stage of the reaction at 300 °C, the mass signal of 30 (m/z = 30) corresponding to NO was very small and increased to a certain level with time, indicating that most of NO was quickly adsorbed on the catalyst and reacted to form N2O (m/z = 44) or N2 (m/z = 28). The N2O signal was initially quite high but rapidly decreased, which is in good agreement with the increased NO signal (i.e. decreased NO conversion). The Pt L3-edge XAFS absorbance at 11
569 eV characteristic of the Pt–CN species. At the initial stage of the reaction at 300 °C, the mass signal of 30 (m/z = 30) corresponding to NO was very small and increased to a certain level with time, indicating that most of NO was quickly adsorbed on the catalyst and reacted to form N2O (m/z = 44) or N2 (m/z = 28). The N2O signal was initially quite high but rapidly decreased, which is in good agreement with the increased NO signal (i.e. decreased NO conversion). The Pt L3-edge XAFS absorbance at 11![[thin space (1/6-em)]](https://www.rsc.org/images/entities/char_2009.gif) 569 eV also rapidly increased, and then continued to increase gradually at 300 °C. When the temperature was increased to 325 °C, the MS signal for NO decreased, indicating that more NO gas reacted. The MS signal for N2O (and CO2) (m/z = 44) increased again then gradually decreased, but substantially higher than that at 300 °C, which is in good agreement with the increase of N2O yield at 325 °C in our previous reactivity test.15 The MS signal of HCN (m/z = 27) apparently increased, indicating the formation of HCN at the temperature. The intensity of the corresponding XANES spectra monotonically increased from 300 to 325 °C. Thereafter, the MS signal for NO (m/z = 30) decreased stepwise with increasing reaction temperature, consistent with the increase in NO conversion in the reactivity test. From 350 °C, the formation of NH3 and CO2 was pronounced, and the corresponding MS signals (m/z = 17 and 44) also increased. The XANES absorbance decreased once at 350 °C and then increased again. In the previous study,15 at lower temperature a distinct peak was observed at 11
569 eV also rapidly increased, and then continued to increase gradually at 300 °C. When the temperature was increased to 325 °C, the MS signal for NO decreased, indicating that more NO gas reacted. The MS signal for N2O (and CO2) (m/z = 44) increased again then gradually decreased, but substantially higher than that at 300 °C, which is in good agreement with the increase of N2O yield at 325 °C in our previous reactivity test.15 The MS signal of HCN (m/z = 27) apparently increased, indicating the formation of HCN at the temperature. The intensity of the corresponding XANES spectra monotonically increased from 300 to 325 °C. Thereafter, the MS signal for NO (m/z = 30) decreased stepwise with increasing reaction temperature, consistent with the increase in NO conversion in the reactivity test. From 350 °C, the formation of NH3 and CO2 was pronounced, and the corresponding MS signals (m/z = 17 and 44) also increased. The XANES absorbance decreased once at 350 °C and then increased again. In the previous study,15 at lower temperature a distinct peak was observed at 11![[thin space (1/6-em)]](https://www.rsc.org/images/entities/char_2009.gif) 568 eV, which was attributed to Pt–CO.21,22 This suggests that the increase in 11
568 eV, which was attributed to Pt–CO.21,22 This suggests that the increase in 11![[thin space (1/6-em)]](https://www.rsc.org/images/entities/char_2009.gif) 569 eV at 300 and 325 °C is mainly due to the adsorbed species of Pt–CO. The apparent decrease of the XANES absorbance at 11
569 eV at 300 and 325 °C is mainly due to the adsorbed species of Pt–CO. The apparent decrease of the XANES absorbance at 11![[thin space (1/6-em)]](https://www.rsc.org/images/entities/char_2009.gif) 569 eV from 325 to 350 °C could be due to the change of adsorbed species from Pt–CO to Pt–CN on the Pt surface. The same result was obtained for another experiment of temperature-programmed reaction as shown below. At 375 °C, the XANES absorbance increased with time, suggesting the accumulation of Pt–CN species on the catalyst surface. When the temperature was increased to 400 °C, the XANES absorbance increased markedly with increasing the MS signal for HCN. However, after about 15 min, the XANES intensity became almost constant and simultaneously the MS signal for HCN (m/z = 27) remained unchanged. At 425 °C, the MS signal for HCN increased further, and at the same time the MS signal for CH3CN (m/z = 41) clearly increased. Thereafter, the MS signal for HCN gradually decreased with time. On the contrary, the absorbance of XANES increased monotonically, which is much different from the mostly constant absorbance at 400 °C. When the reaction temperature was further raised to 450 °C, the MS signal for HCN increased again with the signal for CH3CN, but these signals clearly decreased with the reaction time, indicating the deactivation of the catalyst at such high temperature. The XANES absorbance at 11
569 eV from 325 to 350 °C could be due to the change of adsorbed species from Pt–CO to Pt–CN on the Pt surface. The same result was obtained for another experiment of temperature-programmed reaction as shown below. At 375 °C, the XANES absorbance increased with time, suggesting the accumulation of Pt–CN species on the catalyst surface. When the temperature was increased to 400 °C, the XANES absorbance increased markedly with increasing the MS signal for HCN. However, after about 15 min, the XANES intensity became almost constant and simultaneously the MS signal for HCN (m/z = 27) remained unchanged. At 425 °C, the MS signal for HCN increased further, and at the same time the MS signal for CH3CN (m/z = 41) clearly increased. Thereafter, the MS signal for HCN gradually decreased with time. On the contrary, the absorbance of XANES increased monotonically, which is much different from the mostly constant absorbance at 400 °C. When the reaction temperature was further raised to 450 °C, the MS signal for HCN increased again with the signal for CH3CN, but these signals clearly decreased with the reaction time, indicating the deactivation of the catalyst at such high temperature. The XANES absorbance at 11![[thin space (1/6-em)]](https://www.rsc.org/images/entities/char_2009.gif) 569 eV decreased slightly once only when the temperature was increased from 425 to 450 °C, but continued to increase after reaching 450 °C, indicating that Pt–CN species accumulated on the catalyst surface. These results show that although the HCN production and XANES absorbance increased with increasing reaction temperature, the HCN production and XANES absorbance did not necessarily coincide at temperatures above 425 °C. Rather, the catalytic activity was found to decrease with increase in the XANES absorbance, which is associated with an increase in Pt–CN adsorbed species.
569 eV decreased slightly once only when the temperature was increased from 425 to 450 °C, but continued to increase after reaching 450 °C, indicating that Pt–CN species accumulated on the catalyst surface. These results show that although the HCN production and XANES absorbance increased with increasing reaction temperature, the HCN production and XANES absorbance did not necessarily coincide at temperatures above 425 °C. Rather, the catalytic activity was found to decrease with increase in the XANES absorbance, which is associated with an increase in Pt–CN adsorbed species.
Next, another in situ XAFS/MS experiment was performed in which the reaction was carried out by raising the temperature to 425 °C, followed by hydrogen treatment and then the reaction was implemented again. The temperature and gas time profiles along with the MS spectra are shown in Fig. 5. Prior to the reaction with CH4 and NO, the catalyst was pretreated by H2 at 400 °C for 1 h the same as our previous study. After switching H2 to He with cooling to 300 °C, the reaction with CH4 and NO started at 300 °C for 30 min, then the temperature was increased to 425 °C at the rate of 10 °C min−1 as the temperature-programmed reaction (TPR). Afterward, the temperature was kept at 425 °C for 30 min in the presence of CH4 and NO. At the same temperature, the gas was changed to He for 30 min to remove the reaction gas from the cell, and then H2 was introduced for 1 h. After 30 min of He purging, the CH4 and NO reaction gas was introduced again isothermally. Changes of the MS spectra during TPR showed the same trend as in the previous experiment with stepwise temperature changes. It should be noted that the MS signal for HCN (m/z = 27) increased significantly from 400 to 425 °C but decreased with time at 425 °C, which is in good agreement with the previous experiment. After switching to He, all MS signals decreased with time, indicating the removal of the reaction gas from the cell. After the He purging, the treatment with H2 allowed the desorption of HCN and NH3, suggesting that some adsorbed species (likely Pt–CN) on the catalyst surface, which could not be removed by He purging, reacted with hydrogen to form HCN and NH3. When the reaction gas composed of CH4 and NO was introduced again after the He purging, the MS signals for products including HCN, NH3 and CH3CN increased with a rapid consumption of NO at the initial stage of the reaction.
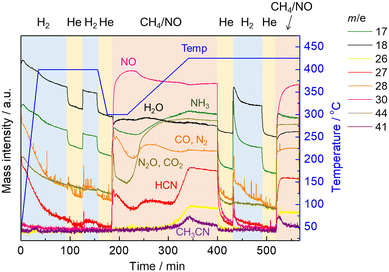 | ||
| Fig. 5 The time profiles of operating temperature, the gas composition, and the obtained MS spectra. | ||
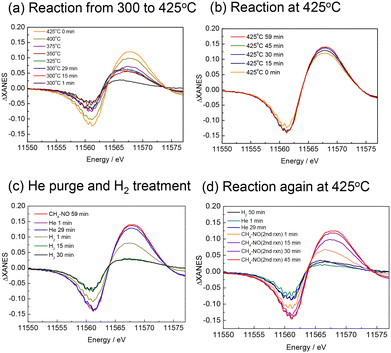
The XANES difference spectra measured simultaneously with the MS spectra are shown in Fig. 6. At 300 and 325 °C, the spectra were broad, but at temperatures above 350 °C, the peak attributable to Pt–CN species was clearly observed and increased in intensity with temperature (Fig. 6(a)). It should be noted that the peak at 11![[thin space (1/6-em)]](https://www.rsc.org/images/entities/char_2009.gif) 569 eV is assigned to the Pt–CN species in the present study, but this is a simple assumption because the shape of the spectra implies that it contains multiple components, and the intensity of the spectrum does not exactly match that of the Pt–CN species observed in the FTIR measurement. Although we do not exclude the possibility that other adsorbed species or structural changes of the catalyst during the reaction may also contribute, the present study mainly discusses the behaviour of the Pt–CN species. At 425 °C, the peak continued to increase with time (Fig. 6(b)) while the MS signal for HCN slightly decreased shown in Fig. 5. When the atmosphere was changed from the reaction gas to He, the peak of ΔXANES spectra decreased very slightly but substantially remained unchanged, indicating that the Pt–CN species were strongly adsorbed on the catalyst surface at 425 °C (Fig. 6(c)). After the introduction of H2, the peak rapidly decreased to almost zero, indicating the full removal of the adsorbed species. This is consistent with the formation of HCN and NH3 desorbed from the catalyst surface. After He purging followed by the introduction of the reaction gas, the peak at the same position was recovered and increased with prolonged time (Fig. 6(d)). Note that in Fig. 6(d) the peak top of the spectrum of the second reaction after 1 min (coloured in orange) is different from the others. It appears similar to those at the begging of the first reaction at 300 °C (Fig. 6(a)). The CO and N2 signals in the MS also rose immediately after the initial introduction of CH4–NO gases, indicating that Pt–CO was also formed at the beginning of the second reaction.
569 eV is assigned to the Pt–CN species in the present study, but this is a simple assumption because the shape of the spectra implies that it contains multiple components, and the intensity of the spectrum does not exactly match that of the Pt–CN species observed in the FTIR measurement. Although we do not exclude the possibility that other adsorbed species or structural changes of the catalyst during the reaction may also contribute, the present study mainly discusses the behaviour of the Pt–CN species. At 425 °C, the peak continued to increase with time (Fig. 6(b)) while the MS signal for HCN slightly decreased shown in Fig. 5. When the atmosphere was changed from the reaction gas to He, the peak of ΔXANES spectra decreased very slightly but substantially remained unchanged, indicating that the Pt–CN species were strongly adsorbed on the catalyst surface at 425 °C (Fig. 6(c)). After the introduction of H2, the peak rapidly decreased to almost zero, indicating the full removal of the adsorbed species. This is consistent with the formation of HCN and NH3 desorbed from the catalyst surface. After He purging followed by the introduction of the reaction gas, the peak at the same position was recovered and increased with prolonged time (Fig. 6(d)). Note that in Fig. 6(d) the peak top of the spectrum of the second reaction after 1 min (coloured in orange) is different from the others. It appears similar to those at the begging of the first reaction at 300 °C (Fig. 6(a)). The CO and N2 signals in the MS also rose immediately after the initial introduction of CH4–NO gases, indicating that Pt–CO was also formed at the beginning of the second reaction.
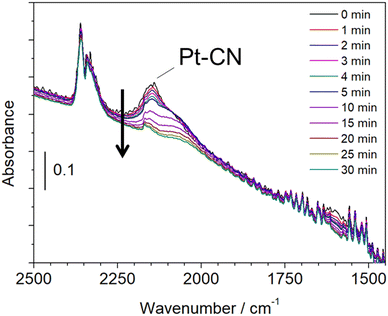
A similar experiment that reacted with CH4 and NO at 425 °C followed by He purge and hydrogen treatment was examined by in situ FTIR. Fig. 7 shows the in situ FTIR spectra at 425 °C, which was measured in a transmission mode using a Pt/Al2O3 self-supporting disc set in a stainless reactor. The reaction was carried out by introducing CH4 and NO at 300 °C followed by increasing the reaction temperature to 425 °C. The strong absorption was observed at 2148 cm−1, which is attributed to Pt–CN species.23 When hydrogen was flowed into the reactor after He purging, the adsorption peak was decreased with time, indicating the removal of adsorbed Pt–CN species. This result is in a good agreement with that of the in situ XAFS/MS measurement. Another experiment was carried out by the fixed bed flow reactor and the on-line FTIR spectrometer with a 10 cm gas cell. The experimental conditions were the same as the in situ XAFS/MS and in situ FTIR measurements.
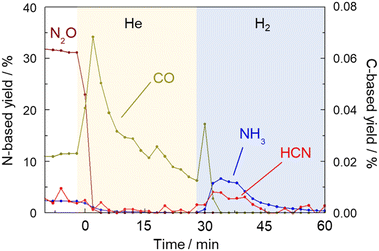
Fig. 8 shows the results of products including HCN, NH3, N2O and CO which were detected by FTIR every two minutes. When the gas was switched from a mixture of CH4 and NO to He at 425 °C, the concentration of CO increased sharply and then decreased, indicating the removal of Pt–CO species from the catalyst surface by He purging. It should be noted that while the concentrations of HCN and NH3 were very low in the He flow, those were clearly increased by H2 treatment. This experiment further confirmed that the strongly adsorbed Pt–CN species were removed by H2 resulting in the formation of HCN and NH3. The amount of HCN desorbed was calculated to be 0.58 μmol by integration. The amount of active sites of the Pt catalyst was 43 μmol g−1.15 As 100 mg of the catalyst was used for the reaction, the amount of HCN desorbed corresponded to 13% of the amount of the Pt surface sites. The results of long-term tests at 400 and 425 °C were described above in which the total amount of HCN formed by 90 h reaction at each temperature was 30.5 and 8.0 mmol, respectively. From these values, turnover number was 7100 and 1860 at 400 and 425 °C, respectively, reconfirming that HCN was more stably formed at 400 °C. The steady yield of HCN at 400 °C was 0.92%, which corresponds to the production rate of 50 μmol g−1 min−1 and TOF of 1.2 min−1. In contrast, the yield of HCN at 425 °C for 90 h was 0.24%, indicating TOF of 0.3 min−1. Considering that the amount of HCN desorbed comes from Pt–CN species adsorbed on the Pt catalyst, it is difficult to discuss the 13% coverage quantitatively, but this value is not necessarily off the mark, since the hydrogen species formed by methane cleavage, the NO-derived active oxygen species to cleave the C–H bonds of that methane, and even the nitrogen species for C–N coupling should all be on the same Pt surface.
We have previously reported the effect of the particle size of Pt on the HCN formation.16 The HCN yield was higher for Pt catalysts with larger Pt particles under the same contact time. The XAFS results of four spent Pt catalysts of different particle sizes showed that the peak at 11![[thin space (1/6-em)]](https://www.rsc.org/images/entities/char_2009.gif) 569 eV assigned to Pt–CN was observed for all Pt catalysts, but the absorption intensity was higher for the smaller Pt catalysts with lower HCN yield and lower for the larger Pt catalyst with higher HCN yield. This result is consistent with the conclusion of the present study that Pt–CN adsorbed species are both active and inhibitor species.
569 eV assigned to Pt–CN was observed for all Pt catalysts, but the absorption intensity was higher for the smaller Pt catalysts with lower HCN yield and lower for the larger Pt catalyst with higher HCN yield. This result is consistent with the conclusion of the present study that Pt–CN adsorbed species are both active and inhibitor species.
Conclusions
The Pt–CN species were formed during the reaction with CH4 and NO and continued to be accumulated at high temperature, which caused the decrease of catalytically active sites of Pt. The Pt–CN species were strongly adsorbed on the catalyst surface which could not be removed in He purge. The introduction of hydrogen helped to desorb the species resulting in the formation of gaseous HCN and NH3 as products. Thus, the lack of hydrogen species on the catalyst surface would be a major reason for deactivation of the catalyst at temperatures higher than 425 °C. In the present reaction conditions, the only hydrogen source is CH4 in which the C–H bond is cleaved by oxidation using active oxygen species which are delivered by dissociative adsorption of NO. The Pt catalysts are capable to catalyse multiple reactions including dissociation of NO, activation of CH4 and formation of Pt–CN species as well as desorption of HCN in which these reactions proceed on the same active sites. The Pt–CN species are the key intermediate species to produce HCN, but because of the strong adsorption property, the species continue to be accumulated on the active sites of the catalyst when hydrogen supply via CH4 cleavage is not enough. Therefore, the Pt–CN species are not only the intermediates but also behave as inhibitors. The continuous production of HCN requires an appropriate balance of Pt–CN species via C–N coupling and hydrogen species via C–H cleavage over the Pt surface.Author contributions
AT, KB and TS: conceptualization; AT, KB, TY, JM, NS, ITG and TK: investigation and methodology; KB and TS: formal analysis; AT, KB, IT and TS: supervision; AT, KB and TS: funding acquisition; AT: writing – original draft; KB, ITG, TK and TS: writing – review & editing.Conflicts of interest
There are no conflicts to declare.Acknowledgements
This work was supported by the Japan Science and Technology (JST) Agency under the CREST program, Grant Number JPMJCR16P2. A part of this work was performed at the KEK-IMSS-PF (2019G070 and 2020G039).Notes and references
- R. Burch and S. Scire, Appl. Catal., B, 1994, 3, 295–318 CrossRef CAS.
- R. Burch and A. Ramli, Appl. Catal., B, 1998, 15, 49–62 CrossRef CAS.
- I. Balint, A. Miyazaki and K.-I. Aika, Chem. Commun., 2002, 1044–1045 RSC.
- H. Fujisaki, T. Ishizuka, H. Kotani, Y. Shiota, K. Yoshizawa and T. Kojima, Nature, 2023, 616, 476–481 CrossRef CAS PubMed.
- Z. Liang, T. Li, M. Kim, A. Asthagiri and J. F. Weaver, Science, 2017, 356, 299–303 CrossRef CAS PubMed.
- C. Hammond, M. M. Forde, M. H. Ab Rahim, A. Therford, Q. He, R. L. Jenkuns, N. Dimitratos, J. A. Lopez-Sanchez, N. F. Dummer, D. M. Murphy, A. F. Carley, S. H. Taylor, D. J. Willock, E. E. Stangland, J. Kang, H. Hagen, C. J. Kiely and G. J. Hutchings, Angew. Chem., Int. Ed., 2012, 51, 5129–5133 CrossRef CAS PubMed.
- P. K. Sajith, A. Staykov, M. Yoshida, Y. Shiota and K. Yoshizawa, J. Phys. Chem. C, 2020, 124, 13231–13239 CrossRef CAS.
- V. Vargheese, J. Murakami, K. K. Bando, I. T. Ghampson, G.-N. Yun, Y. Kobayashi and S. T. Oyama, J. Catal., 2020, 389, 352–365 CrossRef CAS.
- I. T. Ghampson, S.-T. B. Lundin, T. Shishido and S. T. Oyama, Catal. Sci. Technol., 2021, 11, 2708–2712 RSC.
- T. Nozaki and K. Okazaki, Catal. Today, 2013, 211, 29–38 CrossRef CAS.
- W. Bi, Y. Tang, X. Li, C. Dai, C. Song, X. Guo and X. Ma, Commun. Chem., 2022, 5, 124 CrossRef CAS PubMed.
- S. Grundner, M. A. C. Markovits, G. Li, M. Tromp, E. A. Pidko, E. L. M. Hensen, A. Jentys, M. Sanchez-Sanchez and J. A. Lercher, Nat. Commun., 2015, 6, 7546 CrossRef PubMed.
- K. Narsimhan, K. Iyoki, K. Dinh and Y. Román-Leshkov, ACS Cent. Sci., 2016, 2, 424–429 CrossRef CAS PubMed.
- V. L. Sushkevich, D. Palagin, M. Ranocchiari and A. A. van Bokhoven, Science, 2017, 356, 523–527 CrossRef CAS PubMed.
- T. Yamasaki, A. Nishida, N. Suganuma, Y. Song, X. Li, J. Mukarami, T. Kodaira, K. K. Bando, T. Ishihara, T. Shishido and A. Takagaki, ACS Catal., 2021, 11, 14660–14668 CrossRef CAS.
- T. Yamasaki, A. Takagaki, T. Shishido, K. K. Bando, T. Kodaira, J. Murakami, J. T. Song, E. Niwa, M. Watanabe and T. Ishihara, J. Jpn. Pet. Inst., 2022, 65, 184–191 CrossRef CAS.
- Z. Guo, Y. Yi, L. Wang, J. Yan and K. Guo, ACS Catal., 2018, 8, 10219–10224 CrossRef CAS.
- V. A. Kondratenko, G. Weinberg, M.-M. Pohl and D. S. Su, Appl. Catal., A, 2010, 381, 66–73 CrossRef CAS.
- D. Hasenberg and L. D. Schmidt, J. Catal., 1986, 97, 156–168 CrossRef CAS.
- B. Ravel and A. Newville, J. Synchrotron Radiat., 2004, 12, 537–541 CrossRef PubMed.
- T. Kubota, K. Asakura and Y. Iwasawa, Catal. Lett., 1997, 46, 141–144 CrossRef CAS.
- O. V. Safonova, M. Tromp, J. A. van Bokhoven, F. M. F. de Groot, J. Evans and P. Glatzel, J. Phys. Chem. B, 2006, 110, 16162–16164 CrossRef CAS PubMed.
- G. R. Bamwenda, A. Obuchi, A. Ogata and K. Mizuno, Chem. Lett., 1994, 23, 2109–2112 CrossRef.
Footnote |
| † Electronic supplementary information (ESI) available: XRD, TEM, product yields as a function of temperature. See DOI: https://doi.org/10.1039/d3cy00581j |
| This journal is © The Royal Society of Chemistry 2023 |


