 Open Access Article
Oxidation pathways of linoleic acid revisited with electrodynamic balance–mass spectrometry
Marcel
Müller
 *,
Fabrice
Stefanetti
and
Ulrich K.
Krieger
 *
*
Institute for Atmospheric and Climate Science, ETH Zurich, Universitätstrasse 16, 8092 Zurich, Switzerland. E-mail: marcel.mueller@env.ethz.ch; ulrich.krieger@env.ethz.ch
First published on 28th November 2022
Abstract
Unsaturated organic compounds in aerosol particles undergo oxidative ageing via heterogeneous reactions with atmospheric oxidants. Ozonolysis of linoleic acid has been serving as a proxy for this process and the linoleic acid decay has been shown to deviate from a linear dependence on ozone concentration. We use electrodynamic balance–mass spectrometry to measure mass spectra from levitated droplets before and after exposure to specific ozone mixing ratios. We find almost identical reactive uptake coefficients for ozone mixing ratios from 1 to 10 ppm, suggesting that a limitation due to droplet surface coverage with ozone is absent in this regime. However, a strong increase of the uptake coefficient for ozone mixing ratios below approximately 0.2 ppm is observed. Based on measurements using an oxygen atmosphere without ozone, which also show a degradation of linoleic acid, we attribute the apparent increase of the uptake coefficient to the oxidation of linoleic acid with molecular oxygen. These findings are consistent with an autoxidation mechanism, as proposed previously. Our results highlight that strongly elevated oxidant concentrations can mask the impact of autoxidation, which is slow but may dominate under atmospheric conditions.
Environmental significanceMany laboratory setups investigating the ozonolysis of model systems mimic atmospheric processes but apply strongly elevated ozone concentrations. Electrodynamic balance–mass spectrometry allows to investigate single levitated droplets, which may be trapped for several days under a wide range of oxidant concentrations, and provides molecular-level insight into particle composition. In the oxidation of linoleic acid, the influence of the reaction conditions on the decay of linoleic acid and on the product spectra reveals the importance of oxidation with molecular oxygen. Therefore, in systems with competing reactions, care needs to be taken, that elevated concentrations of one oxidant do not dominate the fate of the reactant. |
1 Introduction
In order to understand the fate and impact of atmospheric aerosol particles, it is necessary to understand chemical transformation reactions that alter the composition of aerosol particles. Organic compounds often contribute strongly to the total aerosol mass.1 However, the analysis and the molecular understanding of the organic fraction is complicated by the overwhelming number of different compounds and potential intermolecular reactions.2–4 The reactivity of organic compounds with gas-phase oxidants depends on their chemical structure. For example, unsaturated compounds are prone to undergo oxidation with ozone5,6 and are found in fatty acids and lipids, which are detected in natural and anthropogenic aerosols.7–9A particular chemical compound, which has been investigated in several studies as a model compound is linoleic acid (Fig. 1). This doubly unsaturated acid was used to study the uptake of ozone onto organic phases,10,11 to investigate the influence of ozonolysis on particle sizes and their cloud condensation nucleation activity,12 and to measure products from linoleic acid ozonolysis using MS techniques,13 Raman-, and infrared spectroscopy.14–17 Besides the oxidation via ozonolysis, linoleic acid is known to undergo free radical oxidation with molecular oxygen (autoxidation). The autoxidation mechanism and products of fatty acids and fatty acid esters have been studied in the fields of air pollution toxicity and food science.18–23 In particular the bis-allylic hydrogen of linoleic acid and its esters lead to a high susceptibility to hydrogen abstraction.
In studies on the oxidative ageing of linoleic acid in deposited droplets and films, it has been reported that the consumption of linoleic acid does not scale linearly with the ozone mixing ratio in the gas phase. Two effects have been suggested to cause this non-linearity. (i) An effect of particle surface coverage by ozone, which could be described with a Langmuir–Hinshelwood mechanism.15,16 (ii) A competition between oxidation by ozone and autoxidation.14,17 Because the autoxidation is expected to proceed largely independent of the ozone concentration, its relative importance increases towards low ozone concentrations.
Recent experiments have mainly focused on detection methods based on Raman- and IR spectroscopy,15–17 which are sensitive to certain functional groups but not on a molecular level. Based on these studies, we apply electrodynamic balance–mass spectrometry (EDB–MS) to investigate the influence of the ozone concentration on the decay of linoleic acid in single levitated particles. Experiments based on particle levitation in an EDB allow to store particles for long durations of several days without contact between the particles and a support. Therefore, the investigation and the comparison of atmospheric aerosol processes that require a wide range of reaction durations (e.g. due to strongly differing oxidant concentrations) is rendered possible.24 By coupling an EDB with MS, molecular-level information about the droplet composition can be obtained during the ageing process.
2 Instrumentation and methods
In EDB–MS, an electrodynamic field is used to levitate single droplets for reactions under well-defined conditions. Subsequently, particles are ejected for MS analysis. This technique has been used to monitor the evaporation of semi-volatile compounds,25–28 for quantitative measurements of compounds in droplet mixtures,29,30 and to study chemical reactions in droplets.31–35 In our setup, an evaporation unit is used to transfer the compounds into the gas phase and ionise those in a cold plasma ion source before MS analysis. A detailed description of the instrumentation and the typical experimental procedure can be found elsewhere.35In brief, single droplets of linoleic acid were produced from a linoleic acid solution (10 wt% linoleic acid (≥99%, Sigma-Aldrich) in methanol (UHPLC for MS, Sigma-Aldrich), freshly prepared or stored at <6 °C for less than one week) using a droplet on demand generator. Droplets were charged inductively and injected into a quadrupole type EDB. In the EDB, droplets are confined by the electrodynamic field from AC and DC electrodes, with the DC voltages compensating the gravitational force of the droplets. Once injected, the droplets are stored for at least 15 minutes in a nitrogen atmosphere before being exposed to oxidants. During this time, all methanol evaporates from the droplet, which is indicated by reaching a steady voltage required to counteract gravitation.
The two-dimensional angular scattering pattern (phase function) of particles illuminated by a laser is captured and the mean peak-to-peak angle in the phase function is used to estimate the droplet size by comparison to simulated phase functions.36,37 The mean droplet size in this study was 25.4 ± 2.5 μm. The obtained MS signal was normalised with respect to the initial droplet volume.
Droplet ageing experiments were carried out by flowing a dry gas stream of 300 sccm through the EDB (RH < 15%). For measurements at ozone mixing ratios ≤1 ppm, a calibration ozone generator (Photometric O3 Calibrator – Model 401, Advanced Pollution Instrumentation, USA) was used, otherwise an ambient ozone simulator (AOS 2 with bypassed pump, BMT Messtechnik, Germany) was used. Both ozone generators use UV-light for generating ozone and, hence, we expect no significant NOx production during ozone generation. However, while the generator used for low ozone mixing ratios uses a built-in zero air generator, the one used for higher mixing ratios uses the untreated pressurised air supply. Oxidation experiments without ozone were carried out with air from the same supply. For measurements of the ozone mixing ratio, an electrochemical ozone sensor was used. We measured the concentrations of NOx in the air before and after ozone production using a chemiluminescence NOx sensor (Model 200a, Advanced Pollution Instrumentation, USA). For all experiments with ozone mixing ratios ≤ 1 ppm, NOx levels were below detection limit (1 ppb), whereas at all other measurements the NOx levels were those of outside air (typically below 20 ppb). Ozone levels in the in-house supplied air were below detection limits (1 ppb, measured with Ozone Monitor BMT 932).
For the analysis of droplet compositions, droplets were ejected from the trap into a home-built evaporation unit, held at 190 °C. The total gas flow to the mass spectrometer was 1.5 l min−1, consisting of a gas flow through the evaporation unit (300 sccm N2), a control gas flow (5 sccm N2 guided through a gas washing bottle filled with a mixture of 1% toluene in ethanol) and complemented by a nitrogen flow. Subsequent to the droplet injection into the evaporation unit, the evaporation unit was flushed for 8 min, during which the MS signal was recorded. A cold plasma dielectric barrier discharge ion source (SICRIT SC-30X Ionisation Set, Plasmion GmbH, Germany) was used for ionisation of gas-phase species.38–40 The analysis by MS was carried out with a triple quadrupole mass spectrometer (QTRAP 4500, AB Sciex LLC, USA) at 2000 Da s−1 and unit resolution. Preliminary measurements of a broad range of mass-to-charge ratios (m/z) were carried out in negative Q3 mode from m/z 40 to 340 (total scan time of 0.155 s). Measurements focusing on the quantification of linoleic acid measured a limited set of m/z ranges to achieve a higher temporal resolution during the evaporation of droplets. The probed ranges were at m/z 84–86, 100–102, 120–122, 142–144, 156–160, 169–173, 184–188, 196–204, 208–212, and 276–283 with a pause between mass ranges of 5 ms (total scan time of 0.070 s).
Tandem MS experiments were carried out in negative mode with a scan rate of 2000 Da s−1 from m/z 5 to 212 (0.11 s total scan time). The collision cell was operated with N2, the collision energy was set to −20 V, and the collision cell exit potential to −11 V. The tandem MS signal was summed over a duration of 10 s after droplet evaporation started and assigned to bins of integer m/z.
Further data processing was carried out with MATLAB (Version R2019a, MathWorks, USA). For the preliminary comparison of entire mass spectra, the droplet signal was integrated over a duration of 240 s from the start of the evaporation, corrected for the background (measured during the last 30 s of this duration), and corrected for the signal obtained from the gas flows without droplet ejection. For the analysis of quantification experiments, an integration duration of 480 s was used.
3 Results
3.1 MS detection of unreacted linoleic acid
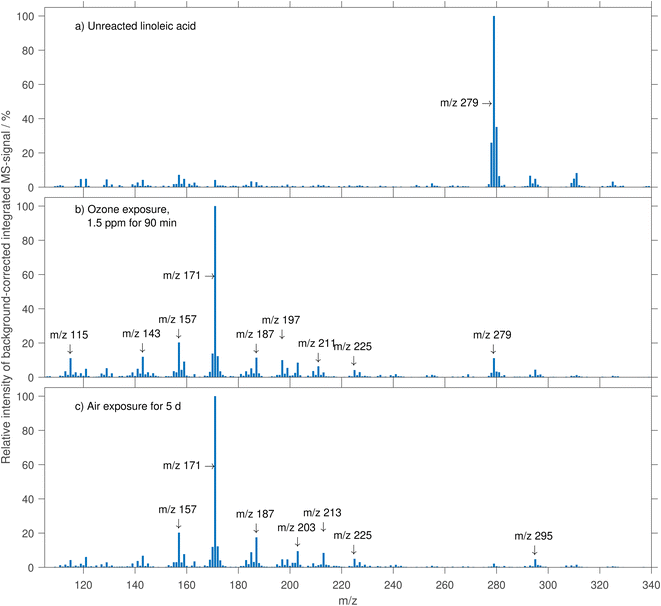
Linoleic acid was detected as deprotonated species ([M − H]−) in negative-mode mass spectra at m/z 279. The spectrum of an unreacted linoleic acid droplet is shown in Fig. 2a.Besides the peak at m/z 279, there are intense peaks at m/z 278 and 280. The signal at m/z 280 is assigned to the isotope signal of linoleic acid with one 13C atom, the peak at m/z 278 may stem from a deprotonated radical species (e.g. the pentadienyl radical), probably formed during ionisation. Although we did not see evidence for radical species in previous experiments, charged radical species are known to be involved in dielectric barrier discharge ionisation.40 A strong contribution to the spectrum at an even m/z is not expected for non-radical ions consisting only of carbon, oxygen and hydrogen atoms due to their valence and atomic mass.
Further minor peaks were detected at m/z 293, 295, 311, and 325. These stem potentially from impurities in the injected solution or from adducts formed in the ionisation process. As the intensity of these peaks goes down with increased exposure to ozone, it seems unlikely that they are due to the presence of linoleic acid oxidation products.
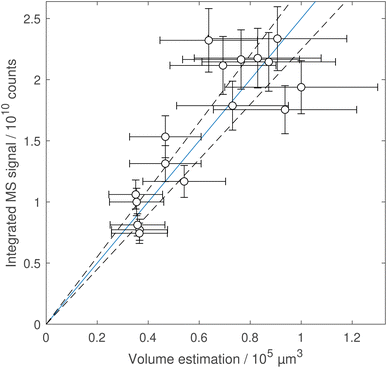
Pure, unreacted linoleic acid droplets of different sizes were used to estimate the process sensitivity of evaporation, ionisation and MS analysis, and to ensure a linear relationship between the volume and the MS signal of the droplets. In Fig. 7 in the appendix, the signal from 17 droplets collected on eight different days over the course of four months is plotted against the estimated droplet volume and reveals a linear trend within the uncertainties of the measurements. The signal variability from ionisation and mass spectrometry was estimated from averaged measurements of the control-gas species (ethanol and toluene), and nitrate generated in the ion source, that were taken on every day of MS measurements. The strongest variability of approximately 11% (standard deviation relative to the mean value) was obtained for deprotonated ethanol at m/z 45 (7.2 ± 0.8 × 10⁵ cps). This variability was considerably lower than the estimated uncertainty in particle volumes of about 30% (from a conservative estimation of a 10% uncertainty in radius measurements).
3.2 Measurement of the linoleic acid decay
The decay of linoleic acid in ozonolysis experiments was investigated in different studies. Hearn and Smith13 used the scenario of a near-surface reaction limited by the diffusion of ozone in the particle to fit the decay of linoleic acid and obtain the fraction of gas-particles collisions resulting in a reaction (reactive uptake coefficient). Zeng et al.,15 He et al.,16 and Chu et al.,17 described the decay of the linoleic acid concentration ([LA]) using an apparent pseudo-first order reaction rate constant (kapp = krxn × [O3]) as | (1) |
 | (2) |
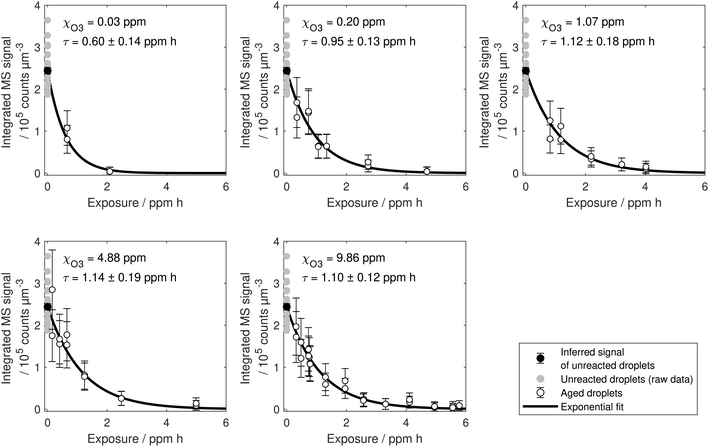
With the method presented in this paper, it is possible to combine the measurements of several particles that were aged for different reaction times to reconstruct a decay curve for the amount of linoleic acid in the droplets. This was done for five different ozone mixing ratios (0.03, 0.2, 1, 5 and 10 ppm). As can be seen in Fig. 8 in the appendix, the consumption of linoleic acid can be described well with an exponential decay. Exponential curves were fitted to the data taking into account the uncertainty in particle size and calculating a common [LA]0 for all fits using Bayesian inference as described by Müller et al.35
Eqn (2) suggests that the decay of linoleic acid depends on the product of the ozone concentration in the droplet and time ([O3] × t). It is a common assumption in aerosol ageing experiments that the reaction progress and the outcome of aerosol ageing can be described with the ozone exposure (product of applied ozone concentration and reaction time). Note that the exposure metric is equivalent to [O3] × t, if [O3] scales with the gas-phase concentration of ozone. This allows to compensate short reaction times in laboratory experiments with high ozone mixing ratios to reach atmospherically relevant ozone exposures. There are, however, a few cases (including linoleic acid oxidation) where this assumption breaks down14,17,35,41–43 and therefore the extrapolation from a laboratory setting to atmospheric condition needs to be assessed carefully in each case.
A compilation of all data from experiments with different ozone mixing ratios is plotted against exposure in Fig. 3. For high ozone mixing ratios, the decay curves lie almost perfectly on top of each other. However, the curves seem to deviate from the common curve for ozone mixing ratios lower than 1 ppm. Apparently, the degradation of linoleic acid is more efficient at low ozone concentrations.
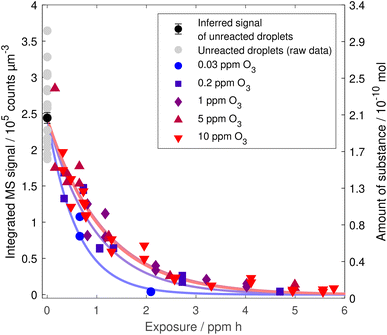 | ||
| Fig. 3 Linoleic acid decay with ozone exposure for different ozone mixing ratios. Each data point corresponds to an individual droplet that has been exposed to a specific gas phase for a certain time. Uncertainties on the single data points are depicted in Fig. 8 in the appendix and are left out here for clarity. The axis on the right gives the corresponding number of molecules based on an initial droplet of 25 μm radius. Exponential curves are based on point estimates from exponential fits taking into account the uncertainty in droplet size. | ||
3.3 Linoleic acid decay from pure oxygen ageing
The oxidation of linoleic acid in the absence of ozone was tested by exposing droplets to air for various durations. The measured signal is shown against the ageing time in Fig. 4. The concentration seems to remain relatively constant for a duration of approximately 40 h, after which a degradation reaction gains traction and the linoleic acid concentration starts to decay rapidly. After five days of exposure, no linoleic acid was detected anymore in the droplet (<1% compared to the intensity for unreacted linoleic acid droplets). This behaviour could be explained with an autocatalytic reaction that is speeding up during the course of the exposure and only slows down due to the decrease in available starting material. An approximation for the decay after 40 h was obtained by fitting an exponential curve to the data resulting in an e-folding lifetime of 29 ± 7 h, which is the same order of magnitude as in experiments with a low ozone mixing ratio (0.03 ppm) of 18 ± 5 h.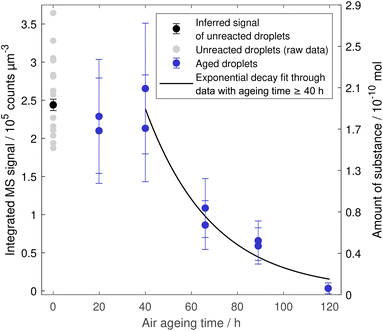 | ||
| Fig. 4 Linoleic acid decay in droplets exposed to air. Error bars of aged droplets depict the uncertainty from droplet volume estimation. | ||
In contrast, the composition of droplets stored in a nitrogen atmosphere for comparable times did not show any measurable deviation in the composition in comparison to unreacted droplets, nor any measurable size change.
3.4 Product formation
The mass spectrum of a linoleic acid droplet exposed to ozone is shown in Fig. 2b. After exposure to 1.5 ppm ozone for 1.5 h, several new peaks are detected (e.g. at m/z 115, 143, 157, 171, 187) whereas the linoleic acid signal intensity is drastically reduced in comparison to the spectrum of unreacted linoleic acid. Notably, also the signal from peaks at m/z > 279 decreased and no new species emerged with m/z > 279. The formation of high molecular weight products would be expected based on the ability of Criegee intermediates to build dimers and oligomers,44 but the absence of the corresponding peaks is assumed to be a result of thermal decomposition in the evaporation step.35,45,46 At m/z below 111, the spectra from droplets of unreacted and aged linoleic acid were not apparently different.The spectrum of a droplet exposed to air for five days is shown in Fig. 2c. Because of the different experiment durations, a direct comparison of spectra from different oxidation conditions (Fig. 2) is complicated. It seems, however, that the spectra from the two different oxidants (Fig. 2b and c) are rather similar. Both spectra are dominated by a peak at m/z 171 and many of the intensive peaks are found in both spectra. An interesting feature is the peak at m/z 211 in the ozonolysis experiment, which is seemingly absent in the autoxidation experiment. In turn, the signal from m/z 213 is much more intensive after exposure to ozone. Ongoing decrease in mass and size (not shown) indicates evaporation of semi-volatile compounds even after all linoleic acid was consumed, potentially due to ongoing secondary reactions.
4 Discussion
4.1 Reactive uptake coefficients dependence on ozone mixing ratio
Linoleic acid is expected to undergo chemical transformations according to two different chemical schemes.14,17 The ozonolysis according to Criegee was investigated by analysing gas phase products10,11 and particle phase products.13 From other unsaturated fatty acids it is known that reactive Criegee intermediates can lead to dimer and oligomer formation.5,6,46–49 The basic reactions of Criegee chemistry are presented in Fig. 5a and b. In a first step (a), the reaction of ozone with the olefin leads to the formation of a primary ozonide, which rapidly decays into an aldehyde and a reactive intermediate (Criegee intermediate). Criegee intermediates may undergo rearrangements (to form the corresponding carboxylic acid) or react with other functionalities, such as aldehydes or acids, forming higher molecular weight compounds (b).Also, there is evidence that the pentadiene substructure may undergo radical-induced hydrogen abstraction to produce the relatively stable pentadienyl radical, which can participate in further reactions (c).14,17,19–22 Note that hydroperoxyl radicals can act as hydrogen abstractors and therefore maintain an autocatalytic cycle. As the double bonds are preserved in the autoxidation, the resulting hydroperoxides may undergo ozonolysis as well, although reaction rates may drop for conjugated systems.50
When the decay of linoleic acid follows an exponential decay, the reactive uptake of ozone on linoleic acid (γ, ratio of ozone molecules hitting the surface divided by the number of linoleic acid molecules consumed) may be calculated from
 | (3) |
With the incoming flux of ozone molecules on the surface of a droplet Fin, the number concentration of molecules in the gas phase nO3, the mean thermal velocity ![[c with combining macron]](https://www.rsc.org/images/entities/i_char_0063_0304.gif) and the surface to volume ratio A/V.15,16
and the surface to volume ratio A/V.15,16
For the initial reactive uptake coefficient on droplets, eqn (1) and (3) may be combined with A/V = 3/r for spherical geometries to give
 | (4) |
The initial reactive uptake coefficient was calculated for all ozone mixing ratios and the obtained coefficients are shown in dependence on the ozone mixing ratios in Fig. 6, together with literature values.
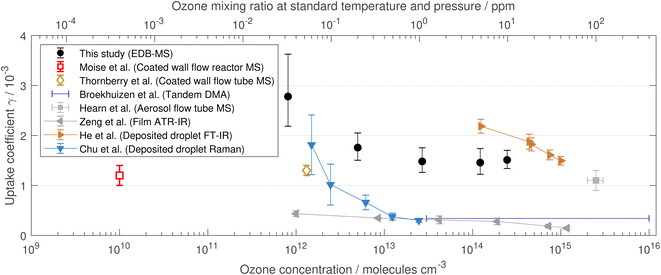 | ||
| Fig. 6 Reactive uptake coefficients for different ozone mixing ratios. Open symbols denote experiments that were run under reduced pressure (the x axis on the top does not apply to these). Note that Moise and Rudich10 and Thornberry and Abbatt11 measured only the loss rate of ozone, and Broekhuizen12 investigated droplet size changes to derive an uptake coefficient, while all others derived the uptake coefficient from the loss rate of linoleic acid. Literature data were taken from Moise and Rudich,10 Thornberry and Abbatt,11 Broekhuizen,12 Hearn and Smith,13 Zeng et al.15 and He et al.16 Apparent reaction rates from Chu et al.17 were converted to reactive uptake coefficients with eqn (4) using r = 70 μm. | ||
Our derived reactive uptake coefficients show a relatively constant value for ozone mixing ratios ≥ 1 ppm and an increase towards lower mixing ratios. There is a considerable spread in the reported reactive uptake coefficients in the literature. Our data for ozone mixing ratios > 0.2 ppm are rather on the higher side but generally in agreement. For low ozone mixing ratios, the literature data are sparse but the general trend of a steep increase of reactive uptake coefficients towards mixing ratios below approximately 0.2 ppm ozone (logarithmic abscissa in Fig. 6) is emerging from other studies as well.15,17 In the studies by Moise and Rudich10 and Thornberry and Abbatt,11 only the loss rate of ozone was monitored, which may explain the low uptake coefficient, as autoxidation is not detected (see Sect. 4.2).
In the recent literature, a Langmuir–Hinshelwood surface saturation behaviour has been discussed for the surface adsorption of ozone on linoleic acid.15–17 Such a saturation behaviour would lead to a significant decrease of the reactive uptake coefficient with increasing ozone mixing ratios. However, our reactive uptake coefficient level off towards higher ozone mixing ratios and stay at a constant value around 1.5 × 10⁻³. Therefore, our data suggest that for levitated droplets with radii of approximately 25 μm there is no significant surface saturation effect at ozone mixing ratios below 10 ppm. Surface saturation was reported in studies of films or deposited droplets of markedly bigger sizes (50 μm and 60–80 μm radius). Those have lower surface-to-volume ratios, which may have enhanced a surface saturation effect.
Besides the discussion of surface saturation, there are indications of autoxidation processes from Raman spectra of levitated and deposited droplets.14,17 Both reactions, the ozonolysis and the autoxidation can lead to the consumption of linoleic acid. However, the ozonolysis is expected to scale linearly with the gas-phase ozone concentration (in the absence of surface saturation phenomena), whereas the autoxidation should only depend on the availability of oxygen and a radical chain initiation but proceed independently from the applied ozone concentration. This means that the relative importance of the autoxidation increases towards low-ozone conditions, which explains the seemingly higher efficiency to consume linoleic acid (Fig. 3) and the increase in the reactive uptake coefficient (Fig. 6) towards lower mixing ratios. Note that in our experiments the oxygen concentration in air is not significantly changing and can be assumed identical in all experiments.
4.2 Linoleic acid autoxidation rate
The linoleic acid concentration in ageing experiments with air (Fig. 4) shows an induction period of approximately 40 h, during which the concentration does not significantly decrease. In the subsequent radical chain reaction period, the linoleic acid concentration decays rapidly. This is in line with a study of the methyl ester of linoleic acid in bulk samples, which showed that the formation rates of peroxidic products increased only after an induction period (of approximately 120 h).51 Differences in the induction periods are to be expected since the duration of the induction period depends on the exact composition of the condensed phase and the gas phase, and potentially on the rate of inter-phase transport, which is dependent on the surface-to-volume ratio. The reason for the slow acceleration of the linoleic acid degradation reaction (i.e. the radical initiation) in our experiments is not known, but it could be caused by traces of reactive gases in our compressed gas supply or caused by impurities in the droplet phase. Pryor et al.51 stated that the measured autoxidation rates could be strongly affected by trace impurities and Frankel52 emphasised that traces of metals can accelerate rates of lipid oxidation.We obtain here an estimate of the potential autoxidation rate from the linoleic acid decay in droplets exposed to air, in the absence of ozone. Because of the potential acceleration of the autoxidation by ozonolysis products, we use the high autoxidation rates from the radical chain reaction period for the comparison.
The e-folding lifetime of linoleic acid in the radical chain reaction period (t ≥ 40 h) is 29 ± 7 h. This is equal to a pseudo-first order rate constant kautox of 0.034 ± 0.007 h−1. We use this value as an estimate for the loss rate of linoleic acid due to autoxidation for droplets of 25 μm radius at an oxygen mixing ratio of 21%, as applied in all our experiments.
The loss of linoleic acid that is exclusively due to ozonolysis is derived from experiments at high ozone mixing ratios, where it is assumed that the decay of linoleic acid is dominated by ozonolysis because the reactive uptake coefficient for ozone remain largely constant (γ ≈ 1.5 × 10⁻³).
At low ozone mixing ratios, this reactive uptake coefficient may now be combined with the autoxidation rate kautox. We investigate here the conditions in our ozonolysis experiment with the lowest ozone mixing ratio (0.03 ppm). For two independent decay routes in this regime, the expected decay may be calculated in analogy to eqn (3) using
 | (5) |
For 0.03 ppm ozone, using the initial uptake coefficient from high ozone concentrations and the initial linoleic acid concentration, eqn (5) yields an exponential lifetime of 15.9 h, which is within the error of the experimentally inferred e-folding lifetime of 18 ± 5 h. This indicates that the apparent increase in reactive uptake of ozone on linoleic acid at low mixing ratios may be explained with autoxidative loss of linoleic acid. Also, it implies that the autoxidation induction period is shortened because of the ozone chemistry, and that the autoxidation rate reaches almost the same magnitude as in the radical chain reaction period of droplets aged in air.
It has been proposed in the literature that the induction period in autoxidation reactions may be influenced by byproducts from ozonolysis reactions.21,51 For example, Criegee intermediates have been found to lead to OH production in gas-phase reactions,53,54 and similar reactions have been proposed to occur in the particle phase.55
The uptake coefficient derived by Moise and Rudich10 from measurements of the ozone loss represent the uptake of ozone since their experiment did not detect the linoleic acid decay. Their obtained value should therefore be compared with the uptake coefficients for ozone-dominated linoleic acid decay. Indeed, it agrees well with our uptake coefficients for ozone mixing ratios ≥ 1 ppm.
4.3 Product formation
In levitated particle experiments, primary products with high vapour pressures (e.g. hexanal and nonenal) are expected to quickly partition to the gas phase.10,11,13 Secondary reactions may counteract the evaporation since dimers and oligomers have markedly lower vapour pressures and can be regarded as non-volatile for the applied timescales. In our experiments, aged droplets are transferred to an evaporation unit, where dimers and oligomers thermally decay and contribute to the monomer signal in the mass spectrum.35,45,46 This explains the absence of newly formed products at m/z ≥ 279.The product spectrum from ozonolysis (Fig. 2b) is overall similar to the spectrum from autoxidation (Fig. 2c). The similarities in the spectra from air and ozone oxidation suggest that products with a similar thermal decay pattern dominate the droplet composition in both experiments. This indicates that autoxidation-caused isomerisation is not dominating but autoxidation results in products with a similar carbon backbone as ozonolysis. Therefore, when using thermal evaporation and unit mass resolution MS, the product evolution is only of limited use to distinguish between autoxidation and ozonolysis.
An interpretation of the product spectra and a discussion of the evolution of the product peaks with exposure at different mixing ratios can be found in the appendix.
5 Conclusions
In this study, we discussed the contribution of autoxidation reactions to the loss of linoleic acid due to ozonolysis at atmospheric ozone concentrations. Autoxidation may be negligible under elevated ozone mixing ratios (⪆ 1 ppm) but contributes strongly to the decay at atmospherically relevant ozone mixing ratios. In other chemical systems, also evaporation of semi-volatile compounds and secondary chemistry may be affected by the choice of the oxidant concentration in laboratory experiments.Appendix
Calibration
Fig. 7 shows the calibration curve from differently-sized linoleic acid droplets. The sensitivity (with 95% confidence interval) was determined as (2.5 ± 0.3) × 105 counts μm−3.Linoleic acid decay curves
In Fig. 8, decay curves for the linoleic acid signal (m/z 279) are shown for individual experimental series with different ozone mixing ratios χO3.Product formation
The product spectrum from ozonolysis (Fig. 2b) can be explained largely based on the Criegee chemistry scheme (Fig. 5a and b). This scheme suggests products that correspond (when deprotonated) to peaks at m/z 171 and 211, namely 9-oxononanoic acid and 12-oxodec-9-enoic acid. Thermal decay products from dimers and oligomers formed in reactions of Criegee intermediates could be responsible for peaks at m/z 115, 155, 187, 227 (corresponding to m/z of deprotonated Criegee intermediates). Only very small peaks were found at the expected m/z for aldehydes with high vapour pressures (hexanal and non-3-enal, m/z 99 and 139). These aldehydes were probably not available for secondary chemistry in high quantities because of their high vapour pressure. Other MS peaks, including the second most intensive signal in the product spectrum at m/z 157, do not correspond to structures expected when considering only Criegee chemistry. It seems likely that these signals are formed through thermal degradation of lager molecules. In the context of autoxidation, the signal at m/z 157 was assigned to 8-oxooctanoic acid, produced by thermal decomposition of hydroperoxides of linoleic acid methyl ester directly injected onto a gas chromatograph.56 However, ozonolysis is expected to dominate the linoleic acid consumption at 1.5 ppm ozone (see Sect. 4.2).When comparing the product spectra from ozonolysis (Fig. 2b) and autoxidation (Fig. 2c), it seems that in the experiment with air, peaks at m/z 187 and 213 are gaining slightly in strength (relative to m/z 171) whereas the signal at 115, 197 and 211 seem less pronounced. However, note that the relative intensities may be influenced by evaporation of semi-volatile compounds as the reaction times for these two experiments differ strongly. While under autoxidation conditions the linoleic acid peak decreases, the signal from m/z 295 remains approximately constant.
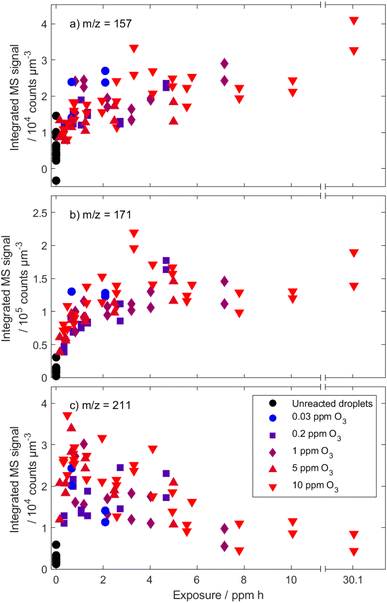
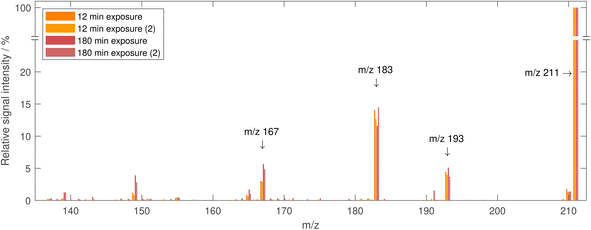
Analogous to the assessment of the decay of linoleic acid, the product formation can be compared at different ozone mixing ratios. A selection of typical product formation curves is shown in Fig. 9. Generally, there are MS peaks, for which the signal intensity increases rather monotonous with increasing ozone exposure (e.g. m/z 143, 157, 171, 173), and peaks, for which the signal intensity increases at first and later decreases again (e.g. m/z 197, 199, 209, 211). An increase followed by a decrease in concentration could be explained by evaporation of semi-volatile compounds or by further secondary reactions. However, a strong contribution of evaporation to the decrease can be ruled out since this should be much more pronounced in long experiments under low ozone concentrations. It is therefore most likely that the main contributor to the strong signal at these m/z is formed in the reaction of linoleic acid with ozone but reacts in a subsequent reaction and decreases in concentration. A compound, which might explain this behaviour is 12-oxodec-9-enoic acid, one of the two primary formed aldehydes with low vapour pressure (see above). Because it still contains one double bond, it can react further with ozone, which causes the decay. Note that the corresponding signal (at m/z 211) does not drop to zero, even at a very high ozone exposure of 30 ppm h. To exclude contributions to this signal from different species with the same nominal mass, tandem MS spectra were measured from droplets at exposures when the highest signal is expected and at the maximum exposure shown in Fig. 9. The resulting spectra (shown in Fig. 10) are almost identical, indicating that the dominant contribution to the peak at m/z 211 is the same in early and late stages of the experiment. Therefore, it seems plausible that a high particle viscosity and (partial) phase change inhibit the reaction through low ozone- and reactant diffusion. A phase change at high exposures was reported in the literature14 and is observed in our experiments for exposures of approximately 4–5 ppm h as significant distortions in the measured phase function.
There appears to be no significant dependence on ozone concentration when scaling the measured product signal with exposure. This can be attributed to the similarities of the product spectra from autoxidation and ozonolysis. Also, ozonolysis is expected to strongly dominate in all experiments with ozone mixing ratios ≥ 1 ppm. Strong effects on the droplet composition from product evaporation seem to be absent.
Author contributions
M. M. and F. S. carried out experiments and analysed the data. All authors discussed the results. M. M. produced the figures and wrote the manuscript, which was revised by F. S. and U. K. K.Conflicts of interest
There are no conflicts to declare.Acknowledgements
This work was supported by ETH Research Grant ETH-03 17-2. The authors would like to acknowledge support from Plasmion GmbH, Augsburg, Germany.References
- J. L. Jimenez, M. R. Canagaratna, N. M. Donahue, A. S. Prevot, Q. Zhang, J. H. Kroll, P. F. DeCarlo, J. D. Allan, H. Coe, N. L. Ng, A. C. Aiken, K. S. Docherty, I. M. Ulbrich, A. P. Grieshop, A. L. Robinson, J. Duplissy, J. D. Smith, K. R. Wilson, V. A. Lanz, C. Hueglin, Y. L. Sun, J. Tian, A. Laaksonen, T. Raatikainen, J. Rautiainen, P. Vaattovaara, M. Ehn, M. Kulmala, J. M. Tomlinson, D. R. Collins, M. J. Cubison, E. J. Dunlea, J. A. Huffman, T. B. Onasch, M. R. Alfarra, P. I. Williams, K. Bower, Y. Kondo, J. Schneider, F. Drewnick, S. Borrmann, S. Weimer, K. Demerjian, D. Salcedo, L. Cottrell, R. Griffin, A. Takami, T. Miyoshi, S. Hatakeyama, A. Shimono, J. Y. Sun, Y. M. Zhang, K. Dzepina, J. R. Kimmel, D. Sueper, J. T. Jayne, S. C. Herndon, A. M. Trimborn, L. R. Williams, E. C. Wood, A. M. Middlebrook, C. E. Kolb, U. Baltensperger and D. R. Worsnop, Evolution of organic aerosols in the atmosphere, Science, 2009, 326, 1525–1529 CrossRef CAS PubMed.
- J. F. Hamilton, P. J. Webb, A. C. Lewis, J. R. Hopkins, S. Smith and P. Davy, Partially oxidised organic components in urban aerosol using GCXGC-TOF/MS, Atmos. Chem. Phys., 2004, 4, 1279–1290 CrossRef CAS.
- A. H. Goldstein and I. E. Galbally, Known and Unexplored Organic Constituents in the Earth's Atmosphere, Environ. Sci. Technol., 2007, 41, 1514–1521 CrossRef CAS PubMed.
- B. Nozière, M. Kalberer, M. Claeys, J. Allan, B. D'Anna, S. Decesari, E. Finessi, M. Glasius, I. Grgić, J. F. Hamilton, T. Hoffmann, Y. Iinuma, M. Jaoui, A. Kahnt, C. J. Kampf, I. Kourtchev, W. Maenhaut, N. Marsden, S. Saarikoski, J. Schnelle-Kreis, J. D. Surratt, S. Szidat, R. Szmigielski and A. Wisthaler, The Molecular Identification of Organic Compounds in the Atmosphere: State of the Art and Challenges, Chem. Rev., 2015, 115, 3919–3983 CrossRef PubMed.
- R. Criegee, Mechanism of Ozonolysis, Angew. Chem., Int. Ed. Engl., 1975, 14, 745–752 CrossRef.
- J. Zahardis and G. A. Petrucci, The oleic acid-ozone heterogeneous reaction system: products, kinetics, secondary chemistry, and atmospheric implications of a model system – a review, Atmos. Chem. Phys., 2007, 7, 1237–1274 CrossRef CAS.
- M. Kang, P. Fu, S. G. Aggarwal, S. Kumar, Y. Zhao, Y. Sun and Z. Wang, Size distributions of n-alkanes, fatty acids and fatty alcohols in springtime aerosols from New Delhi, India, Environ. Pollut., 2016, 219, 957–966 CrossRef CAS PubMed.
- Q. Wang and J. Z. Yu, Ambient Measurements of Heterogeneous Ozone Oxidation Rates of Oleic, Elaidic, and Linoleic Acid Using a Relative Rate Constant Approach in an Urban Environment, Geophys. Res. Lett., 2021, 48, 1–10 Search PubMed.
- D. Zhang, H. Ren, W. Hu, L. Wu, L. Ren, J. Deng, Q. Zhang, Y. Sun, Z. Wang, K. Kawamura and P. Fu, Latitudinal difference in the molecular distributions of lipid compounds in the forest atmosphere in China, Environ. Pollut., 2022, 294, 118578 CrossRef CAS PubMed.
- T. Moise and Y. Rudich, Reactive Uptake of Ozone by Aerosol-Associated Unsaturated Fatty Acids: Kinetics, Mechanism, and Products, J. Phys. Chem. A, 2002, 106, 6469–6476 CrossRef CAS.
- T. Thornberry and J. P. D. Abbatt, Heterogeneous reaction of ozone with liquid unsaturated fatty acids: detailed kinetics and gas-phase product studies, Phys. Chem. Chem. Phys., 2004, 6, 84 RSC.
- K. E. Broekhuizen, Formation of cloud condensation nuclei by oxidative processing: unsaturated fatty acids, J. Geophys. Res.: Atmos., 2004, 109, D24206 CrossRef.
- J. D. Hearn and G. D. Smith, Kinetics and Product Studies for Ozonolysis Reactions of Organic Particles Using Aerosol CIMS, J. Phys. Chem. A, 2004, 108, 10019–10029 CrossRef CAS.
- A. K. Y. Lee and C. K. Chan, Heterogeneous Reactions of Linoleic Acid and Linolenic Acid Particles with Ozone: Reaction Pathways and Changes in Particle Mass, Hygroscopicity, and Morphology, J. Phys. Chem. A, 2007, 111, 6285–6295 CrossRef CAS PubMed.
- G. Zeng, S. Holladay, D. Langlois, Y. Zhang and Y. Liu, Kinetics of Heterogeneous Reaction of Ozone with Linoleic Acid and its Dependence on Temperature, Physical State, RH, and Ozone Concentration, J. Phys. Chem. A, 2013, 117, 1963–1974 CrossRef CAS PubMed.
- X. He, C. Leng, S. Pang and Y. Zhang, Kinetics study of heterogeneous reactions of ozone with unsaturated fatty acid single droplets using micro-FTIR spectroscopy, RSC Adv., 2017, 7, 3204–3213 RSC.
- Y. Chu, T. F. Cheng, M. Gen, C. K. Chan, A. K. Y. Lee and M. N. Chan, Effect of Ozone Concentration and Relative Humidity on the Heterogeneous Oxidation of Linoleic Acid Particles by Ozone: An Insight into the Interchangeability of Ozone Concentration and Time, ACS Earth Space Chem., 2019, 3, 779–788 CrossRef CAS.
- R. T. Holman and O. C. Elmer, The rates of oxidation of unsaturated fatty acids and esters, J. Am. Oil Chem. Soc., 1947, 24, 127–129 CrossRef CAS.
- B. D. Goldstein, O. J. Balchum, H. B. Demopoulos and P. S. Duke, Electron Paramagnetic Resonance Spectroscopy, Arch. Environ. Health, 1968, 17, 46–49 CrossRef CAS PubMed.
- F. D. Gunstone, Reaction of oxygen and unsaturated fatty acids, J. Am. Oil Chem. Soc., 1984, 61, 441–447 CrossRef CAS.
- W. A. Pryor, Mechanisms of radical formation from reactions of ozone with target molecules in the lung, Free Radicals Biol. Med., 1994, 17, 451–465 CrossRef CAS PubMed.
- N. A. Porter, S. E. Caldwell and K. A. Mills, Mechanisms of free radical oxidation of unsaturated lipids, Lipids, 1995, 30, 277–290 CrossRef CAS PubMed.
- E. N. Frankel, Lipid Oxidation, Elsevier, 2012, pp. 25–50 Search PubMed.
- U. K. Krieger, C. Marcolli and J. P. Reid, Exploring the complexity of aerosol particle properties and processes using single particle techniques, Chem. Soc. Rev., 2012, 41, 6631–6662 RSC.
- A. W. Birdsall, U. K. Krieger and F. N. Keutsch, Electrodynamic balance–mass spectrometry of single particles as a new platform for atmospheric chemistry research, Atmos. Meas. Tech., 2018, 11, 33–47 CrossRef CAS.
- A. W. Birdsall, J. C. Hensley, P. S. Kotowitz, A. J. Huisman and F. N. Keutsch, Single-particle experiments measuring humidity and inorganic salt effects on gas-particle partitioning of butenedial, Atmos. Chem. Phys., 2019, 19, 14195–14209 CrossRef CAS.
- R. K. Kohli and J. F. Davies, Measuring the Chemical Evolution of Levitated Particles: A Study on the Evaporation of Multicomponent Organic Aerosol, Anal. Chem., 2021, 93, 12472–12479 CrossRef CAS PubMed.
- R. Kaur Kohli, G. J. Van Berkel and J. F. Davies, An Open Port Sampling Interface for the Chemical Characterization of Levitated Microparticles, Anal. Chem., 2022, 94, 3441–3445 CrossRef CAS PubMed.
- R. Kaur Kohli and J. F. Davies, Paper spray mass spectrometry for the analysis of picoliter droplets, Analyst, 2020, 145, 2639–2648 RSC.
- M. D. Willis, G. Rovelli and K. R. Wilson, Combining Mass Spectrometry of Picoliter Samples with a Multicompartment Electrodynamic Trap for Probing the Chemistry of Droplet Arrays, Anal. Chem., 2020, 92, 11943–11952 CrossRef CAS PubMed.
- M. I. Jacobs, J. F. Davies, L. Lee, R. D. Davis, F. Houle and K. R. Wilson, Exploring Chemistry in Microcompartments Using Guided Droplet Collisions in a Branched Quadrupole Trap Coupled to a Single Droplet, Paper Spray Mass Spectrometer, Anal. Chem., 2017, 89, 12511–12519 CrossRef CAS PubMed.
- M. D. Willis and K. R. Wilson, Coupled Interfacial and Bulk Kinetics Govern the Timescales of Multiphase Ozonolysis Reactions, J. Phys. Chem. A, 2022, 126, 4991–5010 CrossRef CAS PubMed.
- J. C. Hensley, A. W. Birdsall and F. N. Keutsch, Competition of Partitioning and Reaction Controls Brown Carbon Formation from Butenedial in Particles, Environ. Sci. Technol., 2021, 55, 11549–11556 CrossRef CAS PubMed.
- J. C. Hensley, A. W. Birdsall, G. Valtierra, J. L. Cox and F. N. Keutsch, Revisiting the reaction of dicarbonyls in aerosol proxy solutions containing ammonia: the case of butenedial, Atmos. Chem. Phys., 2021, 21, 8809–8821 CrossRef CAS.
- M. Müller, A. Mishra, T. Berkemeier, E. Hausammann, T. Peter and U. K. Krieger, Electrodynamic balance–mass spectrometry reveals impact of oxidant concentration on product composition in the ozonolysis of oleic acid, Phys. Chem. Chem. Phys., 2022, 24, 27086–27104 RSC.
- P. Laven, Simulation of rainbows, coronas, and glories by use of Mie theory, Appl. Opt., 2003, 42, 436 CrossRef PubMed.
- E. J. Davis and R. Periasamy, Light-Scattering and Aerodynamic Size Measurements for Homogeneous and Inhomogeneous Microspheres, Langmuir, 1985, 1, 373–379 CrossRef CAS.
- M. M. Nudnova, L. Zhu and R. Zenobi, Active capillary plasma source for ambient mass spectrometry, Rapid Commun. Mass Spectrom., 2012, 26, 1447–1452 CrossRef CAS PubMed.
- J.-C. Wolf, L. Gyr, M. F. Mirabelli, M. Schaer, P. Siegenthaler and R. Zenobi, A Radical-Mediated Pathway for the Formation of [M + H]+ in Dielectric Barrier Discharge Ionization, J. Am. Soc. Mass Spectrom., 2016, 27, 1468–1475 CrossRef CAS PubMed.
- L. Gyr, F. D. Klute, J. Franzke and R. Zenobi, Characterization of a Nitrogen-Based Dielectric Barrier Discharge Ionization Source for Mass Spectrometry Reveals Factors Important for Soft Ionization, Anal. Chem., 2019, 91, 6865–6871 CrossRef CAS PubMed.
- V. F. McNeill, R. L. Yatavelli, J. A. Thornton, C. B. Stipe and O. Landgrebe, Heterogeneous OH oxidation of palmitic acid in single component and internally mixed aerosol particles: vaporization and the role of particle phase, Atmos. Chem. Phys., 2008, 8, 5465–5476 CrossRef CAS.
- L. H. Renbaum and G. D. Smith, Artifacts in measuring aerosol uptake kinetics: the roles of time, concentration and adsorption, Atmos. Chem. Phys., 2011, 11, 6881–6893 CrossRef CAS.
- C. L. Liu, J. D. Smith, D. L. Che, M. Ahmed, S. R. Leone and K. R. Wilson, The direct observation of secondary radical chain chemistry in the heterogeneous reaction of chlorine atoms with submicron squalane droplets, Phys. Chem. Chem. Phys., 2011, 13, 8993–9007 RSC.
- J. Zahardis, Photoelectron resonance capture ionization-aerosol mass spectrometry of the ozonolysis products of oleic acid particles: direct measure of higher molecular weight oxygenates, J. Geophys. Res.: Atmos., 2005, 110, D08307 CrossRef.
- P. J. Ziemann, Aerosol products, mechanisms, and kinetics of heterogeneous reactions of ozone with oleic acid in pure and mixed particles, Faraday Discuss., 2005, 130, 469–490 RSC.
- M. Wang, L. Yao, J. Zheng, X. Wang, J. Chen, X. Yang, D. R. Worsnop, N. M. Donahue and L. Wang, Reactions of Atmospheric Particulate Stabilized Criegee Intermediates Lead to High-Molecular-Weight Aerosol Components, Environ. Sci. Technol., 2016, 50, 5702–5710 CrossRef CAS PubMed.
- O. Vesna, M. Sax, M. Kalberer, A. Gaschen and M. Ammann, Product study of oleic acid ozonolysis as function of humidity, Atmos. Environ., 2009, 43, 3662–3669 CrossRef CAS.
- S. S. Al-Kindi, F. D. Pope, D. C. Beddows, W. J. Bloss and R. M. Harrison, Size-dependent chemical ageing of oleic acid aerosol under dry and humidified conditions, Atmos. Chem. Phys., 2016, 16, 15561–15579 CrossRef.
- P. J. Gallimore, P. T. Griffiths, F. D. Pope, J. P. Reid and M. Kalberer, Comprehensive modeling study of ozonolysis of oleic acid aerosol based on real-time, online measurements of aerosol composition, J. Geophys. Res.: Atmos., 2017, 122, 4364–4377 CrossRef CAS.
- X. Gao, C. Leng, G. Zeng, D. Fu, Y. Zhang and Y. Liu, Ozone initiated heterogeneous oxidation of unsaturated carboxylic acids by ATR-FTIR spectroscopy, Spectrochim. Acta, Part A, 2019, 214, 177–183 CrossRef CAS PubMed.
- W. A. Pryor, J. P. Stanley, E. Blair and G. B. Cullen, Autoxidation of Polyunsaturated Fatty Acids, Arch. Environ. Health, 1976, 31, 201–210 CrossRef CAS PubMed.
- E. N. Frankel, Lipid Oxidation, Elsevier, 2012, pp. 15–24 Search PubMed.
- J. H. Kroll, N. M. Donahue, V. J. Cee, K. L. Demerjian and J. G. Anderson, Gas-Phase Ozonolysis of Alkenes: Formation of OH from Anti Carbonyl Oxides, J. Am. Chem. Soc., 2002, 124, 8518–8519 CrossRef CAS PubMed.
- F. Herrmann, R. Winterhalter, G. K. Moortgat and J. Williams, Hydroxyl radical (OH) yields from the ozonolysis of both double bonds for five monoterpenes, Atmos. Environ., 2010, 44, 3458–3464 CrossRef CAS.
- M. Zeng, N. Heine and K. R. Wilson, Evidence that Criegee intermediates drive autoxidation in unsaturated lipids, Proc. Natl. Acad. Sci. U. S. A., 2020, 117, 4486–4490 CrossRef CAS PubMed.
- E. N. Frankel, W. E. Neff and E. Selke, Analysis of autoxidized fats by gas chromatography-mass spectrometry: VII. Volatile thermal decomposition products of pure hydroperoxides from autoxidized and photosensitized oxidized methyl oleate, linoleate and linolenate, Lipids, 1981, 16, 279–285 CrossRef CAS.
| This journal is © The Royal Society of Chemistry 2023 |


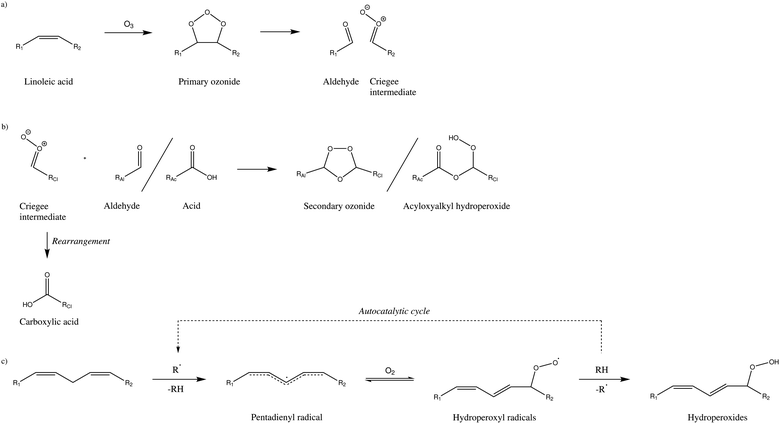
![[double bond, length as m-dash]](https://www.rsc.org/images/entities/char_e001.gif) C carbon centres, whereas autoxidation chemistry (c) retains double bonds while introducing oxygen at the expense of the bis-allylic hydrogen atom. Only one
C carbon centres, whereas autoxidation chemistry (c) retains double bonds while introducing oxygen at the expense of the bis-allylic hydrogen atom. Only one 