 Open Access Article
Creative Commons Attribution 3.0 Unported Licence
Trade-offs between Sustainable Development Goals in carbon capture and utilisation†
Iasonas
Ioannou
 a,
Ángel
Galán-Martín
 bc,
Javier
Pérez-Ramírez
 *a and
Gonzalo
Guillén-Gosálbez
 *a
*a
aInstitute for Chemical and Bioengineering, Department of Chemistry and Applied Biosciences, ETH Zürich, Vladimir-Prelog-Weg 1, 8093 Zürich, Switzerland. E-mail: jpr@chem.ethz.ch; gonzalo.guillen.gosalbez@chem.ethz.ch
bDepartment of Chemical, Environmental and Materials Engineering, Universidad de Jaén, Campus Las Lagunillas s/n, 23071 Jaén, Spain
cCenter for Advanced Studies in Earth Sciences, Energy and Environment. Universidad de Jaén, Campus Las Lagunillas s/n, 23071 Jaén, Spain
First published on 31st August 2022
Abstract
Carbon capture and utilisation (CCU) provides an appealing framework to turn carbon emissions into valuable fuels and chemicals. However, given the vast energy required to activate the CO2 molecule, CCU may have implications on sustainable development that are still poorly understood due to the narrow scope of current carbon footprint-oriented assessments lacking absolute sustainability thresholds. To bridge this gap, we developed a power-chemicals nexus model to look into the future and understand how we could produce 22 net-zero bulk chemicals of crucial importance in a sustainable manner by integrating fossil, CCU routes and power technologies, often assessed separately. We evaluated the environmental performance of these technologies in terms of their contribution to 5 Sustainable Development Goals (SDGs), using 16 life cycle assessment metrics and 9 planetary boundaries (PB) to quantify and interpret the impact values. We found that fossil chemicals could hamper the attainment of SDG 3 on good health and well-being and SDG 13 on climate change. CCU could help meet SDG 13 but would damage other SDGs due to burden-shifting to human health, water scarcity, and minerals and metals depletion impacts. The collateral damage could be mitigated by judiciously combining fossil and CCU routes with carbon-negative power sources guided by optimisation models incorporating SDGs-based performance criteria explicitly. Our work highlights the importance of embracing the SDGs in technology development to sensibly support the low-carbon energy and chemicals transition.
Broader contextCombatting climate change is currently driving sustainable technology development. However, emerging technologies, like carbon capture and utilisation (CCU), may have substantial repercussions on our socio-economic systems and the environment beyond global warming. In 2015, the United Nations put forward 17 Sustainable Development Goals (SDGs) to measure the progress made towards sustainable development. These goals are often evaluated at the national level, while studies applying them to the assessment of emerging low-carbon technologies are very scarce and often qualitative. Here we apply for the first time the SDGs framework to quantitatively evaluate the broad implications of transforming CO2 into key chemicals on sustainable development, elucidating whether efforts to meet the climate action SDG 13 could hamper other SDGs due to burden-shifting. Our large-scale analysis of CCU, which explicitly models the power-chemicals nexus and uses 9 PBs to contextualise the SDGs performance, underscores the importance of evaluating impacts beyond SDG 13 on climate action to avoid myopic solutions eroding our ability to live sustainably. Overall, this study unfolds new avenues to include SDG-based metrics in quantitative assessments in science and engineering while quantifying the potential collateral damage of CCU on sustainable development. |
Introduction
The United Nations (UN) introduced in 2015 the 2030 Agenda for Sustainable Development, which reflects the collective views of a desirable future and addresses the main challenges humanity faces. These include ending poverty and other deprivations, improving health and education, reducing inequality, and spurring economic growth, all this while combatting climate change and preserving our ecosystems. The Agenda, supported by the 193 UN member states, covers 17 Sustainable Development Goals (SDGs), 169 internationally agreed targets and 232 indicators,1 among which climate change and biodiversity loss are attracting growing attention.2Technology development for sustainable energy and chemicals provision currently focuses primarily on combatting climate change, which falls within the realm of SDG 13 (climate change action). Accordingly, emerging technologies are often only assessed in terms of their carbon footprint, quantified following life cycle assessment principles (LCA).3–6 These widespread LCA studies omit impacts beyond climate change or evaluate them via indicators that lack impact thresholds, making them hardly interpretable from a global sustainability viewpoint.3,7,8 Consequently, the extent to which future low-carbon technological roadmaps improving SDG 13 could contribute to other dimensions of sustainable development remains unclear because their performance in other SDGs, often evaluated at the national rather than at the technological level,9,10 is overlooked.
Here we argue that SDGs-based assessments of emerging technologies are critical to avoid low-carbon pathways shifting burdens across sustainability dimensions. With this spirit, we focus on studying the broad implications of carbon capture and utilisation (CCU) – a growing trend in low-carbon fuels and chemicals production – on the SDGs attainment. CCU could help curb emissions while creating economic value,11 yet its vast energy requirements are today a major obstacle.12 Notably, the increase in energy demand will require skilled labour for the installation and operation of the power system,13,14 which will impact SDG 4 (quality education) and 8 (decent work and economic growth), respectively. Substantial ongoing research focuses on electro- and thermocatalytic routes converting CO2 into a range of chemicals and fuels, including methanol, formic acid, and ethylene, among others.15 Extensive literature evaluated CCU routes focusing on single technologies or a small subset of them,15–18 omitting their links with the power mix and applying conventional LCA metrics limited in scope, e.g., carbon footprint and fossil resources depletion.7,19,20 However, recent qualitative studies highlighting trade-offs between SDGs in CCU,21 also found in food22 and energy23 systems, and micro-plastics,24 stress the importance of measuring the potential undesired adverse effects of CCU on the SDGs attainment, as we do here.
Until recently, the lack of suitable metrics prevented the use of SDGs in technology-oriented assessments. However, the recent concept of absolute sustainability,25 which allows incorporating the planet's carrying capacity into LCA-based PBs indicators, has unfolded new avenues to perform PBs-SDGs studies26 of emerging technologies. Notably, LCA approaches based on absolute sustainability have started to emerge in past years,27,28 most of them building on the works by Rockstrom et al. (2009)29 and Steffen et al. (2015),30 who defined 9 planetary boundaries (PBs) for humanity to operate the planet safely. These LCA-PB-based assessments provide a reference to interpret the system's performance considering the Earth's carrying capacity,31 which allows contextualising the LCA results from an absolute sustainability and SDGs perspective. Along these lines, Sala et al.25 introduced an LCA-PB-based assessment that combines the Environmental Footprint (EF) LCA method adopted at the EU level32 and the updated LANCA model33,34 with the SDGs framework. This approach essentially mapped 16 LCA impact categories to 5 SDGs and 9 PBs, incorporating absolute sustainability concepts in decision-making. Despite these advances, to our best knowledge, SDG-based methods were never applied to assess low-carbon technologies, including CCU.
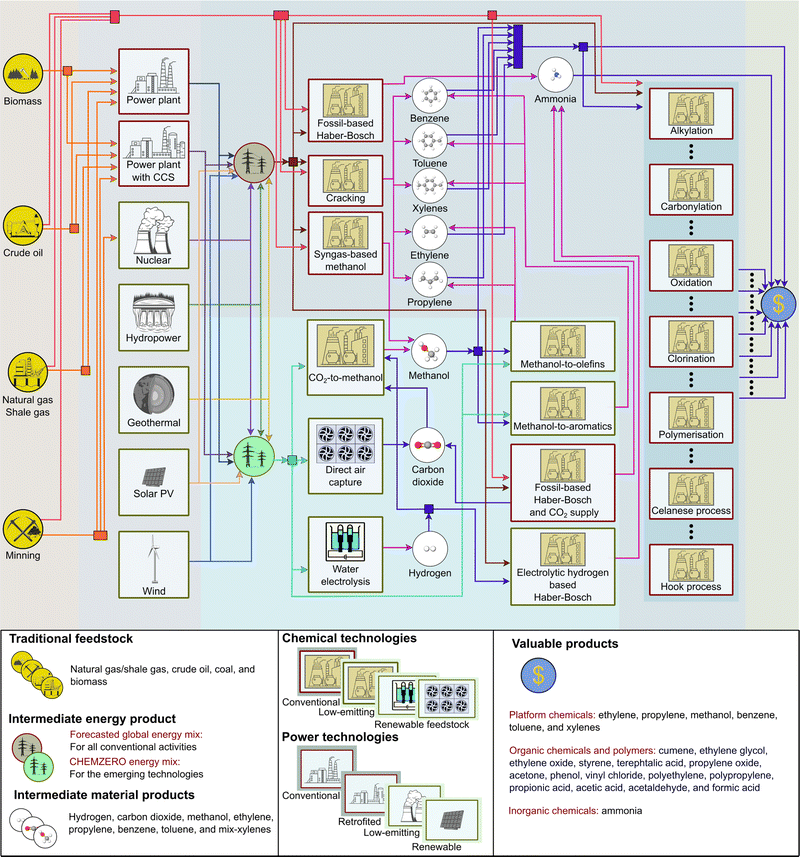
Here we capitalise on absolute sustainability methods to expand our limited knowledge of how deploying CCU on a large scale could affect the attainment of SDG 8 and a set of 5 SDGs that can be directly linked to the system's economic and environmental performance, respectively. For this purpose, we built a model of the future chemical industry integrating fossil and CCU routes (Fig. 1) with a tailored power mix to identify carbon-neutral roadmaps according to different criteria and constraints (related to several SDGs) to minimise the system's (i) total cost or (ii) overall transgression level. We found that cost-effective CCU solutions to attain carbon neutrality in 2050 could hamper our ability to meet several SDGs. However, this collateral damage could be mitigated by judiciously combining fossil and renewable-carbon technologies to maximise the SDGs performance. Overall, our analysis highlights the need to incorporate the SDGs into decision-making for technology development and meet SDG 13 on climate change in a more sustainable way.
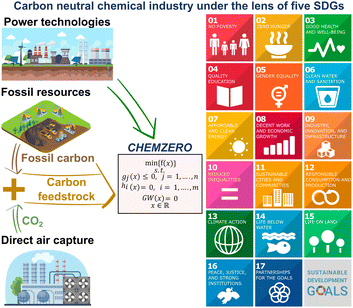 | ||
| Fig. 1 CHEMZERO identifies optimal low-carbon roadmaps for the chemical industry by integrating power and chemical production technologies. The model includes the LCA impact categories of the Environmental Footprint (EF) method, which are connected to 5 SDGs and 9 PBs via an LCA-based PBs-SDGs approach.25 The LCA-based PBs-SDGs method considers 5 SDGs, SDG 3 (good health and well-being), 6 (clean water and sanitation), and 13–15 (climate action, life below water, and life on land, respectively). These SDGs are closely linked to standard LCA indicators, as opposed to others with weaker links to engineering decisions and inherently more qualitative. | ||
Materials and methods
To carry out our analysis, we developed a network model capturing the interplay between the chemical and power sectors, named CHEMZERO, that identifies carbon-neutral (on a cradle-to-gate basis, that is, from raw materials acquisition to chemicals production, omitting the end-use phase) pathways for chemicals production optimising either the cost or a transgression performance metric connected to the SDGs, CHEMZEROcost and CHEMZEROsust, respectively. Notably, unlike other models that omit the power-chemicals nexus,7CHEMZERO jointly optimises power and chemical production technologies to satisfy the future demand of 22 major chemicals in 2050, representing most of the chemical industry's energy demand and GHG emissions.35 Hence, the model automatically identifies the main conversion pathways from a set of available technologies in order to optimise given criteria while not violating a set of technical and market-related constraints. The model and LCA calculations are outlined next, while further details are available in the ESI.†Network modelling and mathematical optimisation
CHEMZERO satisfies the chemicals demand by selecting (i) conventional fossil pathways, (ii) CCU technologies, or (iii) a combination of both (simplified superstructure in Fig. 2), all of them regarded as mature technologies with high technology readiness levels (TRL ≥ 7). CCU technologies convert CO2 and electrolytic hydrogen (eH2) into green methanol (MeOH), which is subsequently processed into other chemicals through the methanol-to-olefins and -aromatics routes (MTO and MTA, respectively). We also consider three Haber–Bosch (HB) configurations for producing ammonia, e.g., (i) the conventional HB using natural gas (NG) steam reforming (SR-HB); (ii) SR-HB coupled with CCU to capture and utilise the CO2 emitted by SMR H2 (SR-HB-CCU); and (iii) eH2 based HB (known as green HB), which replaces the SMR H2 by electrolytic H2 (eHB). The mass and energy balances defined for the above technologies, among which the model will identify the optimal ones according to some criteria, are based on information from process simulations, databases,36 and other literature sources (see Section S1.2 of the ESI† for more details).The CO2 raw material for CCU can be sourced from SR-HB37,38 (at 25.0 $ t−1) using a CO2 stream often consumed in urea production,39 or from direct air capture (DAC) by implementing Climeworks’ technology projected to 2050.40 Furthermore, CHEMZERO concurrently optimises the power mix linked to the chemical system following previous work by some of us.41 The bespoke energy system, which powers the eH2, DAC, MeOH, MTO, and MTA, includes both (i) state-of-the-art power technologies and (ii) combined heat and power (CHP) facilities. The system's energy availability is ensured by balancing both intermittent and firm technologies.42
Producing eH2 requires substantial resources, e.g., minerals and metals, which might become scarce,43 constraining the technologies’ potential and deployment. Hence, our model constrains the gradual deployment of power technologies using diffusion rates to capture exogenous factors limiting the speed of deployment (e.g., market forces or social acceptance barriers) and considers resource availability constraints (related to SDG 7). The power technologies considered include oil, coal, natural gas, and bioenergy with and without carbon capture and storage (BECCS), wind (onshore and offshore), solar (photovoltaic, PV), geothermal, nuclear, and hydropower reservoirs. We provide in Section S1.2 of the ESI† information further details on the latter generation technologies. BECCS, alone or integrated with CHP,44 can deliver carbon-negative electricity but requires geological storage capacity to store the CO2 permanently. Furthermore, we assume that CHP plants could satisfy the heat demand (i.e., steam) of the industrial processes and DAC, while purge streams from MeOH production could provide extra heat,17,45 diminishing the natural gas requirements (aligned with SDG 12).
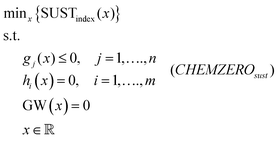
CHEMZERO is formulated as a linear programming (LP) model that seeks pathways towards carbon neutrality subject to various technical, costs and impact-related constraints (eqn (1)). Hence, the model reflects the ambition of making the chemical industry carbon-neutral by the first half of the 21st century, as supported by the European Chemical Industry Council.46 This overall goal could be met at minimum cost by solving the model below.
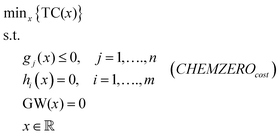 | (1) |
 | (2) |
Life cycle assessment
We apply the LCA methodology following the ISO 14040 and 14044 standards47,48 to ultimately measure the performance of the chemical technologies in 5 SDGs, as described next.Goal and scope definition
We quantify the impact of the chemical system relative to 9 PBs connected to 5 SDGs, considering as the functional unit the global demand for chemicals in 2050 (see ESI†). We adopt a cradle-to-gate scope where the system boundaries encompass the water splitting, MeOH, MTO, MTA, and DAC processes, the facilities further transforming the platform chemicals, and the surrounding activities supplying inputs to the foreground system (i.e., background system), including the power system covering its energy needs.Life-cycle inventory
The life cycle inventories are obtained by combining data of the (i) foreground system (i.e., energy mix, water splitting, DAC, and chemical technologies) and (ii) background system. Type (i) data are modelled using ecoinvent v3.536 complemented with literature data, i.e., water-splitting membrane,49 DAC,40 HB processes,49 and MeOH,17 MTO,50 and MTA51 facilities. In contrast, all flows of type (ii) are retrieved from ecoinvent v3.536 accessed via SimaPro version 9.1.0.11.Life cycle impact assessment
We quantify 16 LCA indicators via the LCA method EF 2.0, recommended by the European Commission (2013/179/EU),32 while evaluating the land use indicator using the LANCA method.33,34 Following Sala et al.,25 the 16 LCA indicators were mapped to 5 SDGs (i.e., 3, 6, 13–15) using 9 PBs to evaluate the severity of the impact. As discussed next, this severity is given by the ratio between the impact value and the maximum allowable impact dictated by the PBs.SDGs performance: the LCA-PBs-based objective function
We define an aggregated sustainability index based on the transgression level in each LCA indicator, where all indicators are given equal weights, as follows: | (3) |
 | (4) |
To draw meaningful conclusions, we study both the aggregated indicator SUSTindex and the transgression level in each individual metric, taking the Earth's carrying capacity as a reference to interpret the results from an absolute sustainability viewpoint. As discussed later, these transgression levels are employed as a proxy for SDGs performance.
Avoidance cost
CCU routes are often economically unappealing compared to their fossil-based counterparts. However, taxation on greenhouse gas (GHG) emissions could make them competitive. To explore the economic feasibility of mitigating climate change via CCU, we compute the avoidance cost (AC) of each solution as follows: | (5) |
 | (6) |
Results and discussion
We first discuss the impact of the model solutions on the SDGs attainment, then describe their technological features, and finally study their financial implications. In evaluating the impact values on the SDGs, we consider the PBs as a reference. Hence, high transgression levels, e.g., >10% (reference value discussed in the ESI†), would make it very challenging for the global economy as a whole to operate within the total ecological budget due to the high impact of the chemicals considered here. We note that some PB values can be controversial due to unclear ecosystem responses, global aggregate values, or knowledge gaps.29,52 Therefore, when interpreting the results, we pay special attention to identifying general patterns and trends and understanding the main differences across scenarios. At the same time, we consider the LCA indicators' quality level, as recommended by the European Commission's Joint Research Centre (see Fig. 3 labels and Section S1.4 of the ESI†).53,54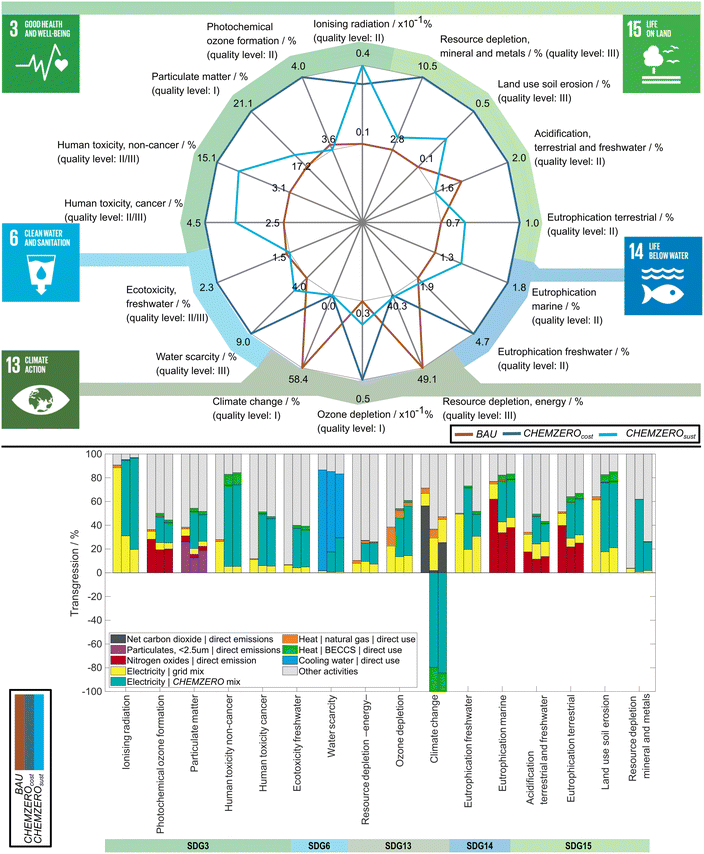 | ||
| Fig. 3 Transgression of the total safe operating space (SOS, i.e., maximum limit defined on the LCA metrics) for the BAU (brown area), CHEMZEROcost (blue area) and CHEMZEROsust (cyan area) solutions (top), and breakdown of impacts for the latter systems (bottom). The mapping of the LCA indicators and the SDGs of human health (SDG 3), clean water and sanitation (SDG 6), climate change (SDG 13), life below water (SDG 14), and life on land (SDG 15) is based on the work by Sala et al.25 Furthermore, the environmental breakdown is presented based on 9 contributors, namely (1) net CO2 emissions, (2) particulate matter (<2.5 μm) emissions, (3) nitrogen oxides emissions – where (1), (2), and (3) are emitted directly in the chemical processes – (4) grid electricity – consumed directly in the conventional chemical processes – (5) electricity from the CHEMZERO mix, mainly to generate eH2, (6) heat from natural gas, (7) heat from BECCS – both (6) and (7) are consumed directly in the chemical processes and DAC – (8) cooling water – consumed directly in the chemical processes – and (9) other activities, which include inputs of fossil-based resources (or inputs of other nature), and direct emissions to air and water that are not covered in the previously mentioned categories. The environmental impacts are classified according to their quality level as recommended by the European Commission's Joint Research Centre.53,54 | ||
Burden-shifting across SDGs
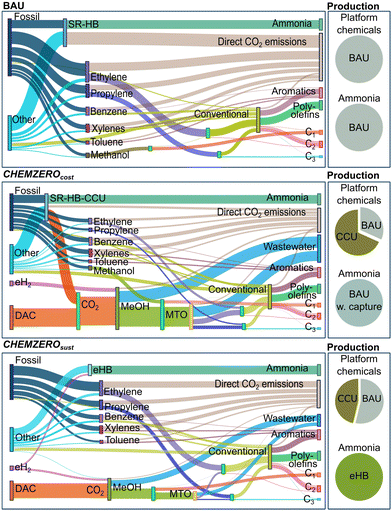
We start by studying the current fossil-based BAU chemical industry and whether CCU pathways would cause any collateral damage when attempting to curb carbon emissions. Focusing on the BAU (Fig. 3 – top – brown area), we find that using only fossil carbon as feedstock in chemicals production (Fig. 4) clearly hampers attaining SDGs 3 and 13. This is because fossil chemicals occupy a large percentage of the SOS in the climate change and resource depletion – energy – indicators, both linked to SDG 13. Here, we note that the quantification of the climate change metric has a low uncertainty level (quality level I), while the level of uncertainty in energy depletion is high (quality level III). Notably, the BAU solution consumes 58.4% of the maximum global allowable impact in climate change because it emits 4.0 GtCO2eq year−1 on a life cycle basis while the PB equals 6.8 GtCO2eq,25 leaving little room for the other sectors to operate within this limit. This impact is followed by 49.1% in energy resource depletion (SDG 13) and 17.2% in particulate matter (quality level I), linked to SDG 3. The overall average transgression across all metrics, SUSTindex, is 9.2.Moving to the CCU routes, we find that CHEMZEROcost improves the climate change metric and the aggregated index greatly (SUSTindex = 7.3), yet, it leads to significant burden-shifting. Notably, this solution worsens 14 out of the 16 LCA indicators (Fig. 3 – top – blue area), some of them quite substantially, which highlights the perils of myopic cost-effective climate change mitigation strategies. Notably, CHEMZEROcost would make it easier to fulfil SDG 13, but still hamper attaining SDG 3 while also exerting significant pressure on SDGs 6 and 15, seemingly non-critical in the BAU solution (<4.0%). Here, the climate change impact would be zero as imposed in the model (GHG neutrality). However, because this solution would consume fossil resources and a high amount of energy, it would still show a significant transgression in resource depletion – energy – (40.3%). Arguably, this should not be of concern, as CCU and carbon-negative electricity would offset (on a cradle-to-gate basis) the carbon emissions linked to fossil resources usage, as discussed later, while the environmental damage is 17.9% lower than the BAU. This transgression level is followed by particulate matter (21.1%, quality level I), non-cancer human health effects (15.1%, quality level II/III – medium-to-high uncertainty), both linked to SDG 3, resource depletion – mineral and metals – (10.5%, quality level III), related to SDG 15, and water scarcity (9.0%, quality level III), connected to SDG 6.
The CHEMZEROsust solution (Fig. 3 – top – cyan area) alleviates the collateral damage substantially, improving CHEMZEROcost in 13 indicators simultaneously, attaining the best SUSTindex (5.9 vs. 7.3 and 9.2); however, it outperforms the BAU in only 5 metrics. SDGs 6 and 15 would become much less critical in this solution due to the improvements in resource depletion – mineral and metals – (4.1% vs. 10.5%, quality level III), and water scarcity (5.1% vs. 9.0%, quality level III), but meeting SDGs 3 would still be challenging due to its high non-cancer human toxicity (quality level II/III) and particulate matter (quality level I) impact (11.5% and 18.1%, respectively).
The impact breakdown (Fig. 3 – bottom) reveals that many damage categories worsen when deploying CCU because of its large energy requirements. While both CCU solutions consume vast amounts of power, CHEMZEROsust often outperforms CHEMZEROcost due its lower energy consumption, the shift from onshore to offshore wind turbines, and the avoidance of solar panels (Fig. 5, further details on the power mix impacts in Table S7 and Fig. S1 of the ESI†). Focusing on the individual SDGs, particulate matter (SDG 3), critical in all the solutions, is linked in the BAU to the lumped term other activities, followed by the direct release of particulates – below 2 μm – and NOx from the chemical processes and power and heat consumption. In the alternative CCU solutions, the contribution of the power mix is also very significant. The latter causes most of the impact in the human toxicity non-cancer category, which is particularly severe in the CHEMZEROcost solution. Water scarcity (SDG 6), mostly linked to the evaporation losses from the cooling towers in the BAU, worsens in the alternative solutions due to the additional MeOH plants requiring substantial cooling and the hydropower facilities in the power system (Fig. 3, 4 and Fig. S1, ESI†). Climate change (SDG 13) is mostly linked to direct fossil CO2 emissions and power and heat supply in the BAU, while these emissions are offset in the carbon-neutral solutions by consuming DAC CO2 and carbon-negative electricity and heat. Finally, resource depletion – mineral and metals – (SDG 15) worsens in the CCU solutions due, again, to the contribution of the bespoke mix (Table S7, ESI†).
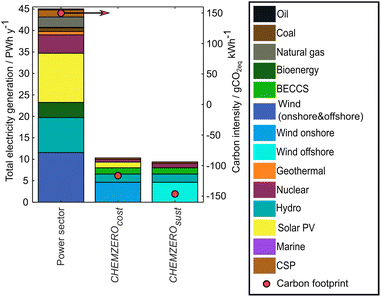 | ||
| Fig. 5 Annual power generation and breakdown for the global anthropogenic activities in 2050, as forecasted in the world energy outlook,38 and power generation from the bespoke mixes of the CHEMZEROcost and CHEMZEROsust (primary axis) their respective carbon footprint (secondary axis). | ||
Hybridisation of fossil and CO2-based chemical routes
To attain carbon neutrality, the CCU roadmaps in CHEMZEROcost and CHEMZEROsust integrate fossil and renewable-carbon-based technologies, exploiting synergies between them. Both solutions differ substantially in the shares of fossil and CCU chemicals, the ammonia process configuration, and the CO2 provenance (Fig. 4).The BAU solution produces ammonia via SR-HB, and the platform chemicals (ethylene, propylene, benzene, toluene, and xylenes) through cracking, subsequently transforming them into 15 chemicals via conventional routes. In contrast, CHEMZEROcost uses CO2 captured in the Haber–Bosch plants and from the air (0.6 and 1.2 GtCO2, respectively) to produce green MeOH and convert it into olefins via MTO. This solution increases the annual production of methanol by 6.7-fold relative to the BAU, where the majority is produced from the green MeOH process. MTO plants convert most of this methanol into ethylene and propylene, whose demand is mainly covered by the methanolic route (∼70%). Conversely, aromatics are entirely produced via fossil-based cracking since the MTA process is not selected. 231.7 Mt of eH2 are consumed exclusively for green methanol synthesis, and a significant amount of it is lost in the MeOH and MTO processes due to the wastewater by-product.
CHEMZERO sust makes less use of CCU and deploys the green HB process. This solution substantially reduces the amount of methanol produced (from 1433.0 to 636.9 Mt) and the capacity of the MTO process, fully operated with green MeOH. It generates most of the ethylene and propylene from fossil carbon (>75%) and produces all the ammonia via the green HB process, avoiding the CO2 by-product and consuming 43.7% of the 215.0 Mt of eH2 (the rest used for green MeOH synthesis). The carbon feedstock is entirely sourced from DAC plants (0.9 Gt), while the MTA process is again omitted. Hence, using carbon-negative electricity for green ammonia synthesis allows attaining carbon neutrality despite increasing the amount of fossil olefins and reducing the DAC capacity. Finally, the quantity of the co-produced wastewater is reduced significantly.
Carbon-negative power to produce carbon-neutral chemicals
Both CCU roadmaps rely on carbon-negative power (Fig. 5) to generate carbon-negative eH2 and offset other carbon emissions, ultimately attaining carbon-neutrality (−1.2 × 10⁻¹ to −1.5 × 10⁻¹ tCO2eq MW h−1, resulting in eH2 and CO2 feedstock with a carbon intensity, respectively, of −4.8 to −6.1 tCO2eq tH2−1 and −0.8 to −1.3 tCO2eq tCO2−1, respectively). Moreover, the minimum cost and transgression level power systems mainly differ in the amount of electricity produced, a shift from onshore to offshore turbines, and the solar and nuclear power capacities (Fig. 5). CCU would require 10.3 and 9.4 PW h of power, respectively, primarily for eH2 production (93.8–95.9%, details in the Fig. S1, ESI†), where BECCS, hydropower – reservoir – nuclear, and geothermal facilities would provide the firm power required to support the significant penetration of intermittent wind and solar. This high electricity consumption represents an additional 22.9–20.8% power relative to the forecasted global generation in 2050.38 In CHEMZEROcost, wind power would show the highest share, followed by hydropower, BECCS, solar PV, nuclear, and geothermal. In contrast, CHEMZEROsust would not rely on solar PV and would almost double nuclear power generation. Moreover, in both systems, BECCS would generate both power (1.4 PWh) and heat (5.0–4.1 EJ), making the energy inputs carbon negative due to the storage of biogenic carbon (Fig. S1, ESI†). In both solutions, DAC would become the primary steam consumer from the BECCS–CHP plants, using 90.6–88.8% of the total carbon-negative steam.CCU mitigation vs. NETs removal for curbing carbon emissions
We finally compare carbon mitigation via CCU against carbon removal via DACCS and BECCS, the most promising negative emissions technologies (NETs). CHEMZEROcost and CHEMZEROsust avoid emitting 4.0 GtCO2eq year−1 in 2050, increasing the chemicals cost by 311.0–620.5 B$2019, respectively (Fig. 6). This amount is comparable to the 2021 Gross Domestic Product (GDP) of Finland or Belgium.55 Hence, both solutions would require subsidies to become competitive.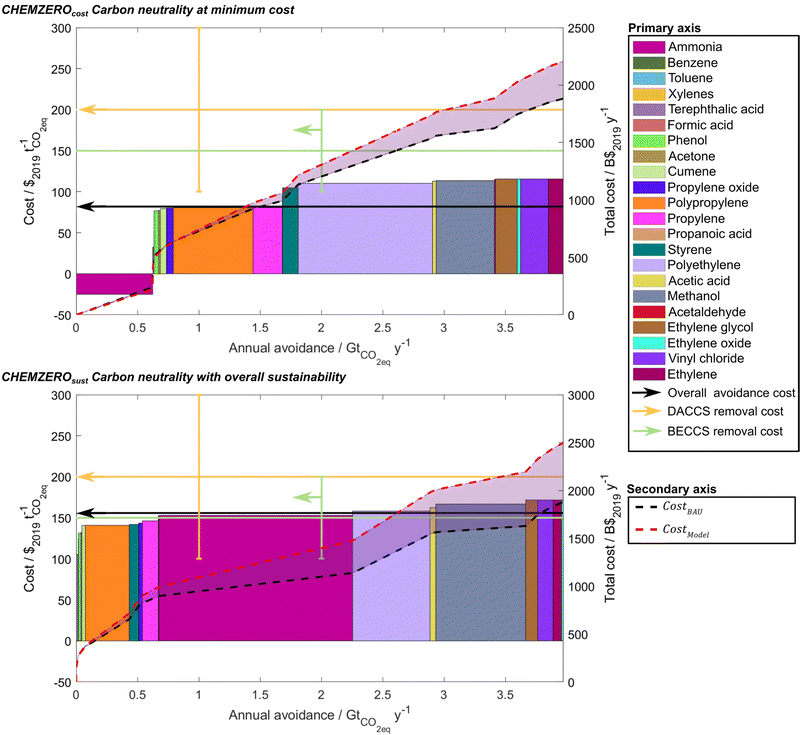 | ||
| Fig. 6 Merit order of chemicals, indicating the CO2 avoidance cost (primary axis) of each chemical (bars) and the total chemical system (black arrow). In addition, we also show the forecasted removal cost, rather than the avoidance cost, for DACCS and BECCS (light orange and green arrow, respectively).57 We further provide the total cost (secondary axis) for the respective solution (red dash line) and the BAU (black dashed line) to meet the 2050's annual avoidance target, equal to 4.0 Gt of CO2eq. The merit order depicts the sequence of the chemical's appeal in the two solutions, replacing the fossil-based pathways entirely, or partially (hybrid), with their renewable alternative to attain a carbon-neutral operation for the chemical system. The avoidance cost is calculated based on eqn (5) and (6). The transition to a carbon-neutral production of the two solutions will require a premium of 16.5 and 33.0% for the CHEMZEROcost and CHEMZEROsust solution, respectively, which can be translated in terms of a CO2 avoidance cost that ranges between 81.9–155.9 $ tCO2eq−1. Benzene, toluene, and xylenes are not represented since the cracking process is not substituted in any of the two solutions. | ||
This cost is mainly linked to the high energy requirements and the levelised cost of electricity of the carbon-negative energy system covering primarily the eH2 needs (58.4–90.1 $ MW h−1, resulting in eH2 at 2.6–4.0 $ kgH2−1). Moreover, the CO2 feedstock cost would be 62.5 $ tCO2−1 in CHEMZEROcost, which is comparable to the current capture costs in coal and natural gas plants (36–53 and 48–111 $ tCO2−1, respectively).56 Notably, the required premium results in an avoidance cost of 81.9 $ tCO2eq−1, which is cheaper than the forecasted DACCS and BECCS removal costs (i.e., 100.0–300.0, and 100.0–200.0 $ tCO2−1, respectively).57CHEMZEROsust would increase the CO2 feedstock and avoidance cost to 88.7$ tCO2−1 and 155.9 $ tCO2eq−1, respectively, and thus, still remain competitive against DACCS and BECCS. The merit order plots show that most of the avoidance is associated with chemicals with a very large demand, such as ammonia, methanol and polymers (i.e., >190 Mt year−1). The order of the chemicals in the figure depends on the solution, where the avoidance cost of the chemicals increases when moving from CHEMZEROcost to CHEMZEROsust. Low-carbon ammonia emerges as particularly attractive in CHEMZEROcost, even displaying a negative avoidance cost due to the CO2 feedstock it provides (via SR-HB coupled with CCU). In contrast, it shows a higher avoidance potential in CHEMZEROsust for a significantly higher avoidance cost since it consumes a vast amount of carbon negative eH2.
Analysing the carbon storage capacity required by CCU vs. that of NETs, we find that the BAU directly emits (at the production sites, Fig. 4) 2.2 Gt of CO2 (and 4.0 GtCO2eq on a life cycle basis). In contrast, CHEMZEROcost and CHEMZEROsust directly emit 1.2 and 1.3 Gt year−1 of CO2, respectively, which are essentially compensated by the carbon-negative electricity from BECCS and the DAC CO2, making chemicals carbon neutral from cradle-to-gate. Notably, the CCU solutions would need to store 1.63 GtCO2 year−1 (in CHEMZEROcost) and 1.56 GtCO2 year−1 (in CHEMZEROsust) from BECCS in 2050 to reach carbon neutrality. In contrast, making fossil chemicals carbon neutral from cradle-to-gate via CCS coupled with existing infrastructure or NETs (e.g., DACCS and BECCS) would require at least 4.0 GtCO2 year−1 of geological storage capacity. This value corresponds to the GHG footprint of the fossil chemical system, as shown in Fig. 6.
The chemical sector has been a key driver of economic growth (i.e., 7% of the world GDP in 2019),58 and it remains unclear how the estimated 311.0–620.5 B$2019 year−1 needed to become carbon neutral would affect its performance. Nonetheless, global inaction in climate change mitigation would also require substantial worldwide investments for climate adaptation to the 2 °C of warming, i.e., 140.0–300.0 B$2021 year−1 in 2030 and 280.0–500.0 B$2021 year−1 in 2050.59 From a broader perspective, the UN reported that 265.0 B$2017 year−1 would be required to achieve globally SDGs 1 (no poverty) and 2 (zero hunger) by 2030.60 At the same time, meeting SDG 3 in 67 low- and middle-income countries (representing 95% of this group population) would need 274.0–371.0 B$2014 year−1 of additional health spending.61 Moreover, regarding SDG 5 (gender equality), the cost of a lower female employment rate in 2013 in the EU was estimated to be 370.0 B€2013 (491.0 B$2013),62 accounting for (i) resource and (ii) public finance costs. Hence, the investment for attaining carbon neutrality in the chemical sector, based on the technologies considered here, would be similar to those needed for meeting some SDGs at the global or European level. Notwithstanding this, the chemical sector should drastically reduce its fossil carbon emissions to operate sustainably, more so considering that the safe operating space should be shared among all economic sectors.
Lastly, we repeated the calculations including three additional technologies, less mature but which may play a role in the future power mix, i.e., concentrated solar power, solar photovoltaics integrated with utility-scale battery storage, and wind photovoltaics integrated with utility-scale battery storage (Section S2.6 in ESI†). We found that the results would not vary substantially (≤0.2% change in cost and 2.3–12.9% in transgression, obtaining very similar portfolios). Moreover, we also conducted a sensitivity analysis on key model parameters, identifying the production cost of the chemicals, the levelised cost of electricity, and the water electrolysis efficiency as the most influential parameters, always obtaining similar solutions and insights (Section 2.4 in ESI†). Finally, using price elasticities, we investigated the extent to which the demand of chemicals would drop due to the cost increase in the carbon-neutral designs (Section 2.5 in ESI†). We found that the effect of price elasticities is low, leading to very similar demands. Besides, subsidies on low carbon chemicals would result in lower prices and lower demand changes.
Conclusions and outlook
Here, we assessed how CCU at a large scale could affect our ability to attain the UN SDGs. We found that the current fossil-based chemical industry could hamper the attainment of SDGs 3 and 13 due to its high impact on particulate matter and climate change (Fig. 7). CCU could help meet SDG 13 with a penalty on SDGs 3, 6, 14, and 15 due to the large energy requirements, resulting in high impacts on human toxicity, particulate matter, water scarcity, and minerals and metals depletion. The collateral damage on SDGs 6, 14 and 15 could be reduced by deploying hybrid CCU/fossil roadmaps optimised considering the SDGs. However, the high impact on SDG 3, driven mainly by toxicity and particular matter, would still be of concern, although it could be alleviated using other measures like electrostatic separations and selective non-catalytic reduction.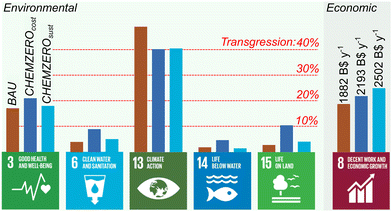 | ||
| Fig. 7 Summary of the SDGs performance of the three solutions. Bars on SDGs 3, 6, 13, 14 and 15 represent the maximum transgression across the LCA indicators within the respective SDG as depicted in Fig. 3 (i.e., considering the thresholds defined for each of them), while the bar on SDG 8 depict the total cost. | ||
Moreover, CCU impacts could be further reduced by lowering the energy requirements. Mechanical and chemical recycling of polymers into monomers (or syngas) could curtail the fossil and renewable-carbon demand for chemicals and, consequently, the electrolytic hydrogen (and energy) needs.63 Additionally, biomass could be used as a source of chemicals, via syngas generation or tailored synthesis routes to, e.g., biopolymers, further decreasing the carbon, hydrogen and energy requirements. Furthermore, improving power technologies like solar panels and windmills by, e.g., optimising their supply chains and recycling existing and alternative construction materials, could further mitigate impacts. Lastly, optimising water consumption and product yields, possibly via direct electro routes with high efficiencies not relying on green methanol as an intermediate, could also further improve the environmental appeal of CCU.
From a technical viewpoint, integrating fossil technologies with CCU, DAC and BECCS seems the way forward to attain carbon neutrality with balanced economic and SDGs performance. DAC and BECCS have not been deployed at scale yet, so early adoption of these technologies will be essential to overcome technical and socio-political barriers.64
Attaining carbon neutrality via CCU will very likely require governments' financial support through subsidies (Fig. 6 and 7). However, under carbon neutrality constraints, CCU might be economically competitive with DACCS and BECCS, with the added advantage of requiring much less geological storage. Although the latter has been estimated at 2082 GtCO2,65 it will have to be shared among all sectors and NETs, creating intense global and regional competition for this limited resource.
Overall, our work highlights the inherent trade-offs between SDGs faced in technology development for sustainable energy and chemicals provision, which reinforces the need to embrace a range of sustainability metrics beyond the global warming impact in current assessments. In this context, LCAs based on the SDGs and PBs concepts provide a comprehensive framework to perform such evaluations and guide research and policy-making more sensibly.
Author contributions
I. I. and G. G.-G. conceived the research. I. I., A. G.-M., J. P.-R., and G. G.-G. designed the study. I. I. developed the model formulation, carried out the analyses, and created the illustrations. I. I. and G. G.-G. wrote the paper. All authors contributed to identifying data, interpreting the results, and revising the manuscript.Conflicts of interest
There are no conflicts to declare.Acknowledgements
This publication was created as part of NCCR Catalysis (grant 180544), a National Centre of Competence in Research funded by the Swiss National Science Foundation. Ángel Galán-Martín thanks the Spanish Ministry of Science, Innovation, and Universities for the financial support through the “Beatriz Galindo” Program (BG20/00074).References
- UN (United Nations), Sustainable development goals, 2015, https://sdgs.un.org/.
- L. Coscieme, L. F. Mortensen and I. Donohue, J. Cleaner Prod., 2021, 296, 126502 CrossRef.
- M. A. N. Thonemann, Appl. Energy, 2020, 263, 114599 CrossRef CAS.
- A. Otto, T. Grube, S. Schiebahn and D. Stolten, Energy Environ. Sci., 2015, 8, 3283–3297 RSC.
- J. C. Abanades, E. S. Rubin, M. Mazzotti and H. J. Herzog, Energy Environ. Sci., 2017, 10, 2491–2499 RSC.
- J. Burre, D. Bongartz, S. Deutz, C. Mebrahtu, O. Osterthun, R. Sun, S. Völker, A. Bardow, J. Klankermayer, R. Palkovits and A. Mitsos, Energy Environ. Sci., 2021, 14, 3686–3699 RSC.
- A. Kätelhön, R. Meys, S. Deutz, S. Suh and A. Bardow, Proc. Natl. Acad. Sci. U. S. A., 2019, 116, 11187–11194 CrossRef.
- N. Meunier, R. Chauvy, S. Mouhoubi, D. Thomas and G. De Weireld, Renewable Energy, 2020, 146, 1192–1203 CrossRef CAS.
- J. Sachs, G. Schmidt-Traub, C. Kroll, G. Lafortune, G. Fuller and F. Woelm, Sustainable Development Report 2020: The Sustainable Development Goals and Covid-19 Includes the SDG Index and Dashboards, Cambridge University Press, 2021 Search PubMed.
- G. Schmidt-Traub, C. Kroll, K. Teksoz, D. Durand-Delacre and J. D. Sachs, Nat. Geosci., 2017, 10, 547–555 CrossRef CAS.
- H. Naims, J. Ind. Ecol., 2020, 24, 1126–1139 CrossRef.
- I. Ioannou, S. C. D’Angelo, Á. Galán-Martín, C. Pozo, J. Pérez-Ramírez and G. Guillén-Gosálbez, React. Chem. Eng., 2021, 6, 1179–1194 RSC.
- J. Heras and M. Martín, Appl. Energy, 2020, 278, 115654 CrossRef.
- M. Martín, Energy, 2016, 114, 833–845 CrossRef.
- P. De Luna, C. Hahn, D. Higgins, S. A. Jaffer, T. F. Jaramillo and E. H. Sargent, Science, 2019, 364, eaav3506 CrossRef CAS PubMed.
- M. Rumayor, A. Dominguez-Ramos and A. Irabien, J. Cleaner Prod., 2019, 225, 426–434 CrossRef CAS.
- A. González-Garay, M. S. Frei, A. Al-Qahtani, C. Mondelli, G. Guillén-Gosálbez and J. Pérez-Ramírez, Energy Environ. Sci., 2019, 12, 3425–3436 RSC.
- K. Roh, A. S. Al-Hunaidy, H. Imran and J. H. Lee, AIChE J., 2019, 65, e16580 CrossRef.
- C. M. Jens, L. Müller, K. Leonhard, A. A. Bardow, L. Müller, K. Leonhard and A. A. Bardow, ACS Sustainable Chem. Eng., 2019, 7, 12270–12280 CAS.
- R. Aldaco, I. Butnar, M. Margallo, J. Laso, M. Rumayor, A. Dominguez-Ramos, A. Irabien and P. E. Dodds, Sci. Total Environ., 2019, 663, 738–753 CrossRef CAS PubMed.
- B. Olfe-Kräutlein, Front. Energy Res., 2020, 8, 198 CrossRef.
- M. Herrero, P. K. Thornton, D. Mason-D’Croz, J. Palmer, B. L. Bodirsky, P. Pradhan, C. B. Barrett, T. G. Benton, A. Hall, I. Pikaar, J. R. Bogard, G. D. Bonnett, B. A. Bryan, B. M. Campbell, S. Christensen, M. Clark, J. Fanzo, C. M. Godde, A. Jarvis, A. M. Loboguerrero, A. Mathys, C. L. McIntyre, R. L. Naylor, R. Nelson, M. Obersteiner, A. Parodi, A. Popp, K. Ricketts, P. Smith, H. Valin, S. J. Vermeulen, J. Vervoort, M. van Wijk, H. H. E. van Zanten, P. C. West, S. A. Wood and J. Rockström, Lancet Planet. Heal., 2021, 5, e50–e62 CrossRef PubMed.
- T. Niet, N. Arianpoo, K. Kuling and A. S. Wright, Energy Sustainable Soc., 2021, 11, 1 CrossRef.
- T. R. Walker, Curr. Opin. Green Sustainable Chem., 2021, 30, 100497 CrossRef CAS.
- S. Sala, E. Crenna, M. Secchi and E. Sanyé-Mengual, J. Environ. Manage., 2020, 269, 110686 CrossRef PubMed.
- J. Randers, J. Rockström, P. E. Stoknes, U. Golüke, D. Collste and S. Cornell, Transformation is Feasible! How to Achieve the sustainable development goals within planetary boundaries, Stockholm Resilience Centre, Stockholm, 2018, https://www.2052.info/Earth3 Search PubMed.
- M. Z. Hauschild, Procedia CIRP, 2015, 29, 1–7 CrossRef.
- M. W. Ryberg, M. Owsianiak, J. Clavreul, C. Mueller, S. Sim, H. King and M. Z. Hauschild, Sci. Total Environ., 2018, 634, 1406–1416 CrossRef CAS PubMed.
- J. Rockström, W. Steffen, K. Noone, Å. Persson, F. S. Chapin, E. Lambin, T. M. Lenton, M. Scheffer, C. Folke, H. J. Schellnhuber, B. Nykvist, C. A. de Wit, T. Hughes, S. van der Leeuw, H. Rodhe, S. Sörlin, P. K. Snyder, R. Costanza, U. Svedin, M. Falkenmark, L. Karlberg, R. W. Corell, V. J. Fabry, J. Hansen, B. Walker, D. Liverman, K. Richardson, P. Crutzen and J. Foley, Ecol. Soc., 2009, 14, 1–22 Search PubMed.
- W. Steffen, K. Richardson, J. Rockström, S. E. Cornell, I. Fetzer, E. M. Bennett, R. Biggs, S. R. Carpenter, W. de Vries, C. A. de Wit, C. Folke, D. Gerten, J. Heinke, G. M. Mace, L. M. Persson, V. Ramanathan, B. Reyers and S. Sörlin, Science, 2015, 347, 1259855 CrossRef PubMed.
- A. Bjørn, M. Diamond, M. Owsianiak, B. Verzat and M. Z. Hauschild, Environ. Sci. Technol., 2015, 49, 6370–6371 CrossRef PubMed.
- European Commission, Recommendation 2013/179/EU on the use of common methods to measure and communicate the life cycle environmental performance of products and organisations, 2013 Search PubMed.
- U. Bos, R. Horn, T. Beck, J. P. Lindner and M. Fischer, LANCA®-Characterization Factors for Life Cycle Impact Assessment, Version 2.5, Fraunhofer Verlag, 2018, https://www.bookshop.fraunhofer.de/buch/lanca.-characterization-factors-for-life-cycle-impact-assessment-version-2.0/244600 Search PubMed.
- V. De Laurentiis, M. Secchi, U. Bos, R. Horn, A. Laurent and S. Sala, J. Cleaner Prod., 2019, 215, 63–74 CrossRef PubMed.
- IEA, Technology Roadmap – Energy and GHG Reductions in the Chemical Industry via Catalytic Processes, Paris, 2013, vol. 56 Search PubMed.
- G. Wernet, C. Bauer, B. Steubing, J. Reinhard, E. Moreno-ruiz and B. Weidema, Int. J. Life Cycle Assess., 2016, 3, 1218–1230 CrossRef.
- NETL, Cost of Capturing CO2 from Industrial Sources, NETL, United States, 2014, https://www.osti.gov/biblio/1480985 Search PubMed.
- IEA, World Energy Outlook 2019, IEA, Paris, https://www.iea.org/reports/world-energy-outlook-2019.
- P. Bains, P. Psarras and J. Wilcox, Prog. Energy Combust. Sci., 2017, 63, 146–172 CrossRef.
- M. Fasihi, O. Efimova and C. Breyer, J. Cleaner Prod., 2019, 224, 957–980 CrossRef CAS.
- A. Galán-Martín, C. Pozo, A. Azapagic, I. E. Grossmann, N. Mac Dowell and G. Guillén-Gosálbez, Energy Environ. Sci., 2018, 11, 572–581 RSC.
- C. F. Heuberger, I. Staffell, N. Shah and N. Mac Dowell, Energy Environ. Sci., 2016, 9, 2497–2510 RSC.
- P. C. K. Vesborg and T. F. Jaramillo, RSC Adv., 2012, 2, 7933–7947 RSC.
- IEA, Energy Technology Perspectives 2008, Paris, 2008 Search PubMed.
- M. Pérez-Fortes, J. C. Schöneberger, A. Boulamanti and E. Tzimas, Appl. Energy, 2016, 161, 718–732 CrossRef.
- European Chemical Industry Council: Towards Implementing The Climate Law, https://tinyurl.com/a4bh7f7e.
- ISO, ISO 14040 International Standard, in Environmental Management – Life Cycle Assessment – Principles and Framework, International Organisationfor Standardization, Geneva, Switzerland, 2006 Search PubMed.
- ISO, ISO 14044 International Standard, in Environmental Management – Life Cycle Assessment – Requirements and Guidelines, Geneva, Switzerland, 2006 Search PubMed.
- S. C. D’Angelo, S. Cobo, V. Tulus, A. Nabera, A. J. Martín, J. Pérez-Ramírez and G. Guillén-Gosálbez, ACS Sustainable Chem. Eng., 2021, 9, 9740–9749 CrossRef.
- I. Ioannou, S. C. D’Angelo, A. J. Martín, J. Pérez-Ramírez and G. Guillén-Gosálbez, ChemSusChem, 2020, 13, 6370–6380 CAS.
- Á. Galán-Martín, V. Tulus, I. Díaz, C. Pozo, J. Pérez-Ramírez and G. Guillén-Gosálbez, One Earth, 2021, 4, 565–583 CrossRef.
- J. Rockström, W. Steffen, K. Noone, Å. Persson, F. S. Chapin, E. F. Lambin, T. M. Lenton, M. Scheffer, C. Folke, H. J. Schellnhuber, B. Nykvist, C. A. de Wit, T. Hughes, S. van der Leeuw, H. Rodhe, S. Sörlin, P. K. Snyder, R. Costanza, U. Svedin, M. Falkenmark, L. Karlberg, R. W. Corell, V. J. Fabry, J. Hansen, B. Walker, D. Liverman, K. Richardson, P. Crutzen and J. A. Foley, Nature, 2009, 461, 472–475 CrossRef PubMed.
- European Commission – Joint Research Centre – Institute of Environment and Sustainability. Supporting information to the characterisation factors of recommended EF Life Cycle Impact Assessment methods: New methods and differences with ILCD, Publications Office of the European Union, Luxembourg, 2018.
- European Commission – Joint Research Centre - Institute for Environment and Sustainability: International Reference Life Cycle Data System (ILCD) Handbook – Recommendations for Life Cycle Impact Assessment in the European context, Publications Office of the European Union, Luxemburg, 2011.
- World Economic Outlook database: April 2021, https://tinyurl.com/b8at8w4c (accessed 8 August 2021).
- E. S. Rubin, J. E. Davison and H. J. Herzog, Int. J. Greenh. Gas Control, 2015, 40, 378–400 CrossRef CAS.
- S. Fuss, W. F. Lamb, M. W. Callaghan, J. Hilaire, F. Creutzig, T. Amann, T. Beringer, W. de Oliveira Garcia, J. Hartmann and T. Khanna, Environ. Res. Lett., 2018, 13, 63002 CrossRef.
- CEFIC, Chemical Industry Contributes $5.7 Trillion To Global GDP And Supports 120 Million Jobs, https://tinyurl.com/yckjwper.
- UNCTD, Trade and Development Report 2021. From Recovery to Resilience: The Development Dimension, United Nations, New York, 2021 Search PubMed.
- United Nations, Global Goals on poverty and hunger require $265 billion annually, https://tinyurl.com/mee2tpjk.
- K. Stenberg, O. Hanssen, T. T.-T. Edejer, M. Bertram, C. Brindley, A. Meshreky, J. E. Rosen, J. Stover, P. Verboom, R. Sanders and A. Soucat, Lancet Glob. Heal., 2017, 5, e875–e887 CrossRef PubMed.
- M. Mascherini, M. Bisello, I. R. Leston and Eurofound, The gender employment gap: Challenges and solutions, Eurofound, 2016 Search PubMed.
- R. Meys, A. Kätelhön, M. Bachmann, B. Winter, C. Zibunas, S. Suh and A. Bardow, Science, 2021, 374, 71–76 CrossRef CAS PubMed.
- Á. Galán-Martín, D. Vázquez, S. Cobo, N. Mac Dowell, J. A. Caballero and G. Guillén-Gosálbez, Nat. Commun., 2021, 12, 6490 CrossRef PubMed.
- Y.-M. Wei, J.-N. Kang, L.-C. Liu, Q. Li, P.-T. Wang, J.-J. Hou, Q.-M. Liang, H. Liao, S.-F. Huang and B. Yu, Nat. Clim. Change, 2021, 11, 112–118 CrossRef.
Footnote |
| † Electronic supplementary information (ESI) available. See DOI: https://doi.org/10.1039/d2ee01153k |
| This journal is © The Royal Society of Chemistry 2023 |

