Addition of GAC caps and ozonation to conventional filters for improved organics and disinfection by-product reduction†
Emily
Bridgehouse
 a,
John
Armour
b,
Liz
Taylor-Edmonds
 a,
Robert C.
Andrews
a and
Michael J.
McKie
 *a
*a
aDepartment of Civil and Mineral Engineering, University of Toronto, 35 St. George St., Toronto, Ontario M5S 1A4, Canada. E-mail: emily.bridgehouse@mail.utoronto.ca; liz.taylor.edmonds@utoronto.ca; robert.andrews@utoronto.ca; m.mckie@utoronto.ca
bPeterborough Utilities Group Services Corp, 1230 Water Street North, Peterborough, Ontario K9H 7G4, Canada. E-mail: JArmour@peterboroughutilities.ca
First published on 25th October 2022
Abstract
Disinfection by-product (DBP) control is a concern for many water utilities, especially as increasingly stringent regulatory limits are implemented. It has been previously determined that GAC improves removal of organic matter and may support biomass related to “biofiltration” to provide prolonged organics control. The objective of this pilot study was to explore the advantages of shallow GAC beds, or GAC caps, added to existing filters with or without prior ozonation in comparison to anthracite/sand filters in terms of DBP formation potential (FP) reduction and organics removal. Seven different filter configurations were examined to quantify the impacts associated with each treatment variable. DBPs of interest were haloacetic acids (HAAs) and trihalomethanes (THMs), the formation potential and removal of which, along with dissolved organic carbon (DOC) were monitored. Filters were also monitored for biomass development and biodegradation potential via adenosine triphosphate (ATP) and enzyme activity, respectively. The results of this pilot study confirmed significant increases in the removal of DBP FP alone (7%) and in combination with GAC caps (11%) inferring synergistic organics removal mechanisms. Increasing ATP concentrations were observed on GAC when operated to promote biological acclimation (e.g. non-chlorinated backwash). Monitoring biomass characteristics was important to distinguish the adsorptive or biological ‘mode’ of the filters. The GAC caps provided short-term improvements with respect to specific organics removal, and demonstrated biological indicators for potential long-term treatment improvements when compared to filters which did not incorporate GAC. GAC caps may be a practical solution for facilities looking to improve performance, specifically in regard to DBP removal, by taking advantage of the higher biological density and removal capacity of GAC compared to anthracite, at a greatly reduced cost.
Water impactGranular activated carbon is the preferred filter media for drinking water biofilters, though the cost is much greater than non-adsorptive media. Recent research has confirmed that appreciable biodegradation occurs near the filter surface. This paper demonstrates that GAC filter caps may be used to improve biological treatment including organics and DBP formation potential removal at a fraction of the cost of complete filter media replacement. |
1. Introduction
Drinking water disinfection by-products (DBPs) typically form as a result of reactions between natural organic matter (NOM) and chemical disinfectants.1 Increasingly stringent DBP regulations have been established to limit the formation of common groups of DBPs including haloacetic acids (HAA) and trihalomethanes (THM2) based on evidence suggesting these compounds may impart a genotoxic or carcinogenic response,3 and act as surrogates for potentially more toxic compounds.4Biologically active filtration (biofiltration) allows the growth of naturally occurring biomass on the surface of granular filter media and has been shown to improve the performance of conventional treatment processes (coagulation, flocculation, sedimentation, and non-biological anthracite filtration) for organic matter5 and DBP precursor removal.6 Previous research examining biofiltration for DBP control has included the application of enhancement strategies (e.g. nutrient addition and hydrogen peroxide) to improve passive biofiltration by promoting biological growth and ensuring carbon substrate limitations;7,8 pre-oxidation (e.g. ozone and peroxone) to degrade organic substrates into more biodegradable compounds;9 and operational changes to promote the growth of more active biofilm.10,11
Previous examinations of biofilter operation have hypothesized relationships between substrate degradation and accumulation of active biomass. Adenosine triphosphate (ATP) has been widely used as an indicator of biomass density on filter media;5,12 enzyme activity (esterase and phosphatase) has been reported in the literature to quantify biofilter function relating to the removal of substrate.11,13,14 Measuring biological parameters through the depth of filters has shown that the highest ATP concentrations and enzyme activity (esterase and phosphatase) are present in the top 5–20 cm suggesting that the majority of biological treatment occurs in this region, while lower depths may provide additional particulate and turbidity removal.6,15,16
Pre-treatment (e.g. upstream oxidation, nutrient enhancement, etc.), empty bed contact time (EBCT) and backwash conditions have been widely shown to impact biofilter performance in terms of biomass development/activity and organics removal.7,12,17–19 Ozone has been widely applied to drinking water treatment to provide oxidation of contaminants and address specific objectives related to disinfection or organics degradation. Ozone degrades organics into more biologically assimilable compounds that may be subsequently biodegraded.17,20 However, improper (i.e. excessive) ozone dosing may have negative impacts on treatment performance, as elevated ozone dosages have been shown to impair the quality of treated water due to the production of organics which cannot be subsequently removed.21,22 The literature highlights the complicated synergy of ozone application in different treatment scenarios, ultimately stressing the importance of pilot studies to simultaneously optimize pre-oxidation and biofiltration to achieve overall treatment objectives.22–24
Filter media is another factor that may impact treatment cost and water quality. Sharma et al. (2018) compared biologically active carbon (BAC) and anthracite biofilters for dissolved organic carbon (DOC) and DBP formation potential (FP) removal, reporting superior performance with BAC in terms of HAA FP reduction (18 ± 8% for BAC vs. 8 ± 6% for anthracite).21 Improved performance associated with GAC has been widely reported throughout the literature and typically attributed to surface characteristics which preferentially support biomass and may allow bioregeneration of adsorption sites.25,26 Despite the expected increase in biofilter performance when employing GAC, capital costs associated with media replacement may be prohibitive for many water providers.
Considering the improved performance observed in the top layers (<20 cm) of GAC filters, shallow depth caps have been incorporated by some water utilities as a short-term solution to combat frequent taste and odour (T&O) episodes.27 Unlike biologically active GAC filters, the caps are typically replaced on an as-needed basis dependent on historical trends for each facility. Longer-term benefits of GAC caps to address other treatment objectives (namely DBP reduction) have not been widely investigated. The present study considers employing shallow depth (∼15 cm) GAC filter caps for utilities that have optimized their existing conventional treatment with respect to DBP formation, but need further improvements to meet increasingly stringent regulations.28,29 Full-scale implementation would include the addition of GAC caps to existing anthracite filters to increase removal of organics (either by adsorption or biodegradation) without incurring the capital costs associated with a transition to full-depth GAC filtration.
De Vera et al.17 (2019) cited some improvements to filter operation (reduced headloss by up to 50% when combined with H2O2 and NH2Cl) when considering the use of a tri-media configuration (GAC/anthracite/sand) combined with upstream oxidants. Based on this and previous works, it is hypothesized that the GAC caps would initially provide effective removal of organics and DBP precursors through adsorption before removing organics through biological processes. As the majority of DBP precursor removal occurs in the top 25% of GAC filter,6,11,12 it was anticipated that GAC caps would provide improved organics removal when compared to anthracite biofilters at a fraction of the cost of full media replacement.
This study was designed to develop a practical solution for conventional drinking water treatment facilities to improve the removal of organics and DBP precursors while considering capital and operational costs. The objective of this pilot study was to evaluate the addition of a range of treatment alternatives (e.g. GAC caps, pre-ozonation and non-chlorinated backwash) to provide long-term operational flexibility thereby improving the ability of water providers to meet future regulatory DBP objectives when compared to conventional non-biological treatment.
2. Materials and methods
2.1. Source water and full-scale filter design
The pilot plant was located at a drinking water facility in Ontario, Canada that treats Otonabee River water conventionally using coagulation (∼45 mg L−1 alum), tapered flocculation, sedimentation and dual-media filtration (anthracite/sand). Raw water was pre-chlorinated at 0.5 mg L−1, achieving a total chlorine concentration ∼0.2 mg L−1 at the intake for zebra mussel control.Two full-scale filters were also examined in the study including, 1) a dual-media (50 cm anthracite, 50 cm sand) conventional filter in service for >20 years and operated at a 15 ± 2 min empty bed contact time (EBCT), and 2) a tri-media filter which had been operated as a dual-media conventional filter prior to installation of ∼10 cm GAC two months prior to the start of the study, operated at a 11 ± 2 min EBCT. Both full-scale filters treated post-coagulation settled water, and were backwashed three times per week or in response to water quality indicators.
2.2. Pilot plant configuration and operations
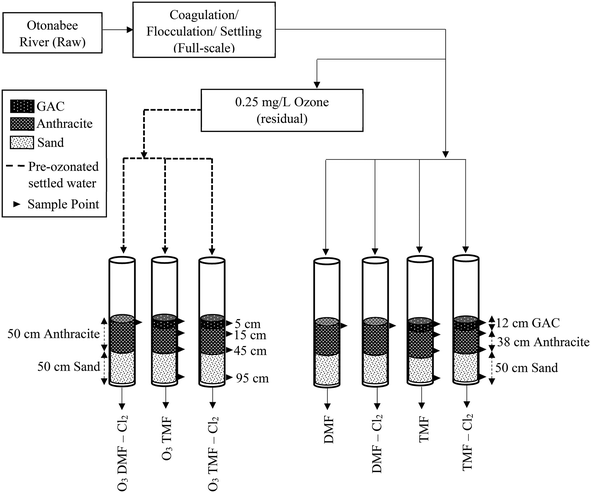
The pilot system consisted of seven filters, each having a total media depth of 100 cm to match full-scale filters (Table 1, Fig. 1). The dual-media filters (DMF) served as control to mimic full-scale filters (50 cm anthracite, 50 cm sand). Anthracite was obtained from the same full-scale filters (ES = 0.85, UC = 1.8), and the sand had the same specifications as that installed at full-scale (ES = 0.5, UC = 1.8). To evaluate GAC caps, the top 12 cm of the triple-media filters (TMFs) consisted of virgin Continental Carbon GAC (ES = 1.65; Stoney Creek, ON) based on recommendation from the utility.| Filter designation | O3 DMF – Cl2 | O3 TMF | O3 TMF – Cl2 | DMF | DMF – Cl2 | TMF | TMF – Cl2 | |
|---|---|---|---|---|---|---|---|---|
| a Media samples collected depth-wise using ports installed perpendicular to filter flow. b Media samples collected from top of filter (to 5 cm depth).N/A = not applicable; Y = yes; N = no. TMF = triple-media filter (GAC/anthracite/sand); DMF = dual-media filter (anthracite/sand). | ||||||||
| Media type | Sand (m) | 0.5 | 0.5 | 0.5 | 0.5 | 0.5 | 0.5 | 0.5 |
| Anthracite (m) | 0.5 | 0.38 | 0.38 | 0.5 | 0.5 | 0.38 | 0.38 | |
| F300 GAC (m) | N/A | 0.12 | 0.12 | N/A | N/A | 0.12 | 0.12 | |
| Operational parameters (Y/N) | O3 (0.25 mg L−1 residual) | Y | Y | Y | N | N | N | N |
| Chlorinated backwash | Y | N | Y | N | Y | N | Y | |
| EBCT (min) | 15 | 15 | 15 | 15 | 15 | 15 | 15 | |
| Sampling depths (Y/N) | 5 cm | Yb | Ya | Ya | Yb | Yb | Ya | Ya |
| 15 cm | N | Ya | Ya | N | N | Ya | Ya | |
| 45 cm | N | Ya | Ya | N | N | Ya | Ya | |
| 95 cm | N | Ya | Ya | N | N | Ya | Ya | |
Full-scale settled water (post-coagulation and sedimentation) was used as influent to the pilot system including a dedicated pilot-scale ozone generation module (Intuitech Ozonation Pilot Module Z100; Salt Lake City, UT). The ozone contactor residence time was 12 min with an applied ozone dose of 2.4 ± 0.2 mg L−1 (transfer efficiency >90%) to achieve a 0.25 ± 0.1 mg O3 per L residual. Ozone was quenched using 30% calcium thiosulfate (2![[thin space (1/6-em)]](https://www.rsc.org/images/entities/char_2009.gif) :
:![[thin space (1/6-em)]](https://www.rsc.org/images/entities/char_2009.gif) 1 molar ratio CTS
1 molar ratio CTS![[thin space (1/6-em)]](https://www.rsc.org/images/entities/char_2009.gif) :
:![[thin space (1/6-em)]](https://www.rsc.org/images/entities/char_2009.gif) O3) prior to the water entering pilot filters; ozone was measured prior to the filters to ensure that no measurable residual remained.
O3) prior to the water entering pilot filters; ozone was measured prior to the filters to ensure that no measurable residual remained.
All pilot filters were operated in constant flow mode and were backwashed three times per week. Backwash included 50% bed expansion (high-flow backwash condition) for 6 min and 30% expansion (low-flow backwash condition) for 3 min. Non-chlorinated backwash was achieved using pilot filter effluent (Cl2 < 0.02 mg L−1), while chlorinated backwash was conducted using finished water from the full-scale plant (∼1.8 mg L−1 free chlorine residual).
2.3. Sampling procedure
Six samples were collected over a five-month period, during the months of August to December to evaluate surface water temperatures ranging from 3–25 °C. 1 L water samples were collected in duplicate from all pilot filter influent and effluent sampling ports, as well as depth-wise (5, 15, 45 cm from the filter surface) from the tri-media filters. All samples were collected headspace-free in amber bottles and stored at 4 °C prior to analyses.Sampling also included media collection from the top 5 cm of all pilot filters and full-scale filters, as well as from depth-wise sampling ports located at 15, 45 and 95 cm depths from the top of all TMFs. Media samples were stored at 4 °C and analyzed for ATP, and enzyme activity (phosphatase and esterase) within 48 hours of collection.
2.4. Statistical analysis
Statistical comparisons of treated water quality were conducted to discern statistically significant differences between filter configurations. A Student's paired t-test was used to compare the effectiveness of GAC caps to the control filter with a 95% confidence interval, such that p-values <0.05 confirm a significant difference and larger p-values suggest statistical similarity. A single-tailed t-test was applied to identify significant removal between the filter influent and effluent. A two-tailed t-test was applied to determine the significance between the experimental filters.18 Additionally, a factorial design method was used to further contextualize individual and interaction effects of the treatment variables (i.e. GAC caps, pre-ozonation and chlorinated backwash), specifically to elucidate interaction effects for the different filter configurations (i.e. quantify simultaneous changes in two variables between GAC caps, ozone and chlorinated backwash).2.5. Analytical methods
Upon collection, water samples were measured in duplicate for pH, turbidity, dissolved oxygen, free chlorine residual and temperature. pH and temperature were measured using a Hach HQ40D pH probe; dissolved oxygen was measured using a YSI 550a dissolved oxygen probe; turbidity and free chlorine were measured using a TU5200 Laboratory Laser Turbidimeter by Hach and DR3900 Laboratory Spectrophotometer by Hach, respectively.DBP FP was measured by chlorinating water samples to a target 24 hour free chlorine residual of 1.0 ± 0.5 mg L−1, in chlorine-demand-free amber bottles. Duplicate samples were incubated at 22 ± 2 °C for 24 ± 2 hours, after which chlorine residuals were measured as described in Standard Method 4500-CI G30 and quenched with L-ascorbic acid (100 mg L−1). DBPs were analyzed using a liquid–liquid extraction gas chromatographic method based on the Standard Method 6232 B for THM4 (total of four THM species: chloroform, bromodichloromethane, chlorodibromomethane and bromoform) and Standard Method 6251 B for HAA9 (total of nine HAA species: monochloroacetic acid, monobromoacetic acid, dichloroacetic acid, trichloroacetic acid, bromochloroacetic acid, dibromoacetic acid, bromodichloro acetic acid, chlorodibromoacetic acid, tribromoacetic acid).30 Calibration curves were prepared with each sample set using HAA9 and THM4 standard solutions (Sigma Aldrich, Mississauga, ON), and analysis was performed using an Agilent 7890 Gas Chromatograph (Mississauga, ON) equipped with an electron capture detector (GC-ECD) and a DB 5.625 capillary column (Agilent Technologies Canada Inc., Mississauga, ON). Quality control was ensured by analyzing a sequentially prepared check standard after every ten samples according to Standard Method 1020 (APHA, 2017).
DOC was measured in duplicate using a wet-oxidation method per Standard Method 5310 D30 on filtered water (PTFE filter with 0.45 μm pore size), using an O-I Corporation Model 1030 TOC analyzer (College Station, Texas, USA). Each sample was analyzed in triplicate and averaged. UV absorbance at 254 nm was analyzed in duplicate using an Agilent 8453 UV-visible spectrophotometer (Agilent Technologies Canada Inc., Mississauga, ON) with a 1 cm quartz crystal cuvette. All filtered water samples were stored in 40 mL amber vials immediately prior to analysis. In cases where samples were not analyzed directly following collection, they were filtered and acidified to pH < 2 with H2SO4 and stored for up to 14 days.
ATP concentrations were quantified using a LuminUltra Deposit Surface Analysis kit (DSA-100C, Fredericton, NB) to quantify biomass in filter media. Briefly, 1 g of collected media (after removal of surficial water) was transferred to a LuminUltra solution to lyse the sample, and incubated for at least 5 minutes. Biomass extract was assayed with luciferase enzyme and measured using a luminometer to obtain relative light units (RLU). ATP concentrations were calculated using a LuminUltra calibration solution.
Enzyme extraction was performed using a sonication method similar to that described by McKie et al.11 Briefly, 50 mL of Tris buffer (pH = 8; adjusted using HCl) and 2.5 mL of BugBuster solution (Millipore) were combined with 5 g of media sample and sonicated for 10 min (applied energy = 400 W). The resulting extract was filtered through a 1 μm filter (Whatman). Following extraction, enzyme activity was quantified by adding 1.6 mL of the extract to 0.4 mL of 200 μm 4-methylumbelliferone (4-MUB, Sigma Aldrich, Mississauga, ON) substrate analogue for phosphatase and esterase. The fluorescence of the samples was then measured using a Cary Eclipse Luminescence Spectrometer G9800A (Agilent Technologies Canada Inc., Mississauga, ON, Canada) at an excitation energy of 475 V. Absorbance was measured at excitation and emission wavelengths of 370 nm and 445 nm, respectively, applying the following equation to correct for absorbance effects:31
 | (1) |
3. Results
3.1. Organics control
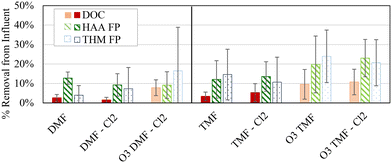
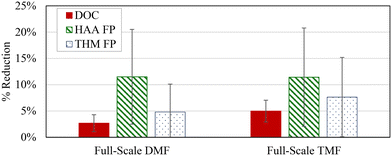
Removal of organics and DBP precursors (DOC, HAA FP, and THM FP when compared to the pilot influent) was examined to determine the specific process related impacts of each filter configuration (Fig. 2).Overall, DOC reduction was low (0.1–0.3 mg L−1, 2–11%) considering anticipated initial adsorption reductions between 80 and 85%, based on the literature, indicating that organics remaining following coagulation and sedimentation was likely non-adsorbable.5,32 It should be noted that Fig. 2 is inclusive of organics removal through the biological acclimation period of the GAC caps. A combination of removal mechanisms, including biodegradation and adsorption, likely contributed to the observed standard deviations associated with the various analytes (1–22%). To isolate the impact of acclimation, variability from all samples was compared to the variability in the final three samples from each filter (i.e. after adsorptive capacity was exhausted). When averaging variability among all filters, a 2% reduction in variability was observed for DOC removal (4% for all samples, 2% for last three samples), HAA removal (8% for all samples, 6% for last three samples) and THM removal (11% for all samples, 9% for last three samples) which suggests that acclimation was responsible for only a portion of the overall variability observed. A majority of the DOC removal from raw water was achieved by coagulation and sedimentation (2.3 ± 0.2 mg L−1, 41 ± 4%); coagulation at this facility was typically optimized in terms of DOC control. Specific organic compounds (e.g. DBP precursors) may not be equally removed by coagulation suggesting that alternative control strategies may be warranted to achieve alternative objectives (e.g. DBP control).33 As such, coagulant dosing targeting DBP precursors, especially in combination with the GAC caps, may improve DBP FP removal beyond what was observed during this study.
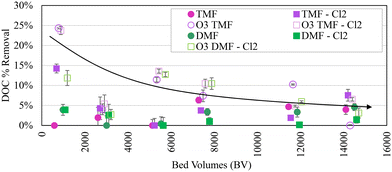
On average, DOC removal was similar in pre-ozonated dual- and tri-media filters, with tri-media filter DOC removal rapidly decreasing between 0 and 5400 bed volumes (BVs) treated (equivalent to ∼45![[thin space (1/6-em)]](https://www.rsc.org/images/entities/char_2009.gif) 000 GAC cap BVs). A presumed anomaly in sampling occurred at 2900 BVs (∼24
000 GAC cap BVs). A presumed anomaly in sampling occurred at 2900 BVs (∼24![[thin space (1/6-em)]](https://www.rsc.org/images/entities/char_2009.gif) 200 GAC cap equivalent BVs), with DOC removal <5% reported for all filters, followed by a stable period (0.3 ± 0.1 mg L−1, 8 ± 4% reduction in ozonated filters and 0.1 ± 0.1 mg L−1, 3 ± 2% in non-ozonated filters; Fig. 3), potentially indicating exhaustion of the adsorptive capacity in the GAC. Previous studies have identified exhaustion of GAC adsorption sites between 15
200 GAC cap equivalent BVs), with DOC removal <5% reported for all filters, followed by a stable period (0.3 ± 0.1 mg L−1, 8 ± 4% reduction in ozonated filters and 0.1 ± 0.1 mg L−1, 3 ± 2% in non-ozonated filters; Fig. 3), potentially indicating exhaustion of the adsorptive capacity in the GAC. Previous studies have identified exhaustion of GAC adsorption sites between 15![[thin space (1/6-em)]](https://www.rsc.org/images/entities/char_2009.gif) 000 and 30
000 and 30![[thin space (1/6-em)]](https://www.rsc.org/images/entities/char_2009.gif) 000 BVs, consistent with the observed potential exhaustion in this study (∼4 months).5,32 Virgin GAC was installed at the beginning of the study (BV = 0); anthracite was harvested from a full-scale filter after >20 years in service. Some influence from the mature biomass in the underlying anthracite was expected in the GAC caps, making it difficult to specify organic removal mechanisms (i.e. adsorption or biodegradation). As such, DOC removal in the TMFs between 0 and 5400 BVs was considered primarily a result of adsorption (although biomass development was observed on the GAC over this period). DOC removal in the dual-media anthracite filters was considered primarily a result of biodegradation by an established biomass and/or removal of organic particulate carried over from sedimentation.
000 BVs, consistent with the observed potential exhaustion in this study (∼4 months).5,32 Virgin GAC was installed at the beginning of the study (BV = 0); anthracite was harvested from a full-scale filter after >20 years in service. Some influence from the mature biomass in the underlying anthracite was expected in the GAC caps, making it difficult to specify organic removal mechanisms (i.e. adsorption or biodegradation). As such, DOC removal in the TMFs between 0 and 5400 BVs was considered primarily a result of adsorption (although biomass development was observed on the GAC over this period). DOC removal in the dual-media anthracite filters was considered primarily a result of biodegradation by an established biomass and/or removal of organic particulate carried over from sedimentation.
Statistically higher (α < 0.05) DOC and HAA FP removal (17 ± 12%, 13 ± μg L−1) was observed for filters (both DMF and TMF) receiving ozonated water when compared to non-ozonated filter influent (12 ± 7%, 9 ± 5 μg L−1). Under the assumption that adsorption was dominating in the TMFs while DMFs were operating biologically, pre-ozonation significantly improved biofiltration in terms of DOC removal and did not impact removal by adsorption. Although no statistical improvement in THM FP removal was observed when considering ozonation alone (α > 0.05), practical improvements were observed that would benefit a facility depending on target effluent levels for specific organics (average 20 ± 17%, 18 ± 21 μg L−1 THM FP removal).
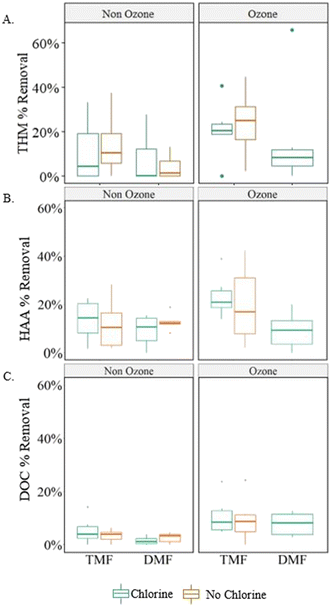
Combining pre-ozonation and GAC caps was expected to maximize the DOC removal.9,22 A factorial analysis did not show any significant interaction effects (measure of simultaneous changes in two variables) related to the conditions examined in the study (α > 0.05; Table 2), but a graphical comparison of the effects from individual and combined treatment variables suggests that the combined effect of the GAC caps and pre-ozonation did improve THM FP and HAA FP reduction when comparing settled water to GAC caps or ozone alone (average 7% improvement with ozone; 8% with GAC caps; 11% with ozone + GAC caps, Fig. 4).
| HAA removal | THM removal | DOC removal | ||
|---|---|---|---|---|
| Emboldened values indicate significant calculated effect (analysis of variance at 95% confidence interval). Effects with negative values infer that the ‘− factor’ improved removal. “:” introduces an interaction effect between treatments. | ||||
| + Factor | − Factor | Main effect (removal) | ||
| μg L−1 | μg L−1 | mg L−1 | ||
| TMF | DMF | 4.6 | 4.2 | 0.1 |
| Ozone | No ozone | 4.3 | 8.7 | 0.2 |
| Chlorine | No chlorine | 0.2 | −0.8 | 0.0 |
| Interaction effects (removal) | ||||
| μg L−1 | μg L−1 | mg L−1 | ||
TMF![[thin space (1/6-em)]](https://www.rsc.org/images/entities/char_2009.gif) : :![[thin space (1/6-em)]](https://www.rsc.org/images/entities/char_2009.gif) ozone ozone |
DMF![[thin space (1/6-em)]](https://www.rsc.org/images/entities/char_2009.gif) : :![[thin space (1/6-em)]](https://www.rsc.org/images/entities/char_2009.gif) no ozone no ozone |
−2.3 | 3.8 | 0.0 |
TMF![[thin space (1/6-em)]](https://www.rsc.org/images/entities/char_2009.gif) : :![[thin space (1/6-em)]](https://www.rsc.org/images/entities/char_2009.gif) chlorine chlorine |
DMF![[thin space (1/6-em)]](https://www.rsc.org/images/entities/char_2009.gif) : :![[thin space (1/6-em)]](https://www.rsc.org/images/entities/char_2009.gif) no chlorine no chlorine |
−2.5 | 2.0 | −0.1 |
Ozone![[thin space (1/6-em)]](https://www.rsc.org/images/entities/char_2009.gif) : :![[thin space (1/6-em)]](https://www.rsc.org/images/entities/char_2009.gif) chlorine chlorine |
No ozone![[thin space (1/6-em)]](https://www.rsc.org/images/entities/char_2009.gif) : :![[thin space (1/6-em)]](https://www.rsc.org/images/entities/char_2009.gif) no chlorine no chlorine |
−0.3 | −3.6 | −0.1 |
Ozone resulted in greater DOC removal, regardless of filter configuration, whereas GAC-capped filters improved DBP FP removal, regardless of pre-treatment or backwash conditions. This was somewhat unexpected as the virgin GAC was assumed to be operating in an adsorptive mode which has been shown to dominate removal until capacity is exhausted.6 However, a shift in removal mechanisms during biomass acclimation, may have skewed the overall significance as the initial DOC removal was higher (0–25%) than at later sampling dates (<13%).
DOC and HAA FP reacted similarly to combined and individual treatment variables. Specifically, HAA FP showed a significant linear relationship (Fig. S1;†R2 > 0.7) with DOC removal for ozonated and TMF filters, perhaps indicating a similar removal mechanism, especially during the biomass acclimation period.
GAC caps did provide increased organics and DBP control despite rapid exhaustion of adsorptive capacity. However, the combined impacts with pre-ozonation or upstream coagulant dose optimization may not be practical for general organics control unless targeting specific DBPs.
3.2. Characterization of biomass
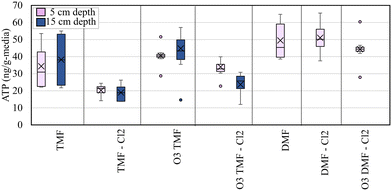
ATP was measured to quantify biomass at mid-depth of the GAC caps (∼5 cm), the GAC/anthracite interface (15 cm) and depth-wise through the anthracite and sand layers (45 cm and 95 cm depths). ATP concentrations measured in the pilot filters over the duration of the study were lower than expected (<60 ng g−1-media; Fig. 6) based on previous studies which evaluated GAC and anthracite biofilters at this location (75–100 ng g−1 media ATP in unchlorinated anthracite biofilters, 175–270 ng g−1-media in unchlorinated GAC biofilters).33 Anthracite filters (in service >20 years) overall exhibited slightly higher ATP values than the corresponding GAC filters (virgin GAC; 28–65 ng ATP g−1-media).When analyzing ATP data, consideration was given to filter design, as sampling requirements for filters equipped with GAC caps differed from others due to the influence of the underlying anthracite. To facilitate comparison with the DMFs, ATP was measured both at the center of the cap (which was assumed to be 100% GAC) and at the GAC/anthracite interface (which may represent a blend of “virgin” GAC and acclimated anthracite media). Although the ATP measured in the top (5 cm) of the pilot filters was below the accepted threshold for active biofiltration (∼70 ng g−1-media),12 trends in biomass development may be helpful in predicting the viability of caps for continued biofiltration.
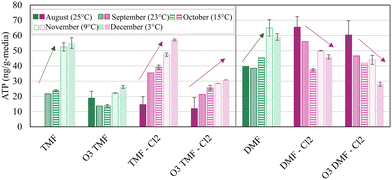
Fig. 7 shows the ATP measured at the GAC cap/anthracite interface (TMFs) increasing in concentration over time, despite decreasing water temperature (24–3 °C); and corresponding decrease in ATP concentration measured in the dual-media filters. Media collection at a depth of 15 cm were chosen to facilitate a consistent comparison with DMFs, and normalize the impact of aged anthracite and virgin GAC. Media samples collected from this depth were also potentially less prone to incur negative bias associated with any potential residual ozone at the top of the filter which would be quenched at lower depths. Increasing ATP was likely due to biomass growth and accumulation on the virgin GAC. Biomass did not stabilize within the GAC caps or the anthracite filters over the study period (in terms of ATP), however it was anticipated that biomass development would continue to an upper threshold imposed either by GAC surface area available to host biomass or substrate loading. An active biomass may have then allowed for prolonged viability of the GAC caps specifically for organics control following exhaustion of adsorptive capacity.
Anthracite filters exhibited some susceptibility to chlorinated backwash in terms of ATP development (Fig. 7) which declined with decreasing water temperature. The anthracite filter without chlorine (DMF), as well as the GAC-capped filters (TMF), were observed to have generally increasing concentrations of ATP throughout the study, despite a decreasing trend in water temperature. Although the mechanisms associated with increasing ATP in the DMF were not a focus of this study, it was hypothesized that this was associated with the microbial community moving deeper into the filter. Lower reactions rates associated with the cooler water temperature allowed more bioavailable nutrients to penetrate the more biologically active surface layer and increased the growth of biofilm through the filter depth. Although the change in biomass was statistically insignificant (α > 0.05), this observation implied additional robustness of the GAC caps to withstand latent chlorine residual (∼1.5 mg L−1) which may otherwise be expected to reduce biomass density, or quenching of free chlorine in the upper-most portions of the cap.
Comparison of GAC cap biomass development, and similar indicators employed to determine biofilter health or function, were useful in assessing whether the caps improved water quality by contributing removal via biofiltration as anticipated, and providing some indication of future performance.
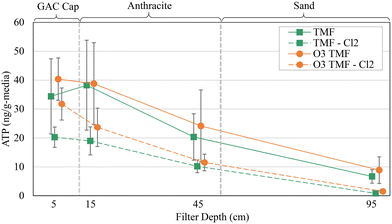
The pilot filters exhibit a similar ATP depth-profile to those reported in the literature. ATP decreased with increasing filter depth, despite relatively low total concentration. Small differences (∼5 ng g−1-media) were observed within the GAC caps (5–15 cm depth; Fig. 8), possibly due to the influence of biologically acclimated mature anthracite.
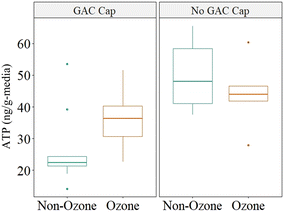
Pre-ozonation appeared to accelerate filter acclimation in terms of ATP (Fig. 9), as evidenced by a distinct increase when comparing filter media receiving ozonated (average 36 ± 12 ng g−1-media) vs. non-ozonated influent (27 ± 2 ng g−1-media in non-ozonated filters). GAC caps were assumed to be acclimating from a virgin state (∼0 ng ATP g−1 media), compared to the pre-acclimated anthracite in the DMFs which exhibited similar ATP values for pre-ozonated (average 44 ± 2 ng g−1-media) and settled influent (average 50 ± 27 ng g−1-media in non-ozonated), albeit with higher overall ATP than the TMFs. This instance of lower ATP concentrations attributed to GAC media in comparison to anthracite was unexpected based on established biofiltration literature12,38 further indicating incomplete acclimation and reliance on adsorption. In addition to the distinction between the virgin GAC cap and mature anthracite, it should be noted that the full-scale anthracite filters at the site operated with biomass metrics similar to that of acclimated GAC biofilters (Fig. S2†).
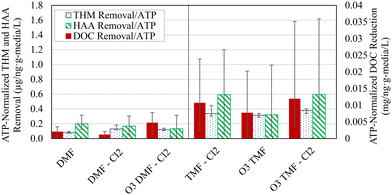
Normalizing organics removal using the “working ATP” concentration (defined in this study as ATP measured at 5 cm depth for DMFs and of an average of 5 and 15 cm depths for TMFs) allowed an effective means of comparison regarding biofilter function. Normalized organics removal was distinctly elevated in the TMFs which indicated greater organics removal per unit biomass (Fig. 10). However, this did not translate to improved organics removal as statistically similar HAA and DOC removal were observed (α > 0.05, Table 3; <10 μg L−1 difference in HAA FP and <0.1 mg L−1 difference in DOC removal). These results contextualized the previously reported removal, emphasizing the importance of the different mechanisms; removal in the DMFs was driven by biological consumption and by adsorption in the TMFs. The difference in normalized removal was expected to decrease when comparing different filter types over time, assuming similar active biomass in dual- and tri-media for the same source water and pre-treatment. Upon biological acclimation of the GAC caps, it was anticipated that biological removal would dominate, such that increases in ATP may have corresponded to greater biological activity and subsequent improvements in organics reduction. These results follow that of previous studies, which suggest that ATP is not an effective or meaningful indicator of organics removal and should be used instead as an indicator of biofilm development.12,33,39
| Treatment comparisons | DOC | THM FP | HAA FP | ATP | Esterase activity | Phosphatase activity | |
|---|---|---|---|---|---|---|---|
| p-Values | |||||||
| Bold p-values <0.05 are statistically significant. T-Tests are for % removal when comparing effluent to influent. NA = not applicable. | |||||||
| Raw | Settled | 7.5 × 10 −7 | 4.8 × 10 −6 | 6.7 × 10 −5 | NA | NA | NA |
| Raw | Ozone | 1.2 × 10 −6 | 1.0 × 10 −5 | 0.001 | NA | NA | NA |
| Ozone | Settled | 0.039 | 0.477 | 0.304 | NA | NA | NA |
| Ozone | O3 DMF – Cl2 | 0.006 | 0.202 | 0.028 | NA | NA | NA |
| Ozone | O3 TMF – Cl2 | 0.010 | 0.030 | 0.005 | NA | NA | NA |
| Ozone | O3 TMF | 0.022 | 0.024 | 0.026 | NA | NA | NA |
| Settled | DMF | 0.338 | 0.398 | 0.000 | NA | NA | NA |
| Settled | DMF – Cl2 | 0.062 | 0.421 | 0.029 | NA | NA | NA |
| Settled | TMF | 0.042 | 0.060 | 0.036 | NA | NA | NA |
| Settled | TMF – Cl2 | 0.047 | 0.116 | 0.007 | NA | NA | NA |
| DMF | DMF – Cl2 | 0.287 | 0.394 | 0.229 | 0.863 | 0.333 | 0.320 |
| TMF | TMF – Cl2 | 0.933 | 0.744 | 0.991 | 0.147 | 0.899 | 0.538 |
| O3 TMF | O3 TMF – Cl2 | 0.498 | 0.566 | 0.192 | 0.103 | 0.370 | 0.137 |
| TMF | O3 TMF | 0.274 | 0.295 | 0.685 | 0.623 | 0.356 | 0.022 |
| DMF – Cl2 | O3 DMF – Cl2 | 0.023 | 0.362 | 0.983 | 0.134 | 0.319 | 0.057 |
| TMF – Cl2 | O3 TMF – Cl2 | 0.059 | 0.095 | 0.045 | 0.027 | 0.954 | 0.036 |
| DMF – Cl2 | TMF – Cl2 | 0.059 | 0.342 | 0.105 | 0.001 | 0.346 | 0.330 |
| DMF | TMF | 0.208 | 0.117 | 0.705 | 0.029 | 0.287 | 0.491 |
| O3 DMF – Cl2 | O3 TMF – Cl2 | 0.183 | 0.580 | 0.002 | 0.137 | 0.546 | 0.583 |
Enzyme activity is increasingly reported in the literature as a means to provide substrate-specific context to the relationship between activity of particular enzymes within the biofilter and observed performance. Phosphatase activity was noticeably reactive to specific treatment conditions (primarily pre-ozonation and GAC caps); significant increases were observed in ozonated TMFs (0.01–0.10 μM g−1 min−1; Fig. 11) when compared to non-ozonated (<0.01 μM g−1 min−1). This was anticipated based on previous studies which attributed ozone to an increase in availability of phosphate and carbon in the influent, thus promoting subsequent biological activity.33 Phosphatase activity in the TMFs increased between the August (25 °C) and September (23 °C) sampling events, decreasing thereafter. No relationship with water temperature was observed, similar to previous results at this facility.11 Further, elevated phosphatase activity in the TMFs for September (23 °C) and November (9 °C) did not correspond with elevated phosphate concentration, although phosphatase activity was not strictly influenced by phosphate uptake.
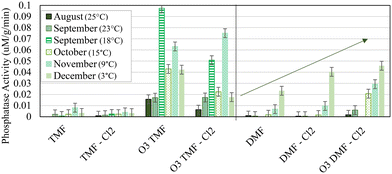 | ||
| Fig. 11 Average phosphatase activity at 5 cm depth, measured in duplicate; vertical bars represent method error; media sample was not collected from ‘TMF’ in August (25 °C). | ||
Phosphatase activity decreased with filter depth for the ozonated TMFs and remained constant in non-ozonated filters (Fig. S3†). Enzyme activity in the DMFs consistently increased over time (ozone provided moderate improvement; Fig. 11). Phosphatase activity was higher and more variable in the ozonated GAC caps which may have been a response to on-going biological acclimation. When compared to ATP concentrations which declined over time, phosphatase activity indicated an increase in biological activity as a potential stress response, as the existing biome adjusted to new operating conditions and influent substrates.
Regression analysis of enzyme activity and key water quality parameters (DOC, HAA FP and THM FP removal) did not yield any significant linear relationships (including analysis based on GAC caps and the presence or absence of pre-ozonation; R2 < 0.4). Although enzyme activity did not provide any insight regarding mechanisms associated with HAA or DOC reduction, monitoring of activity may be beneficial to better characterize filter acclimation and to differentiate between adsorption and biodegradation than biomass alone; further research in this area is required.
4. Conclusions
This study explored potential process improvements to reduce HAA FP and provide additional organics control to meet increasingly stringent DBP thresholds. Variations to existing filter configurations included the addition of GAC caps, pre-ozonation of post-coagulated/settled water (0.25 mg L−1 ozone residual) and the use of chlorinated backwash.Initial DOC removal (∼25%) was lower than anticipated for virgin media, likely due to insufficient contact time in the GAC layer to allow for complete adsorption to occur. Indicators of GAC exhaustion (i.e. stable DOC and DBP FP removal) were evident after ∼45![[thin space (1/6-em)]](https://www.rsc.org/images/entities/char_2009.gif) 000 BVs associated with the GAC cap (43 days of operation), similar to exhaustion rates presented elsewhere in the literature. Initial organics removal in the GAC caps was assumed to primarily result from adsorption although combined removal mechanisms were evident, with some influence from biomass in the underlying anthracite. GAC caps provided additional DOC reduction when compared to the control dual-media filters, however overall improvements may not be of practical importance, depending on specific treatment objectives.
000 BVs associated with the GAC cap (43 days of operation), similar to exhaustion rates presented elsewhere in the literature. Initial organics removal in the GAC caps was assumed to primarily result from adsorption although combined removal mechanisms were evident, with some influence from biomass in the underlying anthracite. GAC caps provided additional DOC reduction when compared to the control dual-media filters, however overall improvements may not be of practical importance, depending on specific treatment objectives.
Ozonation to achieve a 0.25 ± 0.1 mg L−1 residual prior to filtration significantly increased HAA FP reduction, especially when combined with GAC caps. Improvements to DOC removal by ozone was significant (α < 0.05) but less than anticipated based on previous studies, possibly a result of combined removal mechanisms or insufficient depth provided by the GAC to prevent breakthrough. Overall, the application of ozone was associated with greater organics removal than GAC caps alone.
Chlorinated backwash was not observed to impact water quality. Chlorinated backwash may not impair the development of biomass assuming a relatively low chlorine residual (<0.5 mg L−1). Non-chlorinated backwash was not identified as a priority for achieving water quality improvements.
Anthracite filters, with media transplanted from full-scale, consistently exhibited higher ATP levels than GAC filters for the same treatment combinations, although concentrations were generally low (<70 ng g−1-media). Overall, GAC caps provided a number of beneficial short-term impacts with respect to organics removal and added benefits to facilities targeting specific compounds. Although observations in this study suggested an adsorption-dominated mode of organics removal, indicators of biomass growth were evident in the GAC caps and increased over time, which may provide additional long-term benefits in terms of biodegradation.
Future work should compare the impact of varying GAC cap depths on biological filtration, including their impact on taste and odour compounds (geosmin and methylisoborneol). In addition, studies should be conducted for extended periods and include further characterization of biomass composition. Based on the existing literature, it is anticipated that the GAC caps will provide improved removal of organics and DBP precursors when compared to biologically active non-adsorptive media (e.g. anthracite) and can be utilized without replacement as long as filter media specifications (e.g. uniformity coefficient and effective size) remain within the acceptable range.
Conflicts of interest
There are no conflicts to declare.Acknowledgements
This work was funded by the Natural Sciences and Engineering Research Council of Canada Chair in Drinking Water Research at the University of Toronto. We would like to thank the Peterborough Water Treatment Plant for assistance facilitating pilot operation and sample collection.References
- S. W. Krasner, W. A. Mitch, P. Westerhoff and A. Dotson, Formation and control of emerging C-and N-DBPs in drinking water, J. - Am. Water Works Assoc., 2012, 104(11), E582–E595 CrossRef.
- B. Chen and P. Westerhoff, Predicting disinfection by-product formation potential in water, Water Res., 2010, 44(13), 3755–3762 CrossRef CAS PubMed.
- S. D. Richardson, M. J. Plewa, E. D. Wagner, R. Schoeny and D. M. Demarini, Occurrence, genotoxicity, and carcinogenicity of regulated and emerging disinfection by-products in drinking water: A review and roadmap for research, Mutat. Res., Rev. Mutat. Res., 2007, 636(1–3), 178–242 CrossRef CAS PubMed.
- M. G. Muellner, E. D. Wagner, K. McCalla, S. D. Richardson, Y. T. Woo and M. J. Plewa, Haloacetonitriles vs. regulated haloacetic acids: Are nitrogen-containing DBPs more toxic?, Environ. Sci. Technol., 2007, 41, 645–651 CrossRef CAS.
- L. G. Terry and R. S. Summers, Biodegradable organic matter and rapid rate biofilter performance: A review, Water Res., 2018, 128, 234–245 CrossRef CAS PubMed.
- J. Fu, W. Lee, C. Coleman, M. Meyer, J. Carter, K. Nowack and C. Huang, Pilot investigation of two-stage biofiltration for removal of natural organic matter in drinking water treatment, Chemosphere, 2017, 166, 311–322 CrossRef CAS PubMed.
- C. Lauderdale, P. Chadik, M. Kirisits and J. Brown, Engineered biofiltration: Enhanced biofilter performance through nutrient and peroxide addition, J. - Am. Water Works Assoc., 2012, 104(5), E298–E309 CrossRef.
- Y. Zhao, L. Taylor-Edmonds and R. C. Andrews, Impact of carbon-based nutrient enhancement on biofiltration performance for drinking water treatment, J. Environ. Sci., 2019, 82, 124–131 CrossRef CAS PubMed.
- M. Arnold, J. Batista, E. Dickenson and D. Gerrity, Use of ozone-biofiltration for bulk organic removal and disinfection byproduct mitigation in potable reuse applications, Chemosphere, 2018, 202, 228–237 CrossRef CAS PubMed.
- V. A. Nemani, M. J. McKie, L. Taylor-Edmonds and R. C. Andrews, Impact of biofilter operation on microbial community structure and performance, J. Water Process. Eng., 2018, 24, 35–41 CrossRef.
- M. J. McKie, C. Bertoia, L. Taylor-Edmonds, S. A. Andrews and R. C. Andrews, Pilot-scale comparison of cyclically and continuously operated drinking water biofilters: Evaluation of biomass, biological activity and treated water quality, Water Res., 2019, 149, 488–495 CrossRef CAS PubMed.
- L. Pharand, M. I. Van Dyke, W. B. Anderson and P. M. Huck, Assessment of biomass in drinking water biofilters by adenosine triphosphate, J. - Am. Water Works Assoc., 2014, 106(10), E433–E444 CrossRef.
- S. F. Keithley and M. J. Kirisits, Enzyme-identified phosphorus limitation linked to more rapid headloss accumulation in drinking water biofilters, Environ. Sci. Technol., 2019, 53(4), 2027–2035 CrossRef CAS PubMed.
- M. J. McKie, M. C. Ziv-El, L. Taylor-Edmonds, R. C. Andrews and M. J. Kirisits, Biofilter scaling procedures for organics removal: A potential alternative to piloting, Water Res., 2019, 151, 87–97 CrossRef CAS.
- N. Boon, B. F. Pycke, M. Marzorati and F. Hammes, Nutrient gradients in a granular activated carbon biofilter drives bacterial community organization and dynamics, Water Res., 2011, 45(19), 6355–6361 CrossRef CAS PubMed.
- X. Liao, C. Chen, Z. Wang, R. Wan, C. H. Chang, X. Zhang and S. Xie, Changes of biomass and bacterial communities in biological activated carbon filters for drinking water treatment, Process Biochem., 2013, 48, 312–316 CrossRef CAS.
- G. A. de Vera, J. Keller, W. Gernjak and H. Weinberg, Biodegradability of DBP precursors after drinking water ozonation, Water Res., 2016, 106, 550–561 CrossRef CAS PubMed.
- M. J. McKie, L. Taylor-Edmonds, S. A. Andrews and R. C. Andrews, Engineered biofiltration for the removal of disinfection by-product precursors and genotoxicity, Water Res., 2015, 81, 196–207 CrossRef CAS PubMed.
- M. U. Ackay, Z. Y. Avdan and H. Inan, Effect of biofiltration process on the control of THMs and HAA in drinking water, Desalin. Water Treat., 2018, 104, 2546–2554 Search PubMed.
- R. Nerenberg, B. E. Rittmann and W. J. Soucie, Ozone/biofiltration for removing MIB and geosmin, J. - Am. Water Works Assoc., 2000, 92, 85–95 CrossRef CAS.
- D. Sharma, L. Taylor-Edmonds and R. C. Andrews, Comparative assessment of ceramic media for drinking water biofiltration, Water Res., 2018, 128, 1–9 CrossRef CAS PubMed.
- B. S. Sidhu, L. Taylor-Edmonds, M. J. McKie and R. C. Andrews, Pre-oxidation strategies for biofiltration performance improvement, J. Water Process. Eng., 2018, 26, 116–123 CrossRef.
- N. M. Peleato, B. S. Sidhu, R. L. Legge and R. C. Andrews, Investigation of ozone and peroxone impacts on natural organic matter character and biofiltration performance using fluorescence spectroscopy, Chemosphere, 2017, 172, 225–233 CrossRef CAS PubMed.
- D. Beniwal, L. Taylor-Edmonds, J. Armour and R. C. Andrews, Ozone/peroxide advanced oxidation in combination with biofiltration for taste and odor control and organics removal, Chemosphere, 2018, 212, 272–281 CrossRef CAS PubMed.
- M. B. Emelko, P. M. Huck, B. M. Coffey and F. E. Smith, Effects of media, backwash and temperature on full-scale biological filtration, J. - Am. Water Works Assoc., 2006, 98(12), 61–73 CrossRef CAS.
- R. G. Scharf, R. W. Johnston, M. J. Semmens and R. M. Hozalski, Comparison of batch sorption tests, pilot studies and modeling for estimating GAC bed life, Water Res., 2010, 44(3), 769–780 CrossRef CAS.
- L. F. Moore and S. B. Watson, The Ontario Water Works Consortium: A functional model of source water management and understanding, Water Sci. Technol., 2007, 55(5), 195–201 CrossRef CAS.
- Health Canada, Guidelines for Canadian Drinking Water Quality, 2017, Retrieved from https://www.canada.ca/en/health-canada/services/environmental-workplacehealth/reports-publications/water-quality/guidelines-canadian-drinking-water-quality.
- United States Environmental Protection Agency (USEPA), 2018, National Primary Drinking Water Regulation. Retrieved from https://www.epa.gov/ground-water-and-drinkingwater/national-primary-drinking-water-regulations.
- American Public Health Association, Water Environment Federation, American Water Works Association. Standard Methods for The Examination Of Water And Wastewater, 2017, 23 ed.: 5.12–5.14.
- D. N. Kothawala, K. R. Murphy, C. A. Stedmon, G. A. Weyhenmeyer and L. J. Tranvik, Inner filter correction of dissolved organic matter fluorescence, Limnol. Oceanogr.: Methods, 2013, 11(2), 616–630 CrossRef.
- K. Doederer, G. A. De vera, M. P. Espino, M.-L. Pype, D. Gale and J. Keller, MIB and geosmin removal during adsorption and biodegradation phases of GAC filtration, Water Sci. Technol., 2018, 18(4), 1449–1455 CAS.
- M. McKie, L. Taylor-Edmonds, S. A. Andrews and R. C. Andrews, Effective enzyme activity: a proposed monitoring methodology for biofiltration systems with or without ozone, Water Res., 2020, 183, 116069 CrossRef CAS PubMed.
- J. Yuan, E. Passeport and R. Hofmann, Understanding adsorption and biodegradation in granular activated carbon for drinking water treatment: A critical review, Water Res., 2022, 210, 118026 CrossRef CAS.
- A. Magic-Knezev and D. van der Kooij, Optimisation and significance of ATP analysis for measuring active biomass in granular activated carbon filters used in water treatment, Water Res., 2004, 38, 3971–3979 CrossRef CAS.
- W. T. Chen, C. C. Chien, W. S. Ho, J. H. Ou, S. C. Chen and C. M. Kao, Effects of treatment processes on AOC removal and changes of bacterial diversity in a water treatment plant, J. Environ. Manage., 2022, 311, 114853 CrossRef CAS PubMed.
- Y.-H. Lin, Molecular weight distribution of organic matter by ozonation and biofiltration, Water Sci. Technol., 2012, 66(12), 2604–2612 CrossRef CAS PubMed.
- J. Z. Wang, R. S. Summers and R. J. Miltner, Biofiltration performance: Part 1, relationship to biomass, J. - Am. Water Works Assoc., 1995, 87(12), 55–63 CrossRef CAS.
- Z. Lu, Z. Jing, J. Huang, Y. Ke, C. Li, Z. Zhao, X. Ao and W. Sun, Can we shape microbial communities to enhance biological activated carbon filter performance?, Water Res., 2022, 212, 118104 CrossRef CAS.
Footnote |
| † Electronic supplementary information (ESI) available. See DOI: https://doi.org/10.1039/d1ew00901j |
| This journal is © The Royal Society of Chemistry 2023 |

