 Open Access Article
Creative Commons Attribution 3.0 Unported Licence
Infrared photodesorption of CO from astrophysically relevant ices studied with a free-electron laser
Emily R.
Ingman
a,
Domantas
Laurinavicius
b,
Jin
Zhang
 c,
Johanna G. M.
Schrauwen
 d,
Britta
Redlich
 d,
Jennifer A.
Noble
 ef,
Sergio
Ioppolo
 cg,
Martin R. S.
McCoustra
 b and
Wendy A.
Brown
 *a
*a
aDepartment of Chemistry, University of Sussex, Falmer, Brighton, BN1 9QJ, UK. E-mail: w.a.brown@sussex.ac.uk
bInstitute of Chemical Sciences, Heriot-Watt University, Edinburgh, EH14 4AS, UK
cSchool of Electronic Engineering and Computer Science, Queen Mary University of London, London E1 4NS, UK
dFELIX Laboratory, Radboud University, Nijmegen 6525 ED, The Netherlands
ePhysique des Interactions Ioniques et Moléculaires (PIIM), CNRS, Aix-Marseille Université, Marseille, France
fSchool of Physical Sciences, University of Kent, Canterbury, CT2 7NH, UK
gDepartment of Physics and Astronomy, University of Aarhus, Ny Munkegade 120, 8000 Aarhus C, Denmark
First published on 24th March 2023
Abstract
The infrared excitation and photodesorption of carbon monoxide (CO) and water-containing ices have been investigated using the FEL-2 free-electron laser light source at the FELIX laboratory, Radboud University, The Netherlands. CO–water mixed ices grown on a gold-coated copper substrate at 18 K were investigated. No CO photodesorption was observed, within our detection limits, following irradiation with light resonant with the C–O vibration (4.67 μm). CO photodesorption was seen as a result of irradiation with infrared light resonant with water vibrational modes at 2.9 μm and 12 μm. Changes to the structure of the water ice, which modifies the environment of the CO in the mixed ice, were also seen subsequent to irradiation at these wavelengths. No water desorption was observed at any wavelength of irradiation. Photodesorption at both wavelengths is due to a single-photon process. Photodesorption arises due to a combination of fast and slow processes of indirect resonant photodesorption (fast), and photon-induced desorption resulting from energy accumulation in the librational heat bath of the solid water (slow) and metal-substrate-mediated laser-induced thermal desorption (slow). Estimated cross-sections for the slow processes at 2.9 μm and 12 μm were found to be ∼7.5 × 10⁻¹⁸ cm2 and ∼4.5 × 10⁻¹⁹ cm2, respectively.
1. Introduction
To date, more than 240 different species have been identified in space in the gas phase.1 As well as gas-phase species, molecules are also found frozen out on dust-grain surfaces, forming icy mantles.2–4 The composition of these icy mantles depends on the region of space, but includes water ice, CO, CO2 and methanol ice4–7 and several organic species.8 Molecular ices frozen out on dust grains act as an important reservoir for molecules in astrophysical environments, such as the interstellar medium (ISM),9,10 comets11 and circumstellar disks.12 In many regions of space, water and CO dominate the solid state.6,7 Water accretes reactively on grain surfaces from early in the cooling phase of cold, dense environments,13 initially forming solid water clusters due to diffusion over the grain surface.14 However, as temperatures fall below ∼30 K, CO deposition also occurs from the gas phase. In parallel with continued reactive accretion of water, this then forms a mixed film of CO and water ice that coats the grain surface. At the very lowest temperatures, a CO-rich layer is formed on the water-rich layer to also give rise to layered ices.15Processing of these ice-covered grains by energetic particles including vacuum ultra-violet (VUV),16–18 X-rays,19 electrons20–22 and cosmic rays19,20,23 leads to desorption into the gas phase. Processing of mixed ices can also lead to the formation of complex organic molecules (COMs),24 many of which have an important role in forming prebiotic species.25 In addition to these more energetic particles, there is also a large amount of infrared radiation in astrophysical environments.26 To date, however, there have been very few investigations of the effects of infrared radiation on the physics and chemistry of astrophysically relevant ices and this source of radiation is currently neglected in models of star- and planet-forming regions, other than through radiative transport. This contrasts markedly with the extensive literature associated with the impact of VUV and cosmic-ray interactions on the physics and chemistry of ices. As well as understanding the effect of the resonant excitation of ice components by light at different wavelengths, it is also important to understand how any energy deposited into the icy mantle of a dust grain is dissipated within the grain.
Solid CO absorbs in the infrared around 4.67 μm![[thin space (1/6-em)]](https://www.rsc.org/images/entities/char_2009.gif) 27 and solid water exhibits infrared bands around 3 μm (O–H stretch), 4.5 μm (a combination of the H–O–H bend and librational motions), 6.10 μm (the H–O–H bend) and 12.8 μm (librational motions).28 Numerous studies report on the infrared spectra of mixtures of CO and water ice in the solid state.29–34 As the prototypical model of interstellar ices, temperature-programmed desorption (TPD) of CO from solid water surfaces has also been extensively studied,34–36 and binding energies for CO on solid water typically range from 6–12 kJ mol−1, corresponding to photon wavelengths of 20 and 10 μm, respectively. Hence, it might be expected that irradiation of CO on solid water at any wavelength shorter than 20 μm should result in CO desorption. In contrast to CO desorption promoted by VUV photons, which has been extensively studied,37,38 observations of infrared-promoted desorption are few and far between, even though the infrared flux in the interstellar radiation field in molecular clouds is comparable to the VUV flux in the same region (104 photons cm−2 s−1).39 Given that infrared radiation penetrates more deeply than VUV radiation into dense objects, the presence of such radiation in cold, dense cores may help, in part, to explain observations of excess gas-phase densities of species like CO that would be expected to be condensed out on grains in dense, low-temperature environments.
27 and solid water exhibits infrared bands around 3 μm (O–H stretch), 4.5 μm (a combination of the H–O–H bend and librational motions), 6.10 μm (the H–O–H bend) and 12.8 μm (librational motions).28 Numerous studies report on the infrared spectra of mixtures of CO and water ice in the solid state.29–34 As the prototypical model of interstellar ices, temperature-programmed desorption (TPD) of CO from solid water surfaces has also been extensively studied,34–36 and binding energies for CO on solid water typically range from 6–12 kJ mol−1, corresponding to photon wavelengths of 20 and 10 μm, respectively. Hence, it might be expected that irradiation of CO on solid water at any wavelength shorter than 20 μm should result in CO desorption. In contrast to CO desorption promoted by VUV photons, which has been extensively studied,37,38 observations of infrared-promoted desorption are few and far between, even though the infrared flux in the interstellar radiation field in molecular clouds is comparable to the VUV flux in the same region (104 photons cm−2 s−1).39 Given that infrared radiation penetrates more deeply than VUV radiation into dense objects, the presence of such radiation in cold, dense cores may help, in part, to explain observations of excess gas-phase densities of species like CO that would be expected to be condensed out on grains in dense, low-temperature environments.
Previous investigations of the effect of selective infrared irradiation of water ice have shown that desorption40,41 and restructuring42,43 of the water ice can take place, with the exact effects depending on which vibrational modes of the water are excited. A more recent study of the infrared free-electron laser irradiation of CO2 ice44 under astrophysically relevant conditions has also shown that restructuring of the ice, as well as photodesorption, occurs following irradiation with infrared light. Infrared free-electron laser studies of CO irradiation in the presence of methanol ice have also been undertaken very recently and show the photodesorption of CO.45
To investigate the role of infrared absorption and excitation in processing astrophysically relevant ices, we have studied the infrared excitation and photodesorption of model astrophysical ices containing water and CO. A free-electron laser source was used to selectively excite vibrational modes of water and CO in CO–water mixed ices. As well as reporting observations of infrared-induced photodesorption of CO and commenting on the mechanisms that could lead to such photodesorption, we also present estimates of the cross-section, and photodesorption yield, for infrared-induced photodesorption of CO from water-containing ices.
2. Experimental methods
Experiments were undertaken using the laboratory ice surface astrophysics (LISA) ultrahigh vacuum (UHV) end-station at the HFML-FELIX laboratory, Radboud University, The Netherlands. Details of the experimental set-up have been reported previously.42,44 CO and water ices were grown on an Au-coated Cu substrate cooled to a temperature of between 18–25 K using a closed-cycle He cryostat (SHI Sumitomo Cryogenics). In this substrate temperature range, water forms a well-characterised porous structure known as porous amorphous solid water p-(ASW).46 Solid CO on the other hand exhibits amorphous behaviour at the lower temperature limit of the range and is known to be crystalline at the higher temperature limit.47,48 The sample was cleaned before each experiment by heating to 200 K to desorb any remaining water and CO ice. The irradiation of mixtures of CO and water (deionised) ranging from 6–42% of CO with respect to water was investigated. CO was used as received from Hoekloos/Praxair (99.9% purity). Ices were grown via background deposition of molecules through an all-metal leak valve. Water doses are given in Lm where 1 Lm corresponds to deposition at a pressure of 1 × 10⁻⁶ mbar for 1 s. Mixed ices were grown by co-depositing 780 Lm water and the appropriate amount of CO to give the required ice composition.The FEL-2 light source at FELIX, consisting of 10 μs macropulses at a 5 Hz repetition rate, was used to irradiate the ices at base temperature for a total of 5 minutes. FEL-2 allowed the irradiation of CO and water in the mid-infrared range, due to its tunability over the 3–45 μm wavelength region. The energy of the laser pulses depended on the wavelength of light used, and the attenuation of the beam, but generally varied between 1–140 mJ. Power-dependent studies were undertaken by applying up to 38 dB of attenuation to the laser source to vary the average energy of the beam. The spectral FWHM of the FEL-2 beam is estimated to be ∼0.8% δλ/λ for the entire wavelength range. THE FEL-2 beam impinges on the Au-plated Cu substrate at an angle of 45° with respect to the surface. The optical configuration of the FEL-2 source was optimised to ensure that the infrared light used to irradiate the sample was p-polarised, so that the absorption of infrared light at the metal surface was maximal.49 The FEL-2 laser spot on the sample was around 2 mm in height. Since the substrate was 38 × 57 mm in size, this allowed multiple clean spots on the ice to be irradiated without needing to completely clean the sample and re-dose the ice mixture between irradiations. Although this increased the number of experiments that could be undertaken without cleaning and re-dosing the ice, it meant that some re-adsorption of CO onto the ice occurred during the long time of an experiment. Ices were irradiated with a range of different wavelengths corresponding to the water and CO infrared bands shown in Fig. 1.
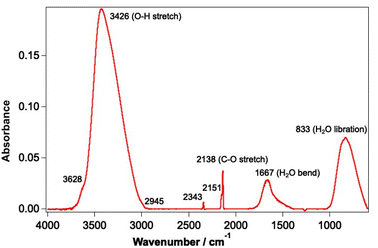 | ||
| Fig. 1 Infrared spectrum of a mixed CO and water ice dosed on the Au-coated Cu substrate at 18 K. The ice consists of 780 Lm of ASW and 13.3% CO. | ||
Irradiation of the sample was undertaken at 2.90 ± 0.02 μm (OH stretch mode), 3.10 ± 0.02 μm (OH stretch mode), 3.47 ± 0.03 μm (water off-resonance), 4.50 ± 0.04 μm (CO off-resonance), 4.67 ± 0.04 μm (CO stretch), 6.00 ± 0.04 μm (water bending mode) and 12.00 ± 0.09 μm (water librational mode). The upper and lower limits on the irradiation wavelengths indicate the FWHM of the FEL-2 beam. These wavelengths were chosen to selectively irradiate the ices at wavelengths resonant with the different vibrational modes of water and CO. Off-resonant wavelengths were also investigated to confirm that any observations occurred because of direct absorption by the water and/or CO.
A combination of reflection–absorption infrared spectroscopy (RAIRS) and mass spectrometry measurements of photon-induced photo-induced desorption (PID) was used to quantify the results of the infrared irradiation. A Fourier transform infrared spectrometer (Vertex 80v, Bruker) coupled to a liquid-nitrogen-cooled mercury cadmium telluride detector was used for the RAIRS experiments. The beam angle of the infrared light onto the substrate in the RAIRS experiments was 13°. RAIR spectra were recorded prior to irradiation, and after irradiation of the ice at 18 K. The pre-irradiation spectrum consisted of the co-addition of 512 scans, and the post-irradiation spectra were the result of the co-addition of 256 scans. All spectra were recorded with a resolution of 0.5 cm−1. Post-irradiation infrared spectra are reported as difference spectra, which are obtained by subtracting the pre-irradiation spectrum from the post-irradiation spectrum to show any spectral changes that occur because of the FEL-2 irradiation. PID data were recorded using a quadrupole mass spectrometer (QMS) (Hiden Analytical HAL 201). Mass spectrometer fragments of m/z = 18 u (water) and m/z = 28 u (CO) were recorded. These are referred to as mass 18 and mass 28, respectively, throughout the discussion. Hereafter we discuss RAIR spectra in wavenumbers and FEL-2 irradiation in wavelength to highlight the higher spectral resolution of the RAIRS data compared to the transform-limited bandwidth of the FEL-2 beam.
3. Results and discussion
3.1 Infrared spectra of unirradiated ices
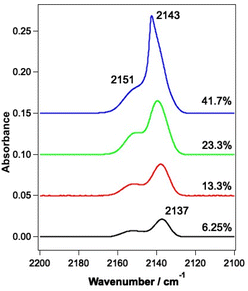
RAIR spectra were initially recorded for the unirradiated ices to allow a comparison to be made with the irradiated ices. RAIR spectra of pure CO and CO in the presence of ASW have been well characterised in the literature. Fig. 2 shows RAIR spectra for unirradiated ices consisting of mixed CO and water ice at various compositions. Only the spectral region from 2100–2200 cm−1 is shown, to highlight the C–O stretching mode. The RAIR spectra in Fig. 2 show two main bands, at 2137 and 2151 cm−1, which have previously been assigned to CO adsorbed in a water matrix and dispersed as a monolayer in the p-ASW structure.34,50 For the 41.7% mixed ice, a strong feature is seen at 2143 cm−1, which overlays the 2137 cm−1 feature. This band is associated with the presence of pure CO adsorbed on the surface50–54 and suggests that there is also a layer of CO adsorbed on top of the CO–water mixed ice due to re-adsorption from the background in the UHV chamber in this case. Hence, at low mixing fraction, the spectra are consistent with CO isolated in, and monolayer CO adsorbed on, the matrix of p-ASW. As the mixing ratio increases, the appearance of a feature at 2143 cm−1 due to solid CO points to the presence of small clusters of CO isolated in, and multilayer CO adsorbed on, the p-ASW matrix.3.2 Infrared irradiation of CO and water-containing ices
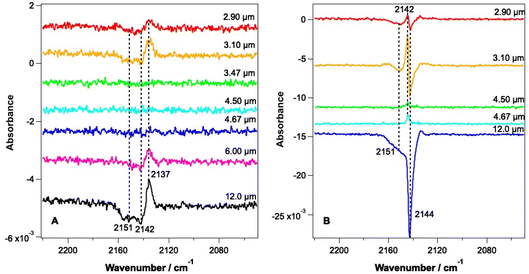
Fig. 3 shows RAIR difference spectra for CO–water mixed ices at a range of irradiation wavelengths. Fig. 3A shows spectra for an ice consisting of 6.25% CO with respect to water ice and Fig. 3B shows spectra recorded for an ice consisting of 41.7% CO with respect to water ice. Due to the tunability of the FEL-2 light source, different energies were available at different wavelengths, as shown in Table 1.| Wavelength of irradiation/μm | Average irradiation energy/mJ | |
|---|---|---|
| 6.25% CO–water mixture | 41.7% CO–water mixture | |
| 2.90 | 1.6 | 5 |
| 3.10 | 12 | 7 |
| 3.47 | 12 | — |
| 4.50 | 4 | 1.5 |
| 4.67 | 20 | 1 |
| 6.00 | 50 | — |
| 12.0 | 110 | 100 |
The RAIR spectra seen in Fig. 3 show clear wavelength-dependent spectral changes following irradiation at 2.9, 3.1, 6 and 12 μm. The largest effects are seen following irradiation of the ices at 12 μm. Fig. 3A shows that for all wavelengths where an effect is observed for the 6.25% CO–water ices, the change in the CO spectrum is similar. There is a loss of infrared signal intensity between 2141 and 2155 cm−1 and an increase in signal intensity at 2137 cm−1. No effect is seen following irradiation at 3.47, 4.5 and 4.67 μm, at least within the detection limits of our experiment. The observed spectral changes can be assigned either to a loss of CO from the ice, or to a change in the environment of CO within the mixed ice promoted by the irradiation. The observed increase in the CO band at 2137 cm−1 suggests an increase in the CO–water interactions in the ice due to irradiation.
Fig. 3B shows spectral changes that occur as the result of irradiation of the 41.7% mixed ice at various wavelengths. Irradiation at 2.9 and 3.1 μm (the O–H stretching mode) results in a loss of the CO signal at 2144 cm−1 and 2151 cm−1 and a small gain in signal intensity at 2142 cm−1. Irradiation at 12 μm shows the largest spectral changes, with a large loss in CO band intensity at 2144 and 2151 cm−1 being observed. The observed spectral changes in Fig. 3B are larger than those in Fig. 3A due to the larger proportion of CO in the ice. The increase in the band at 2142 cm−1 seen for all wavelengths of irradiation can be assigned to re-adsorption of CO during the time of the experiment (data for the irradiation of a 41.7% CO mixed ice were recorded several hours after the initial dosing of the sample), and not to radiation-induced changes. This is confirmed by the fact that this effect is seen following irradiation off-resonance (4.5 μm), when no other spectral changes are seen. It is therefore likely that the CO–water mixtures in these experiments also have a thin, dispersed, CO layer on top of the mixed ice due to re-adsorption during the time between the initial ice dose and the irradiation experiments. The decreases in the CO band at 2144 and 2151 cm−1 are assigned to the loss of CO from the ice that occurs following irradiation at 2.9, 3.1 and 12 μm. These bands are the same as those seen for the unirradiated ice in Fig. 2 and hence represent loss of CO from the ice.
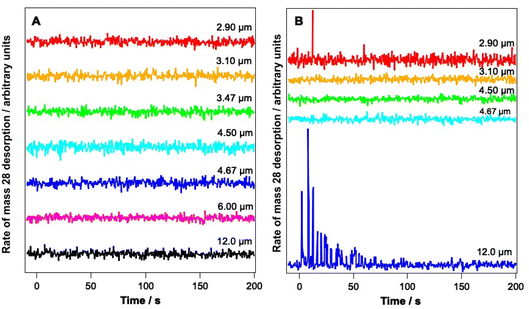
Fig. 4 shows PID traces recorded with the QMS during the irradiation shown in Fig. 3. Although an overall loss of solid CO signal intensity due to irradiation at 2.90, 3.1, 6 and 12 μm is observed for the ice consisting of 6.25% CO (Fig. 3A), no photodesorption is observed at any wavelength for this ice within the detection limits of our QMS (Fig. 4A).
In contrast, Fig. 4B shows that for the 41.7% CO–water mixture, photodesorption of CO is seen when the ice is irradiated at wavelengths of 2.9 μm and 12 μm. This observation agrees with the infrared difference spectra in Fig. 3B, which clearly show a loss of CO signal at 2144 and 2151 cm−1 resulting from irradiation at 2.9 and 12 μm. No CO PID signal was observed following irradiation at 4.67 μm, at least within the detection limits of the QMS. No PID signal for water was observed at any irradiation wavelength. Photodesorption was also not observed for either ice composition at an off-resonance wavelength of 4.5 μm. Off-resonance irradiation was therefore not investigated further.
Although no previous work has investigated the resonant infrared irradiation of mixed CO and water-containing ices to the best of our knowledge, Santos et al.45 have studied the irradiation of mixed CO and methanol-containing ices. They observed the loss of CO signal in RAIRS following irradiation at both the methanol and CO (4.67 μm) wavelengths. The lack of any detectable effect due to irradiation at 4.67 μm in our experiments is therefore in contrast to observations made by Santos et al.45 However, the ices used here are considerably thinner than those studied by Santos et al.45 Hence it is expected that the small effects seen in RAIRS for their thicker ices, following irradiation at 4.67 μm, would not be detectable for our much thinner ices. We also note that Santos et al.45 did not observe a CO PID signal during irradiation at 4.67 μm, in agreement with our observations. It is also likely that CO–water ices show different behaviour when compared to CO–methanol ices due to the different interactions between CO and methanol compared to those between CO and water.
Noble et al.42 also studied the irradiation of a pure ASW ice with the FEL-2 beam using wavelengths like those used in this work. RAIR spectra showed a change from amorphous to crystalline water following infrared irradiation with light corresponding to the water vibrational modes.42 Hence it is expected that the observed changes in the CO bands shown in Fig. 3 may arise due to a combination of CO loss from the ice, and a change in the environment of the CO caused by structural changes in the water ice. This is confirmed by RAIR spectra (shown later) that show that the water bands also change upon infrared irradiation.
3.3 Detailed studies of irradiation at 2.90 and 12.0 μm
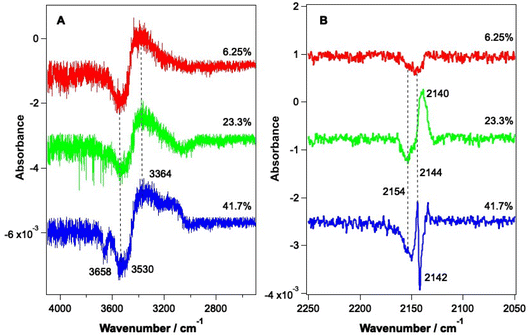
As shown by the data in Fig. 3 and 4, the largest changes occur in the mixed ice due to irradiation at 2.9 μm and 12 μm, corresponding to the O–H stretch and librational modes of water, respectively. Hence a more detailed study of the irradiation of mixed CO–water ices at these wavelengths was undertaken. Fig. 5 shows RAIR difference spectra for the OH and CO stretching regions for various mixed CO–water ices irradiated at 2.9 μm with beam energies between 1 and 5 mJ.As seen in Fig. 5A, the percentage of CO in the ice does not affect the features seen in the O–H stretching region. The O–H band (Fig. 5A) shows a loss of signal intensity at around 3530 cm−1 and 3658 cm−1 and an increase in signal intensity at ∼3364 cm−1. Previous studies have reported the same changes in the RAIR spectrum following irradiation of pure ASW ice at 2.7 μm.42,55–57 These spectral changes can therefore be assigned to a loss of OH dangling bonds as the water ice undergoes a structural change from an amorphous structure to a more crystalline structure, due to irradiation. The CO infrared band shows the same changes on irradiation as already described in Fig. 3, with the changes becoming more pronounced for increasing percentages of CO within the ice. We note that the increase in the CO band at ∼2140 cm−1 for the 23.3% and 41.7% ice suggests the re-adsorption of a layer of CO on top of the mixed CO–water ice, as described earlier.
PID traces (not shown) were also recorded with the QMS during the irradiation of mixed CO–water ices at 2.9 μm. Data showed that photon-induced desorption of CO was observed at energies above around 9 mJ. It is unlikely that this value represents a threshold energy for observation of PID, and it is most likely that PID is not seen below this energy due to the relatively low sensitivity of the QMS and the high residual CO signal in some experiments. We note that the presence of a re-adsorbed layer of CO ice on top of the mixed CO–water ice suggests that it is most likely CO from this “capping” layer that desorbs into the gas phase following ice irradiation. This is discussed in more detail below with respect to irradiation of CO–water ices at 12 μm.
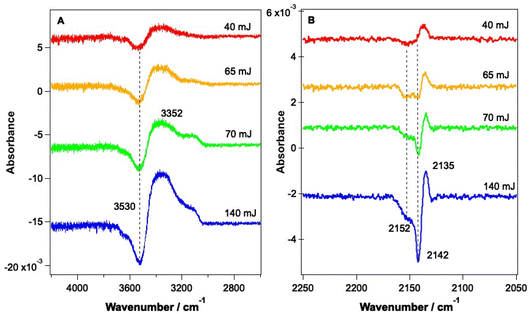
Fig. 6 shows RAIR difference spectra that result from the irradiation of a 13.3% CO–water ice at various energies at a wavelength of 12 μm. Fig. 6A shows changes observed for the water ice in the O–H stretching region and Fig. 6B shows changes observed for the CO ice. As already shown in Fig. 3, the observed spectral changes are larger than those observed following irradiation at 2.9 μm. Similar spectral changes were observed for all ice mixtures investigated over the range from 6.25% CO to 41.7% CO.
The spectral changes observed in the O–H stretching region in Fig. 6 are the same as those observed following irradiation at 2.9 μm (Fig. 5) and can hence be assigned to the same structural changes in the water ice, observed previously by Noble et al.42,58 As the energy of the infrared irradiation increases, the intensity of the observed spectral changes increases. Fig. 6B shows changes in the CO spectral region that occur following irradiation at 12 μm. The changes seen in Fig. 6B are like those observed in Fig. 5B, which arise from irradiation at 2.9 μm, with a loss of the bands at 2142 cm−1 and 2152 cm−1 and an increase in the C–O mode at 2135 cm−1. The loss of CO bands at 2152 and 2142 cm−1 increases as the laser power increases.
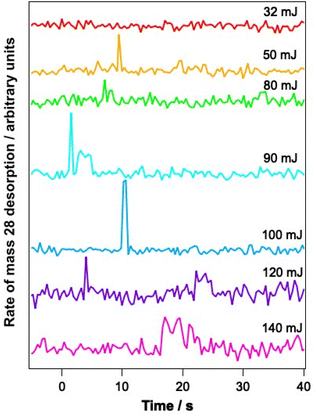
To determine whether the observed changes in the C–O vibrational bands seen in Fig. 6B arise as a result of a change in environment of the water ice due to structural rearrangement, or due to loss of CO from the ice, PID traces were also recorded for a range of mixtures during the infrared irradiation. Fig. 7 shows example PID traces for a 13.3% CO–water mixed ice at a range of irradiation energies. Photodesorption was not observed for a 6.25% CO–water ice at any energy, even though infrared difference spectra do show spectral changes. This is most likely due to the low sensitivity of the QMS used for the PID measurements. For mixtures containing 13.3%, 23.2% and 41.7% CO, no photodesorption was observed at irradiation energies below 32 mJ. However, above these energies, photodesorption was observed for all ice percentages investigated. It is therefore likely that the changes in the CO spectral region observed for these ice percentages (and illustrated for a 13.3% ice in Fig. 6) arise due to a combination of photodesorption and a change in the CO environment due to the structural changes that occur in the water ice.
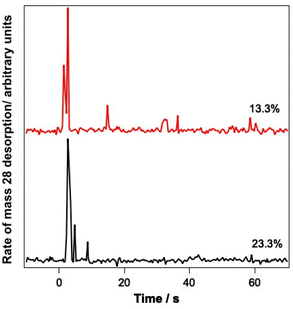
Since the infrared data suggest the re-adsorption of CO during the relatively lengthy experiments described here, studies were also undertaken where pure CO was deliberately dosed on top of the CO–water mixed ices. The resulting ice was then irradiated and PID traces were recorded during the irradiation. Fig. 8 shows the results of these investigations for 13.3% and 23.3% ice mixtures onto which pure CO was deposited.
Fig. 8 clearly shows a strong PID signal for CO due to irradiation at 12 μm. This suggests that CO is being kicked out from the surface because of irradiation of the ice at a wavelength resonant with the water vibrational modes. These data therefore suggest that it is likely that the CO PID that is observed arises from the CO re-adsorbed on top of the ice, as opposed to CO PID occurring due to CO molecules escaping from the mixed ice.
3.4 Mechanism of photodesorption
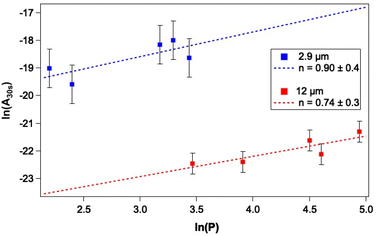
As a first step towards gaining a more detailed insight into the mechanism of CO photodesorption from CO and water-containing ices, the laser power dependence for the process was investigated. Power-dependent studies were undertaken at 2.9 μm and 12 μm using the integrated attenuator in the FEL-2 system to reduce the laser power incident on the sample. Typically, in photodesorption processes, the desorption signal scales with laser power, P, in terms of the number of photons involved in the photodesorption process, n, i.e., Pn. Fig. 7 gives an example of the data recorded in these measurements. Given that the QMS response time is slower than ideally desirable, the initial peak intensity for CO photodesorption was not always recorded accurately. Consequently, the experimental QMS signals were integrated for up to 30 s, after which no further photodesorption was observed. Fig. 9 shows a plot of the natural logarithm of the integrated area of the photodesorption traces up to 30 s (A30s) versus the natural logarithm of the laser power, P, for a range of irradiation energies at 2.9 μm and 12 μm. The gradient of this plot gives n, the photon order. It is clear from Fig. 9 that photodesorption following irradiation at 2.9 μm and 12 μm occurs via a single-photon process (n ≈ 1). The observation that infrared photon-induced photodesorption is a single-photon process means that it is potentially astrophysically relevant as multi-photon processes are unlikely at either stellar or interstellar radiation field fluxes.There are four possible mechanisms that could lead to the observed CO photodesorption from thin films of dispersed CO on porous, amorphous water–CO ices on a metallic substrate:
(i) Photodesorption via resonant excitation of the C–O stretching vibration of CO adsorbed at a surface water molecule, resulting in dissociation along the weak intermolecular interaction coordinate. This is direct resonant photodesorption.
(ii) Photodesorption via resonant excitation of the vibrational modes of water in the surface of the ice to which CO is attached, resulting in dissociation along the weak intermolecular interaction coordinate. This is indirect resonant photodesorption.
(iii) Photodesorption resulting from energy accumulation in the librational heat bath of the bulk solid water substrate following internal vibrational-energy redistribution (IVR). This is photon-induced desorption or, given that in this instance it is driven specifically by a laser, laser-induced desorption (LID).
(iv) Laser-induced thermal desorption (LITD)59–61 in which the metal substrate is heated sufficiently by the laser to raise the local temperature under the laser spot to above the desorption temperature of CO. It is worthwhile noting that this process is dependent on the peak power of the laser and not the average power.62,63
The wavelength dependence of the photodesorption discussed above allows us to begin to explore these mechanisms, as previously demonstrated in studies of benzene photodesorption following excitation at 250 nm of benzene adsorbed on a compact solid water surface.64–66
Excitation of the ice mixtures at 4.67 μm, in resonance with the observed C–O stretching frequency, does not lead to desorption of CO from any ice configuration, at least within the detection limits of our experiment. We can hence conclude that infrared-induced CO photodesorption from dispersed monolayer CO in porous mixtures of CO and water is unlikely to occur via mechanism (i). Why might this be the case? The infrared absorption of adsorbed CO overlays the broad pseudo-continuum associated with the combination band of the solid water libration and H–O–H bend. Classically, as the CO is coupled to the solid water surface via one or more weak hydrogen bonds or van der Waals interactions, this therefore provides a pathway for IVR into modes strongly coupled to the librational heat sink, resulting in relaxation of the CO stretch on the timescale of a few ps.67 An alternative view is that quantum mechanically the narrow CO resonance is coupling to the broad underlying continuum via Fano coupling,68 which provides an efficient relaxation pathway consistent with the lack of photodesorption.
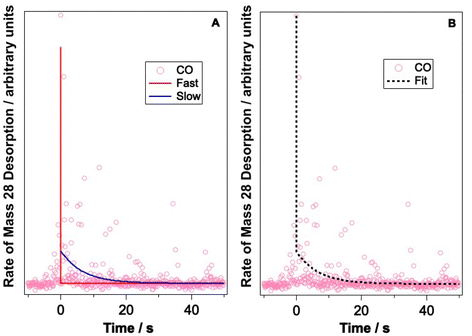
Let us now consider CO photodesorption resulting from excitation of the solid water vibrational modes. Two mechanisms are possible in this instance: (ii) and (iii) above. With reference to the work of Thrower et al.,66 QMS detection of desorbates is biased toward detection of fast processes, while RAIRS is more effective at observing slower processes. The results of both sets of observations must therefore be considered if the photodesorption mechanism is to be identified. The discussion above has focussed on the RAIRS data. To complement these data, photodesorption transients were also recorded using the QMS. Transients recorded during the irradiation of equivalent mixtures at the same wavelength and same average beam energy were co-added to improve the quality of the data. Fig. 10 shows an example of the co-added data recorded by the QMS during the irradiation of a 13.3% CO–water mixture at 2.9 μm with an average beam energy of 8.9–11 mJ. The observed CO photodesorption transient in Fig. 10 is multicomponent in nature, with an apparent “fast” (larger cross-section) and “slow” (small cross-section) desorption process occurring simultaneously.
This type of multicomponent behaviour has previously been observed in studies of benzene desorption from compact ASW following either electron69 or ultraviolet irradiation.66 We will follow the analysis developed in these references given the apparent two-component nature of the observed desorption, and use a bi-exponential function to describe the photodesorption transients:
where σi is the cross-section for the desorption process at the relevant wavelength and ϕi is the laser fluence at the relevant wavelength and energy.
Fig. 10 shows an example of the photodesorption transient data, and the bi-exponential fit to that data, recorded during the irradiation of a 13.3% CO–water ice mixture at 2.9 μm with an average energy of between 8.9–11 mJ. As shown in Fig. 10, the bi-exponential function provides a good fit to the data, suggesting the existence of two components of desorption. Additionally, single-exponential decay and a three-component decay–appearance–decay system were also explored in the fitting of these data. For both alternatives, the fits as described by the correlation coefficient were poorer than the bi-exponential model suggesting that the latter is a better description for the transient decay kinetics. Co-added photodesorption traces for irradiation of 13.3% CO–water mixed ices at 2.9 μm with an average energy of 29 mJ, and for a 13.3% CO–water ice irradiated at 12 μm with an average beam energy of 97.5 mJ, were also fitted with a bi-exponential decay function. The time constants, τi for the two components in all fitted systems are given in Table 2.
| Irradiation wavelength/μm | Average irradiation energy/mJ | ϕ/cm−2 s−1 | τ 1/s | τ 2/s | σ 2/cm2 |
|---|---|---|---|---|---|
| 12 | 97.5 | 6.3 × 10¹⁷ | 0.002 ± 7 | 3.5 ± 1.2 | 4.5 ± 1.6 × 10⁻¹⁹ |
| 2.9 | 9.6 | 1.5 × 10¹⁶ | 3.7 × 10⁻⁵ ± 0.07 | 6.7 ± 0.1 | 9.9 ± 0.1 × 10⁻¹⁸ |
| 2.9 | 29 | 4.5 × 10¹⁶ | 2.5 × 10⁻⁴ ± 0.07 | 4.3 ± 0.5 | 5.2 ± 0.6 × 10⁻¹⁸ |
Table 2 also lists the desorption cross-sections that result from the time constants, derived using the calculated photon fluxes given in Table 2. Cross-sections were not calculated for the fast process because of the large error associated with the time constants for the fast process. This arises because the response time of the QMS is relatively slow and hence it is not able to properly capture faster transient processes. Despite this, we are confident that, at the different wavelengths and energies reported, there is evidence of a fast and a slow desorption process. This is consistent with a combination of process (ii), which is a faster process, and process (iii), which is a slower process, occurring due to infrared irradiation of the CO and water-containing ice.
The cross-sections reported in Table 2 for the infrared photodesorption of CO are for photodesorption driven by the absorption of infrared light at wavelengths corresponding to the O–H stretch and the libration of the solid water substrate. To estimate the efficiency of photodesorption, the quantum yield, it is necessary to compare the CO photodesorption cross-section values with relevant water absorption cross-sections. To date, no infrared absorption cross-sections have been reported in the literature for solid water ice at 2.9 μm and 12 μm. However, an infrared absorption cross-section for dangling O–H bonds in water ice has been reported using transmission spectroscopy to be 1.0 ± 0.2 × 10⁻¹⁸ cm2.70 Although no values exist for absorption cross-sections at other wavelengths, it is possible to estimate these (in a “back of an envelope” calculation) by comparing the strength of the infrared absorption of the dangling O–H bonds with the strength of the water O–H stretching mode and the librational mode. Noble et al.55 show that the peak intensity of the O–H stretching mode at 2.9 μm is some 27 times that of the O–H dangling bond. This gives an absorption cross-section at 2.9 μm of ∼2.7 × 10⁻¹⁷ cm2. Data from Mifsud et al.71 show that the libration band at 12 μm has a peak height roughly 10 times smaller than that of the O–H stretching mode, giving an approximate absorption cross-section at 12 μm of 2.7 × 10⁻¹⁸ cm2. Finally, to give an estimate of the infrared absorption cross-sections at these two wavelengths for ice adsorbed on a metal surface, we need to multiply these two values by the metal surface enhancement factor49 of around 50, since the value reported for the dangling O–H modes was measured using transmission spectroscopy. This gives estimated absorption cross-sections for solid water of 1.4 × 10⁻¹⁶ cm2 and 1.4 × 10⁻¹⁵ cm2 at 12 μm and 2.9 μm, respectively.
Having estimated approximate values for the absorption cross-section of water at 12 μm and 2.9 μm and having shown that both infrared wavelengths result in a single-photon photodesorption process, it is possible to obtain an estimate of the quantum yield for CO photodesorption that occurs following infrared irradiation at these wavelengths. Considering only the slow channel at both wavelengths, given the high uncertainty in the time constants of the fast process, this gives values of the CO photodesorption yields of ∼3 × 10⁻³ per photon at 12 μm and ∼5 × 10⁻³ per photon at 2.9 μm. These values are in good agreement with those previously determined by Öberg and co-workers72 and by Paardekooper et al.37 for VUV photodesorption of CO from solid CO ices.
What of process (iv), LITD? With a typical micropulse peak energy of 40 μJ and pulse width of around 1 ps, the peak power delivered to the metal substrate by the FEL-2 beam is of the order of 40 MW. Even with the relatively gentle focussing employed in the current work, the laser fluence on the metal substrate surface will exceed 100 MW per cm2 per micropulse. This is certainly sufficient for LITD. The question is then whether this process is observed. Ultimately, this is determined by whether the local temperature rise under the laser spot is sufficient to desorb CO. However, it is also determined by the bias in our chosen experimental probes: QMS measurements of transients is biased in favour of sampling fast processes while RAIRS favours detection of slow processes.66 LITD hence may be occurring, but it is likely occurring in parallel with, and hence indistinguishable from, process (iii). Only with future experiments focussing on measuring desorbate time-of-flight distributions will it be possible to disentangle the mechanistic complexities of this system.
4. Conclusions and astrophysical implications
The data reported here show that infrared irradiation of mixed CO–water ices, at wavelengths corresponding to the water O–H stretching and librational modes, leads to changes in the ice that occur because of both rearrangement of the water ice structure and photodesorption of the CO. No effects are seen for irradiation at wavelengths resonant with the C–O stretching mode, at least within our detection limits. No water desorption is observed at any wavelength of irradiation.The observed CO photodesorption arises because of a single-photon excitation process at both wavelengths of irradiation (2.9 μm and 12 μm). Mechanistically, photodesorption transient measurements suggest photodesorption occurs by a combination of fast and slow processes via indirect resonant photodesorption (fast); via photon-induced desorption resulting from energy accumulation in the librational heat bath of the bulk solid water substrate following IVR (slow); and via metal-substrate-mediated laser-induced thermal desorption (slow).
The estimated infrared photodesorption yields at 2.9 μm and 12 μm (respectively ∼5 × 10⁻³ per photon and ∼3 × 10⁻³ per photon) are similar in magnitude to those previously reported72 for VUV photodesorption of CO. Given that VUV and infrared fluxes from the interstellar radiation field are comparable, this would imply that infrared photodesorption may be equivalent to, and perhaps exceed, the impact of VUV radiation in returning CO to the gas phase in cold, dense environments. This effect could slow the accumulation of CO on solid water ice surfaces during gas-cloud collapse from the diffuse toward the dense medium. This, in turn, might delay the onset of the accumulation of simple organics associated with hydrogenation of CO. Opportunities exist today, given the power of the James Webb Space Telescope, to explore this phenomenon.
Author contributions
Emily R. Ingman – experiments, data analysis, writing – original draft, data interpretation and commented on the paper. Domantas Laurinavicius – experiments, data analysis, data interpretation and commented on the paper. Jin Zhang – experiments, data interpretation and commented on the paper. Johanna G. M. Schrauwen – experiments and commented on the paper. Britta Redlich – initiation and management of the project, data interpretation and commented on the paper. Jennifer A. Noble – initiation and management of the project, experiments, data interpretation and commented on the paper. Sergio Ioppolo – initiation and management of the project, experiments, data interpretation and commented on the paper. Martin R. S. McCoustra – initiation and management of the project, experiments, data analysis, writing – original draft, data interpretation and commented on the paper. Wendy A Brown – initiation and management of the project, experiments, data analysis, writing – original draft, data interpretation and commented on the paper.Data Availability
Raw experimental data are available and can be found at http://dx.doi.org/10.25377/sussex.22347769.Conflicts of interest
The authors declare that there are no conflicts of interest that influence the work reported in this paper.Acknowledgements
The authors thank the HFML-FELIX Laboratory team at Radboud University, Nijmegen in the Netherlands, for their experimental assistance and scientific support. The LISA end-station was designed and constructed at the HFML-FELIX Laboratory by the groups of S. Ioppolo and B. Redlich, who also manage the end-station. LISA is funded through the Royal Society University Research Fellowships Renewals 2019 (URF/R/191018), the Royal Society University Research Fellowship (UF130409), the Royal Society Research Fellow Enhancement Award (RGF/EA/180306), and the Royal Society Research Grant (RSG/R1/180418). Travel support is acknowledged from the UK Engineering and Physical Sciences Research Council (UK EPSRC Grant EP/R007926/1 – FLUENCE: Felix Light for the UK: Exploiting Novel Characteristics and Expertise). ERI and DL thank the EPSRC for their provision of funding to enable their PhD studies. SI gratefully acknowledges the Royal Society and the Danish National Research foundation through the Centre of Excellence “Intercat” (grant agreement number DNRF150) for financial support. JAN acknowledges funding from the Agence Nationale de la Recherche (ANR, HYDRAE project ANR-21-CE30-0004-01) and additional support from the French Programme National “Physique et Chimie du Milieu Interstellaire” (PCMI) of the CNRS/INSU with the INC/INP, co-funded by the CEA and the CNES. A. Traspas Muiña is thanked for help with initial experiments on the LISA end-station.References
- B. A. McGuire, Astrophys. J., Suppl. Ser., 2022, 259, 30 CrossRef.
- D. J. Burke and W. A. Brown, Phys. Chem. Chem. Phys., 2010, 12, 5947 RSC.
- E. Herbst, Phys. Chem. Chem. Phys., 2014, 16, 3344–3359 RSC.
- E. L. Gibb, D. C. B. Whittet, A. C. A. Boogert and A. G. G. M. Tielens, Astrophys. J., Suppl. Ser., 2004, 151, 35–73 CrossRef CAS.
- E. L. Gibb, D. C. B. Whittet, W. A. Schutte, A. C. A. Boogert, J. E. Chiar, P. Ehrenfreund, P. A. Gerakines, J. v. Keane, A. G. G. M. Tielens, E. F. van Dishoeck and O. Kerkhof, Astrophys. J., 2000, 536, 347–356 CrossRef.
- K. I. Öberg, A. C. A. Boogert, K. M. Pontoppidan, S. van den Broek, E. F. van Dishoeck, S. Bottinelli, G. A. Blake and N. J. Evans, Astrophys. J., 2011, 740, 109 CrossRef.
- E. Dartois, Space Sci. Rev., 2005, 119, 293–310 CrossRef CAS.
- M. K. McClure, W. R. M. Rocha, K. M. Pontoppidan, N. Crouzet, L. E. U. Chu, E. Dartois, T. Lamberts, J. A. Noble, Y. J. Pendleton, G. Perotti, D. Qasim, M. G. Rachid, Z. L. Smith, F. Sun, T. L. Beck, A. C. A. Boogert, W. A. Brown, P. Caselli, S. B. Charnley, H. M. Cuppen, H. Dickinson, M. N. Drozdovskaya, E. Egami, J. Erkal, H. Fraser, R. T. Garrod, D. Harsono, S. Ioppolo, I. Jiménez-Serra, M. Jin, J. K. Jørgensen, L. E. Kristensen, D. C. Lis, M. R. S. McCoustra, B. A. McGuire, G. J. Melnick, K. I. Öberg, M. E. Palumbo, T. Shimonishi, J. A. Sturm, E. F. van Dishoeck and H. Linnartz, Nat. Astron., 2023, 7, 431–443 CrossRef.
- J. M. Greenberg, Astrophys. Space Sci., 1986, 128, 17–31 CrossRef CAS.
- D. A. Williams and E. Herbst, Surf. Sci., 2002, 500, 823–837 CrossRef CAS.
- D. Bockelée-Morvan and N. Biver, Philos. Trans. R. Soc., A, 2017, 375, 20160252 CrossRef PubMed.
- R. Visser, E. F. van Dishoeck, S. D. Doty and C. P. Dullemond, Astron. Astrophys., 2009, 495, 881–897 CrossRef CAS.
- F. Dulieu, L. Amiaud, E. Congiu, J.-H. Fillion, E. Matar, A. Momeni, V. Pirronello and J. L. Lemaire, Astron. Astrophys., 2010, 512, A30 CrossRef.
- A. Rosu-Finsen, D. Marchione, T. L. Salter, J. W. Stubbing, W. A. Brown and M. R. S. McCoustra, Phys. Chem. Chem. Phys., 2016, 18, 31930–31935 RSC.
- K. M. Pontoppidan, A. C. A. Boogert, H. J. Fraser, E. F. van Dishoeck, G. A. Blake, F. Lahuis, K. I. Öberg, N. J. Evans II and C. Salyk, Astrophys. J., 2008, 678, 1005–1031 CrossRef CAS.
- J. M. Greenberg, Astrophys. Space Sci., 1976, 39, 9–18 CrossRef CAS.
- S. S. Prasad and S. P. Tarafdar, Astrophys. J., 1983, 267, 603 CrossRef CAS.
- L. J. Allamandola, M. P. Bernstein, S. A. Sandford and R. L. Walker, Space Sci. Rev., 1999, 90, 219–232 CrossRef CAS PubMed.
- M. H. Moore, B. Donn, R. Khanna and M. F. A’Hearn, Icarus, 1983, 54, 388–405 CrossRef CAS.
- C. J. Bennett, C. S. Jamieson, Y. Osamura and R. I. Kaiser, Astrophys. J., 2006, 653, 792–811 CrossRef CAS.
- A. G. M. Abdulgalil, A. Rosu-Finsen, D. Marchione, J. D. Thrower, M. P. Collings and M. R. S. McCoustra, ACS Earth Space Chem., 2017, 1, 209–215 CrossRef CAS.
- A. G. M. Abdulgalil, D. Marchione, J. D. Thrower, M. P. Collings, M. R. S. McCoustra, F. Islam, M. E. Palumbo, E. Congiu and F. Dulieu, Philos. Trans. R. Soc., A, 2013, 371, 20110586 CrossRef CAS PubMed.
- R. I. Kaiser, G. Eich, A. Gabrysch and K. Roessler, Astrophys. J., 1997, 484, 487–498 CrossRef CAS.
- E. Herbst and E. F. van Dishoeck, Annu. Rev. Astron. Astrophys., 2009, 47, 427–480 CrossRef CAS.
- M. Guélin and J. Cernicharo, Front. Astron. Space Sci., 2022, 9, 787567 CrossRef.
- J. S. Mathis, P. G. Mezger and N. Panagia, Astron. Astrophys., 1983, 128, 212–229 CAS.
- G. E. Ewing and G. C. Pimentel, J. Chem. Phys., 1961, 35, 925–930 CrossRef CAS.
- W. Hagen, A. G. G. M. Tielens and J. M. Greenberg, Chem. Phys., 1981, 56, 367–379 CrossRef CAS.
- E. Seperuelo Duarte, A. L. F. de Barros, E. F. da Silveira, A. Domaracka, P. Boduch and H. Rothard, Mon. Not. R. Astron. Soc., 2021, 508, 4297–4309 CrossRef CAS.
- S. A. Sandford, L. J. Allamandola, A. G. G. M. Tielens and G. J. Valero, Astrophys. J., 1988, 329, 498 CrossRef CAS PubMed.
- B. Schmitt, J. M. Greenberg and R. J. A. Grim, Astrophys. J., 1989, 340, L33 CrossRef CAS.
- M. E. Palumbo, J. Phys. Chem. A, 1997, 101, 4298–4301 CrossRef CAS.
- C. Manca, C. Martin, A. Allouche and P. Roubin, J. Phys. Chem. B, 2001, 105, 12861–12869 CrossRef CAS.
- M. P. Collings, J. W. Dever, H. J. Fraser, M. R. S. McCoustra and D. A. Williams, Astrophys. J., 2003, 583, 1058–1062 CrossRef CAS.
- M. Minissale, Y. Aikawa, E. Bergin, M. Bertin, W. A. Brown, S. Cazaux, S. B. Charnley, A. Coutens, H. M. Cuppen, V. Guzman, H. Linnartz, M. R. S. McCoustra, A. Rimola, J. G. M. Schrauwen, C. Toubin, P. Ugliengo, N. Watanabe, V. Wakelam and F. Dulieu, ACS Earth Space Chem., 2022, 6, 597–630 CrossRef CAS.
- R. S. Smith, R. A. May and B. D. Kay, J. Phys. Chem. B, 2016, 120, 1979–1987 CrossRef CAS PubMed.
- D. M. Paardekooper, G. Fedoseev, A. Riedo and H. Linnartz, Astron. Astrophys., 2016, 596, A72 CrossRef.
- M. Bertin, E. C. Fayolle, C. Romanzin, K. I. Öberg, X. Michaut, A. Moudens, L. Philippe, P. Jeseck, H. Linnartz and J.-H. Fillion, Phys. Chem. Chem. Phys., 2012, 14, 9929 RSC.
- C. Cecchi-Pestellini and S. Aiello, Mon. Not. R. Astron. Soc., 1992, 258, 125–133 CrossRef CAS.
- A. Krasnopoler and S. M. George, J. Phys. Chem. B, 1998, 102, 788–794 CrossRef CAS.
- C. Focsa, B. Chazallon and J. L. Destombes, Surf. Sci., 2003, 528, 189–195 CrossRef CAS.
- J. A. Noble, H. M. Cuppen, S. Coussan, B. Redlich and S. Ioppolo, J. Phys. Chem. C, 2020, 124, 20864–20873 CrossRef CAS.
- H. M. Cuppen, J. A. Noble, S. Coussan, B. Redlich and S. Ioppolo, J. Phys. Chem. A, 2022, 126, 8859–8870 CrossRef CAS PubMed.
- S. Ioppolo, J. A. Noble, A. Traspas Muiña, H. M. Cuppen, S. Coussan and B. Redlich, J. Mol. Spectrosc., 2022, 385, 111601 CrossRef CAS.
- J. C. Santos, K.-J. Chuang, J. G. M. Schrauwen, A. Traspas Muiña, J. Zhang, H. M. Cuppen, B. Redlich, H. Linnartz and S. Ioppolo, Astron. Astrophys., 2023, 672, 112 CrossRef.
- G. A. Kimmel, K. P. Stevenson, Z. Dohnálek, R. S. Smith and B. D. Kay, J. Chem. Phys., 2001, 114, 5284–5294 CrossRef CAS.
- J. Lasne, A. Rosu-Finsen, A. Cassidy, M. R. S. McCoustra and D. Field, Phys. Chem. Chem. Phys., 2015, 17, 30177–30187 RSC.
- A. Rosu-Finsen, J. Lasne, A. Cassidy, M. R. S. McCoustra and D. Field, Phys. Chem. Chem. Phys., 2016, 18, 5159–5171 RSC.
- R. G. Greenler, J. Vac. Sci. Technol., 1975, 12, 1410–1417 CrossRef.
- M. P. Collings, J. Dever, H. J. Fraser and M. R. S. McCoustra, Astrophys. Space Sci., 2003, 285, 633–659 CrossRef CAS.
- G. E. Ewing and G. C. Pimentel, J. Chem. Phys., 1961, 35, 925–930 CrossRef CAS.
- G. E. Ewing, J. Chem. Phys., 1962, 37, 2250–2256 CrossRef CAS.
- H. Vu, M. R. Atwood and B. Vodar, J. Chem. Phys., 1963, 38, 2671–2677 CrossRef CAS.
- L. Marchese, S. Coluccia, G. Martra and A. Zecchina, Surf. Sci., 1992, 269–270, 135–140 CrossRef CAS.
- J. A. Noble, C. Martin, H. J. Fraser, P. Roubin and S. Coussan, J. Phys. Chem. Lett., 2014, 5, 826–829 CrossRef CAS PubMed.
- J. A. Noble, C. Martin, H. J. Fraser, P. Roubin and S. Coussan, J. Phys. Chem. C, 2014, 118, 20488–20495 CrossRef CAS.
- S. Coussan, P. Roubin and J. A. Noble, Phys. Chem. Chem. Phys., 2015, 17, 9429–9435 RSC.
- S. Coussan, J. A. Noble, H. M. Cuppen, B. Redlich and S. Ioppolo, J. Phys. Chem. A, 2022, 126, 2262–2269 CrossRef CAS PubMed.
- D. P. Land, C. L. Pettiette-Hall, J. C. Hemminger and R. T. McIver, Acc. Chem. Res., 1991, 24, 42–47 CrossRef CAS.
- D. P. Land, T. L. Tai, J. M. Lindquist, J. C. Hemminger and R. T. McIver, Anal. Chem., 1987, 59, 2924–2927 CrossRef CAS.
- S. M. George, ed. B. W. Rossiter and R. C. Baetzold, Investigations of surfaces and interfaces - part A, Wiley, 1993, 2nd edn, pp. 452–498 Search PubMed.
- J. L. Brand and S. M. George, Surf. Sci., 1986, 167, 341–362 CrossRef CAS.
- A. A. Deckert and S. M. George, Surf. Sci., 1987, 182, L215–L220 CrossRef CAS.
- J. D. Thrower, A. G. M. Abdulgalil, M. P. Collings, M. R. S. McCoustra, D. J. Burke, W. A. Brown, A. Dawes, P. J. Holtom, P. Kendall, N. J. Mason, F. Jamme, H. J. Fraser and F. J. M. Rutten, J. Vac. Sci. Technol., A, 2010, 28, 799 CrossRef CAS.
- J. D. Thrower, M. P. Collings, M. R. S. McCoustra, D. J. Burke, W. A. Brown, A. Dawes, P. D. Holtom, P. Kendall, N. J. Mason, F. Jamme, H. J. Fraser, I. P. Clark and A. W. Parker, J. Vac. Sci. Technol., A, 2008, 26, 919 CrossRef CAS.
- J. D. Thrower, D. J. Burke, M. P. Collings, A. Dawes, P. D. Holtom, F. Jamme, P. Kendall, W. A. Brown, I. P. Clark, H. J. Fraser, M. R. S. McCoustra, N. J. Mason and A. W. Parker, Astrophys. J., 2008, 673, 1233–1239 CrossRef CAS.
- S. Taj, D. Baird, A. Rosu-Finsen and M. R. S. McCoustra, Phys. Chem. Chem. Phys., 2017, 19, 7990–7995 RSC.
- A. E. Miroshnichenko, S. Flach and Y. S. Kivshar, Rev. Mod. Phys., 2010, 82, 2257–2298 CrossRef CAS.
- J. D. Thrower, M. P. Collings, F. J. M. Rutten and M. R. S. McCoustra, Chem. Phys. Lett., 2011, 505, 106–111 CrossRef CAS.
- T. Nagasawa, R. Sato, T. Hasegawa, N. Numadate, N. Shioya, T. Shimoaka, T. Hasegawa and T. Hama, Astrophys. J., Lett., 2021, 923, L3 CrossRef.
- D. V. Mifsud, P. A. Hailey, P. Herczku, Z. Juhász, S. T. S. Kovács, B. Sulik, S. Ioppolo, Z. Kaňuchová, R. W. McCullough, B. Paripás and N. J. Mason, Eur. Phys. J. D, 2022, 76, 87 CrossRef CAS.
- K. I. Öberg, E. F. van Dishoeck and H. Linnartz, Astron. Astrophys., 2009, 496, 281–293 CrossRef.
| This journal is © The Royal Society of Chemistry 2023 |

