Evaluation of calibration approaches for quantitative analysis of sludge by laser induced breakdown spectrometry
Fernanda Ferreira
Thiengo
a,
Aline
de Carvalho Elias
a,
Maciel Santos
Luz
b,
Danielle Polidório
Intima
c,
Ivanise
Gaubeur
d,
Juliana
Naozuka
e,
Fábio Rodrigo
Piovezani Rocha
 f and
Cassiana Seimi
Nomura
 *a
*a
aDepartamento de Química Fundamental, Instituto de Química, Universidade de São Paulo, São Paulo, SP, Brazil. E-mail: csnomura@iq.usp.br
bLaboratório de Processos Metalúrgicos, Instituto de Pesquisas Tecnológicas do Estado de São Paulo, São Paulo, SP, Brazil
cCompanhia de Saneamento Básico do Estado de São Paulo, São Paulo, SP, Brazil
dCentro de Ciências Naturais e Humanas, Universidade Federal do ABC, Santo André, SP, Brazil
eUniversidade Federal de São Paulo, Departamento de Química, Diadema, SP, Brazil
fCentro de Energia Nuclear na Agricultura, Universidade de São Paulo, Piracicaba, SP, Brazil
First published on 29th October 2022
Abstract
Sludge is a semi-solid organic waste from sewage treatment stations, whose disposal is a serious environmental issue. Application as a soil fertilizer is feasible due to its high organic matter and nutrient (e.g. Ca, Fe, Zn, and Cu) contents, but it critically depends on a previous chemical analysis. In this sense, laser-induced breakdown spectrometry (LIBS) deserves attention for skipping sample decomposition and due to the multi-elementary capacity. LIBS quantitative analysis requires proper calibration approaches to overcome matrix effects, mainly for complex samples as sludge. This work aims to propose an analytical method to directly determine Ca, Fe, Zn, and Cu in sludge by LIBS, after the evaluation of different calibration approaches: external calibration (EC), internal standard calibration (ISC), multi-energy calibration (MEC) and slope ratio calibration (SRC). EC, carried out using four certified reference materials (CRMs) with a similar composition to sludge samples, did not yield accurate analytical results. The differences between sample and standard ablated masses were successfully compensated for using carbon as the internal standard, except for Cu. MEC yielded accurate results for all analytes (relative errors <5%), requiring only a single standard for calibration. Its main drawback is the need for at least 3 interference-free emission lines. The simplest and more practical calibration approach, also applicable with a single standard, but requiring only the response monitored at a single emission wavelength, was SRC, which yielded accurate results, as demonstrated by agreement with certified values at the 95% confidence level and relative errors <21%.
1. Introduction
A sewage treatment station (STS) provides an important environmental service to society by collecting and treating millions of liters of sewage daily, avoiding this material reaching water bodies. However, as a result, it generates tons of sludge consisting of a semi-solid organic waste, containing a range of inorganic components, including nutrients and potentially toxic elements.1 The final disposal of residual sludge from STS is a serious environmental issue worldwide and the concern about its management is real.2 Some alternatives include its use as a component of civil construction materials, disposal in sanitary landfills or a controlled application in soils as a fertilizer (e.g. source of organic matter and nutrients such as Ca, Fe, Zn, and Cu)3,4 or a soil conditioner.5 The use in agriculture may improve the physical, chemical, and biological properties of soil, thus increasing productivity.6,7 On the other hand, potentially toxic elements or compounds and pathogenic microorganisms should be taken into account.8 For all these reasons, sludge samples require chemical characterization before destination, but the quantification of elemental species in this kind of samples is not an easy task. For most spectroscopic methods, prior dissolution is required. However, the available approaches are time-consuming and even using acid mixtures and modern microwave oven systems, which combine high pressure and temperature, and the dissolution is not complete.9 Thus, methods for direct solid sample analysis with minimum or without sample treatment are interesting alternatives.10In this context, laser-induced breakdown spectrometry (LIBS) deserves attention, as one of the most promising and powerful analytical methods for the direct analysis of solid samples. LIBS has gained popularity and found applications in several fields due to a set of unique advantages, including multi-element analysis capability, fast response, microanalytical capability (less than 100 μg of sample consumed per analysis), ease of use, and possibility of carrying out remote and in situ analysis because of the availability of portable instruments.11,12 On the other hand, LIBS shows some challenges, which need to be overcome in order to be competitive with other well-established instrumental methods.13
Quantitative measurements in complex matrices have still been considered the “Achilles heel” of LIBS due to the pronounced matrix effects caused by the complex laser-sample interaction processes. Moreover, its inherent microanalytical characteristic may hinder precision due to the natural heterogeneity of solid samples.14 Achieving reliable results depends on the use of adequate calibration strategies, which is a challenge when dealing with direct solid analysis because of the lack of reference materials covering all intended applications. This is also a drawback for other matrix-dependent methods, such as laser ablation inductively coupled plasma optical emission spectrometry (LA-ICP OES) or mass spectrometry (LA-ICP-MS).15 The most common approach for quantitative analysis by LIBS is external standard calibration (EC) based on a set of certified reference materials (CRMs) as solid standards.16 As EC is usually based on multiple-point calibration, at least 3 standards similar in physical and chemical properties with the sample and covering the range of mass fractions for all analytes are required. Considering that most CRMs are not certified for sample amounts required in LIBS analysis and the restricted availability of CRMs with similar matrices and suitable analyte mass fractions, the use of EC may be somewhat difficult.17
Due to the low precision often associated with laser-based techniques, internal standard calibration (ISC) methods have been exploited to correct variations in the ablation rate caused by instrument drifts and instabilities.18–21 Normalizing analyte emission signals with those for the internal standard can also compensate for the differences in ablated masses between craters and to correct some matrix effects.22 In direct solid sample analysis, the internal standard is usually a major constituent element found at constant concentration in the sample and standards.15,23
An alternative calibration approach for LIBS is based on synthetic standards prepared by spiking increasing amounts of analytes onto a diluent such as cellulose powder,24,25 paraffin wax,26 paper,27 and alginin.28 Standard addition calibration by spiking increasing amounts of analytes onto the original sample29 or diluting the original sample is also usual.30 Recently, the multi-energy calibration (MEC) method was successfully applied to circumvent matrix effects in the analysis of cattle mineral supplements31 and nickeliferous ores32 by LIBS. The main advantage of this approach is the need for only one standard, but it is important to highlight that its effectiveness depends on the availability of at least three interference-free analytical emission lines.33
A novel calibration approach was proposed by Nunes et al.34 in the analysis of plant samples by LIBS. The slope ratio calibration (SRC) approach explores the proportionality of emission line intensities and the number of accumulated laser pulses for the sample and a single solid standard with a similar matrix. SRC yielded better accuracy than EC and single-point calibration, showing a lower dependence of the sample matrix than these approaches. A further application succeeded for the determination of rare earth elements in hard disk magnets.35
This work proposes a LIBS method for direct determination of Ca, Fe, Zn, and Cu in sludges. By considering the matrix complexity, different calibration approaches (EC, ISC, MEC, and SRC) were evaluated aiming to achieve accurate results. Furthermore, to our knowledge, LIBS was pioneeringly applied to sewage sludge quantitative analysis.
2. Experimental
2.1. Instrumentation
Measurements were carried out with a commercial J200 Tandem LIBS system (Applied Spectra, CA, USA), with a Q-switched Nd:YAG laser operating at 266 nm, 10 Hz repetition rate, maximum of 25 mJ per pulse, and a CCD spectrometer (Aurora, Applied Spectra, USA) with a spectral range from 186 to 1044 nm and a spectral resolution of 0.067 nm. Clarity software (Applied Spectra, CA, USA) was used for data treatment and processing, including monitoring of emission spectra, identification of emission peaks, correction of background signals, and integration of the peak areas.The sludge sample was air-dried (Fanem, SP, Brazil) and ground in an automatic agate mortar and pestle mill (Retsch, Germany). For LIBS experiments, the sample was pelletized using an automatic hydraulic press (Xpress 3635, Spex SamplePrep, UK). Acid decomposition was carried out in a high-pressure microwave oven (ETHOS UP, Milestone connect, Italy).
2.2. Materials and solutions
Aqueous solutions were prepared using high-purity water (resistivity >18 MΩ cm) obtained from a Milli-Q purification system (Millipore, Bedford, MA, USA). For ICP OES method calibration, solutions were prepared in 1% (v v−1) nitric acid by serial dilutions of stock solutions containing 1000 mg L−1 of Ca, Zn, and Cu (Merck, Germany). Microwave-assisted acid decomposition was conducted using a mixture of nitric acid (65% w w−1) and hydrochloric acid (37% w w−1), both from Merck, Germany. Cellulose (SPEX SamplePrep PrerAid, NJ, EUA) was used as a binder for the pressed pellets. Certified reference materials (CRM) of sewage sludge (Trace Metals – Sewage Sludge 2, CRM029) from Supelco (Sigma-Aldrich, Germany) and domestic sludge (SRM 2781) from the National Institute of Standards and Technology (NIST, Gaithersburg, MD, USA) were used for accuracy assessment. All solutions and samples were stored in decontaminated polypropylene bottles (Nalge Company, Rochester, NY, USA).2.3. Sample preparation and LIBS operational parameters
A sludge sample was obtained from the ABC Wastewater Treatment Plant, located in the metropolitan area of São Paulo city, São Paulo State, Brazil. The Basic Sanitation Company of the State of São Paulo (SABESP) operates and maintains this STS, and the sludge is generated after biological treatment. The water excess is removed through a filter press, and calcium oxide and ferric chloride are added for chemical and biological stabilization, at the end of the wastewater treatment processes.After collection, the sludge sample was air-dried to a constant mass at 50 ± 5 °C for 7 days. The sludge was then ground and homogenized in an agate mortar for 10 min, and stored in polypropylene bottles. The reference values of the analytes determined by ICP OES are: Ca (19.7 ± 0.1 wt%), Zn (1429 ± 78 mg kg−1), Cu (328 ± 4 mg kg−1), and Fe (3.0 ± 0.2 wt%).
For LIBS instrumental parameter optimization, sample pellets were prepared by transferring 0.35 g of the ground sample and 0.15 g of cellulose binder to a 13 mm die set and applying 8 ton cm−2 for 5 min. The pellets were approximately 3 mm thick, with a 13 mm diameter. The LIBS operational parameters, i.e. delay time (0.1 to 1.0 μs), laser spot size (35 to 140 μm), laser pulses (134 to 405), and laser energy (5 to 20 mJ), were optimized with a univariate approach aiming at a higher sensitivity and signal-to-background ratio (SBR) for all selected emission lines.
In order to identify the analyte emission lines in the spectrum, a prior analysis of the sludge was carried out by LIBS with the operational parameters optimized by Carvalho et al.33 The LIBS operational parameters were 0.25 μs delay time, spot size of 65 μm, 267 laser pulses and 20 mJ of laser energy (fluence of 603 J cm−2).
Measurements were based on the most sensitive atomic (I) and ionic (II) emission lines with no evidence of spectral interference or self-absorption for Ca (I 422.630, I 442.480, I 487.72, I 504.113, II 315.930, II 317.951, II 370.574, and II 854.285 nm), Fe (I 438.370, I 302.024, II 234.255, II 239.430, II 259.866, and II 274.978 nm), Zn (II 202.530 and II 206.163 nm), Cu (I 324.770 and I 327.374 nm), and C (I 193.160 nm), the latter taken as the internal standard. The results were based on the peak areas of the corresponding emission lines after averaged background subtraction.
Four calibration approaches were investigated: external standard calibration (EC), internal standard calibration (ISC), multi-energy calibration (MEC) and slope ratio calibration (SRC). EC and ISC were carried out with three CRMs from NIST (Gaithersburg, MD, USA) and one from Supelco (Supelco, Sigma Aldrich, Germany): SRM695 (Trace Elements in Multi-Nutrient Fertilizer), SRM694 (Phosphate Rock), SRM679 (Brick Clay) and CRM029. All standards were pelletized using the procedure described above. The MEC method requires two pressed pellets prepared from the sample plus either a standard or diluent. Pellet 1 was prepared from a mixture of 0.175 g of CRM029, 0.175 g of sludge sample, and 0.150 g of cellulose, whereas pellet 2 was prepared from a mixture of 0.175 g of sludge sample and 0.325 g of cellulose. Analytical signals at the selected wavelengths for both test samples were correlated (pellet 2 versus pellet 1) and the analyte amount in the sample was determined from the slope of the resulting calibration curve.33 For SRC, the pelletized test samples were composed of 0.35 g of CRM029 (or sludge sample) mixed to 0.15 g of cellulose binder. Analyte emission peak areas (I) were plotted as a function of the number of accumulated laser pulses, Np (101, 151, 267, 321, and 405) either in the calibration standard or in the sample. The unknown mass fractions in the test sample were calculated from the ratio between the slopes of the standard and the test sample ablated mass functions (I versus Np graphs), and the analyte mass fraction in the standard.34
All pressed pellets analyzed by LIBS were introduced into an ablation chamber equipped with an automatic x–y–z position adjust, where equally spaced sampling lines per sample were scanned with a rastering rate of 0.15 mm s−1. When using the raster mode, the LIBS operating software changes conditionally the laser pulse, spot size and rastering speed parameters to avoid crater overlap. In this way, for 134, 270 and 405 laser pulses, lines of 2.00, 4.04 and 6.06 mm were respectively made considering the same spot size.
3. Results and discussion
3.1. LIBS instrumental optimization
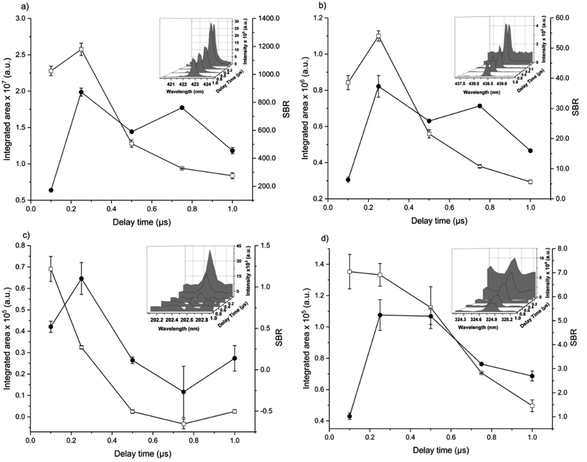
The analytical performance of LIBS is related to laser–matter interaction and the effects of plasma parameters on the optical emission. The effects of the instrumental parameters affecting these processes,36i.e. delay time, spot size, laser energy, and number of laser pulses, were evaluated by monitoring the integrated area of atomic/ionic emission lines and SBR.The effect of the delay time was investigated using a spot size of 65 μm, and 405 accumulated laser pulses at 20 mJ per pulse (Fig. 1).
The aim was to maximize analyte emission and minimize the continuum, mainly related to bremsstrahlung (free-free) and recombination (free-bound) events.30 As usual in LIBS, the background continuum decayed more pronouncedly with the delay time than the analyte spectral emission. Considering the compromise between the integrated areas and the SBR of Ca, Fe, Zn, and Cu, a delay time of 0.25 μs was chosen.
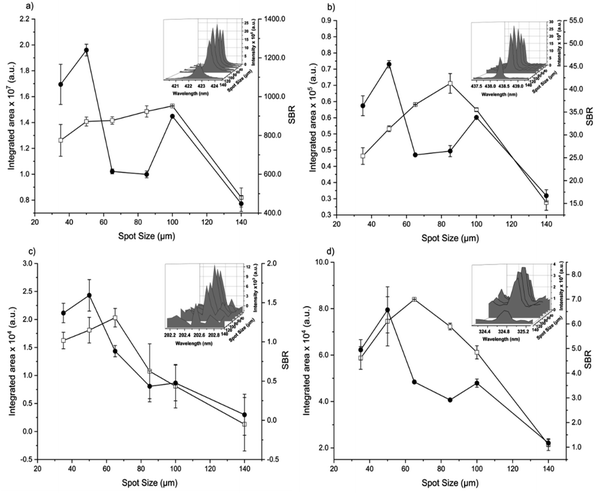
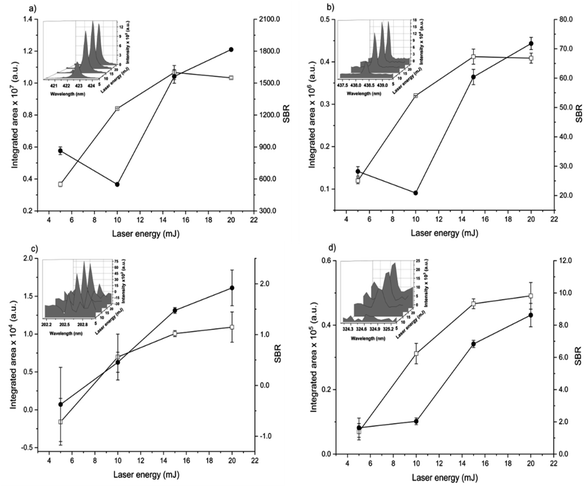
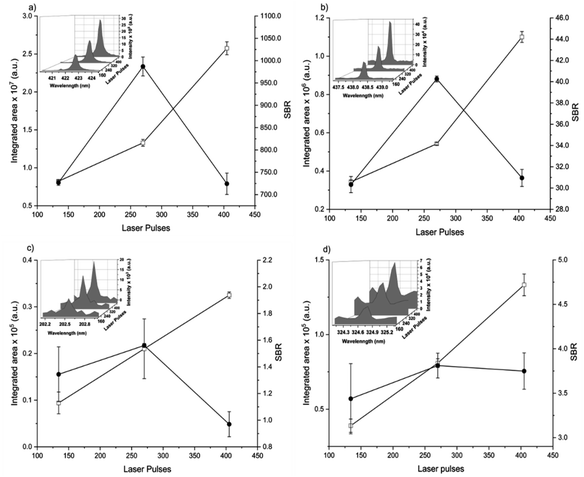
The spot size affects both the ablated mass and fluence, thus yielding curves with maximum values of the emission intensity for all analytes (100 μm for Ca, 85 μm for Fe, and 65 μm for Zn and Cu), Fig. 2. The higher laser fluences achieved for smaller spot sizes favored the analyte excitation processes; however, for spot sizes of the sludge sample (<50 μm), the effect was not observed due to the decrease of the ablated mass and thus the number of atoms in the plasma. Under these conditions, the precision was also lessened. Considering the integrated areas and the uppermost SBR for all analytes, a spot size of 50 μm was chosen. Both emission intensity and SBR increased with the laser energy (Fig. 3), because of enhancement in the ablation efficiency and atomization/excitation processes within the laser-induced plasma.26 Thus, 20 mJ per pulse was chosen for further measurements. The integrated area of each analyte emission line increased with the number of laser pulses from 134 to 405, due to the higher ablated mass (Fig. 4). However, the SBR decreased from 405 laser pulses, which may be related to light scattering, self-absorption processes, or both. In this sense, 270 laser pulses were selected for all analytes, except when SRC was evaluated.
By considering the previous discussion, the best analytical performance was achieved with a laser energy of 20 mJ per pulse, delay time of 0.25 μs, laser spot size of 50 μm (fluence of 1 kJ cm−2), and 270 accumulated laser pulses per site. These parameters were selected for further experiments.
When comparing SBR values before and after optimization, the gain was about 279, 244, 113 and 183% for Ca, Fe, Zn and Cu, respectively, for the same emission lines. The main difference is due to the smaller spot size, which resulted in higher fluency after optimization.
3.2. External standard calibration (EC) and internal standard calibration (ISC)
External standard calibration (EC) is the most usual approach for calibration in LIBS, but it depends on a set of CRMs with similar matrix composition covering the range of analyte amounts. EC was evaluated for sludge analysis taking four CRMs in a calibration range of 0.16 to 31.14% for Ca, 0.55 to 9.05% for Fe, 0.02 to 0.33% for Zn, and 0 to 1225 mg kg−1 for Cu.Calibration curve equations derived from EC are shown in Table 1. Although good determination coefficients (r2) were found, the analysis of the sludge sample showed a low accuracy due to the matrix effects, e.g. on the ablation process and/or atomization efficiency.
| Analyte – emission line (nm) | Certified reference materials – mass fractions | Calibration equation | r 2 | Reference value | Found value | |||
|---|---|---|---|---|---|---|---|---|
| SRM695 | SRM694 | SRM679 | CRM029 | |||||
| a Mass fraction (x) expressed as (a) wt% and (b) mg kg−1; y: peak emission integrated area. | ||||||||
| Ca(I) 422.630 | 2.26 ± 0.04a | 31.1 ± 0.4a | 0.1628 ± 0.0013a | 48![[thin space (1/6-em)]](https://www.rsc.org/images/entities/char_2009.gif) 400 ± 2160b 400 ± 2160b |
y = 429![[thin space (1/6-em)]](https://www.rsc.org/images/entities/char_2009.gif) 880x + 2 × 10⁶ 880x + 2 × 10⁶ |
0.977 | 19.7 ± 0.1a | 26 ± 3a |
| Fe(I) 302.024 | 3.99 ± 0.08a | 0.55 ± 0.06a | 9.05 ± 0.21a | 20![[thin space (1/6-em)]](https://www.rsc.org/images/entities/char_2009.gif) 700 ± 1360b 700 ± 1360b |
y = 24![[thin space (1/6-em)]](https://www.rsc.org/images/entities/char_2009.gif) 389x + 45 389x + 45![[thin space (1/6-em)]](https://www.rsc.org/images/entities/char_2009.gif) 413 413 |
0.970 | 3.0 ± 0.2a | 6 ± 1a |
| Zn(II) 202.530 | 0.325 ± 0.005a | 0.15 ± 0.02a | 150 ± 10b | 1400 ± 33.8b |
y = 99![[thin space (1/6-em)]](https://www.rsc.org/images/entities/char_2009.gif) 711x + 3362 711x + 3362 |
0.923 | 1429 ± 78b | 2062 ± 688b |
| Cu(I) 327.374 | 1225 ± 9b | — | — | 1100 ± 24b | y = 66.52x + 1168 | 0.975 | 328 ± 4b | 677 ± 31b |
ISC has been exploited to correct instrumental interference, rectify nonlinear behavior in calibration curves and improve accuracy.37
In LIBS, ISC may compensate for changes in laser energy, ablated mass, and other instrumental shifts associated with the physical characteristics of the sample and its environment. The analyte-to-IS signal ratio is used as the independent variable in the calibration function,38 but achieving accurate results critically depends on proper selection of the internal standard. The use of C as an internal standard in LIBS analysis was previously proposed for several matrices,39–41,43 according to Uhl et al.,21 since C can be found in a high mass fraction in a variety of sample matrices and the variation between different types of samples is not significant. As the sewage sludge is mostly composed of organic matter,42 C was evaluated as an internal standard, taking the C(I) 193.160 nm emission line as the measurement basis. The equations of the corresponding calibration curves are presented in Table 2.
| Analyte – emission line (nm) | Calibration equation | r 2 | Reference value | Found value | LOD | LOQ |
|---|---|---|---|---|---|---|
| a Mass fraction (x) expressed as (a) wt% and (b) mg kg−1; y: peak emission integrated area. | ||||||
| Ca(I) 422.630 | y = 11.023x + 46.947 | 0.992 | 19.7 ± 0.1a | 21 ± 1a | 0.007a | 0.022a |
| Fe(I) 302.024 | y = 0.618x + 1.596 | 0.999 | 3.0 ± 0.2a | 3.7 ± 0.5a | 0.21a | 0.69a |
| Zn(II) 202.530 | y = 1.938x + 0.162 | 0.988 | 1429 ± 78b | 1731 ± 639b | 218b | 719b |
| Cu(I) 327.374 | y = 0.0021x + 0.0458 | 0.947 | 328 ± 4b | 461 ± 31b | 5.5b | 18.2b |
For Ca, Fe, and Zn, the use of C as an internal standard improved the calibration curve determination coefficients (r2) and the accuracy of the LIBS method, as no significant differences were found at the 95% confidence level (t-test) between mass fractions determined by the ISC method and reference values (relative errors < 24%). This indicates that the C internal standard compensated for differences in CRMs and sludge sample matrices succeeding in calibration for the determination of Ca, Fe, and Zn in the samples.
The limits of detection (LOD) and quantification (LOQ) were calculated (Table 2) according to IUPAC recommendations45 by the expression ksd/a, in which sd is the standard deviation of blank measurements (n = 10), k is a numerical factor chosen according to the confidence level (k = 3 for the 99.7% confidence level) and a is the calibration sensitivity (i.e. slope of the calibration curve) obtained for the ISC method. A pure cellulose pressed pellet was used as the blank. The LOQ was estimated as 3.3 times the LOD.
3.3. Multi-energy calibration (MEC)
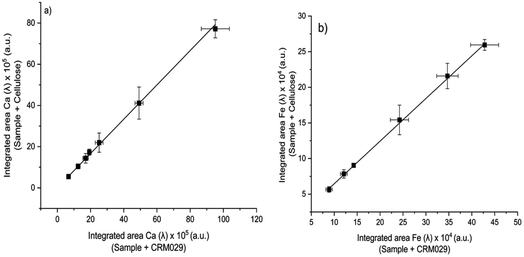
Because MEC requires only one standard for calibration, this approach was evaluated as a more practical alternative for the analysis of sludge samples by LIBS. Analytical calibration curves were obtained by running two pressed pellets separately and plotting I(λi)sample + blank (from pressed pellet 2) vs. I(λi)sample + standard (from pressed pellet 1), in which I(λi) represents the integrated areas free of spectral interference wavelengths (Fig. 5). Among atomic (I) and ionic lines (II), eight wavelengths were selected for Ca (I 422.630, I 442.480, I 487.72, I 504.113, II 315.930, II 317.951, II 370.574, and II 854.285 nm), six for Fe (I 438.370, I 302.024, II 234.255, II 239.430, II 259.866, and II 274.978 nm), but only two wavelengths were available for Zn (II 202.530 and II 206.163 nm) and Cu (I 324.770 and I 327.374 nm), which is a drawback for MEC. This limitation was due to the restriction of relative sensitivity or spectral resolution of the LIBS instrument. Sewage sludge CRM029 and cellulose were used as the standard and diluent, respectively. The analyte mass fractions in the sludge sample (Csample) were calculated from eqn (1), in which Cstd is the analyte mass fraction in the CRM,44 as presented in Table 1. | (1) |
Analytical results for Ca, Fe, Cu and Zn in sludge sample by LIBS determined by MEC are shown in Table 3. Calibration regression lines were linear, with determination coefficient (r2) values higher than 0.999, and the slopes obtained were 0.8084 for Ca, 0.6004 for Fe, 0.5172 for Zn, and 0.2202 for Cu. Accurate results (relative errors < 5%) and agreement with the reference values at the 95% confidence level (t-test) demonstrated the capability of MEC to circumvent matrix effects.
| Analyte | Reference value | Found value | Relative error (%) | LOD | LOQ |
|---|---|---|---|---|---|
| a Mass fraction (x) expressed as (a) wt% and (b) mg kg−1; y: peak emission integrated area. | |||||
| Ca | 19.7 ± 0.1a | 20.4 ± 1.3a | 4 | 0.12a | 0.41a |
| Fe | 3.0 ± 0.2a | 3.1 ± 0.3a | 2 | 0.17a | 0.57a |
| Zn | 1429 ± 78b | 1500 ± 302b | 5 | 353b | 1178b |
| Cu | 328 ± 4b | 332 ± 33b | 1 | 87b | 290b |
The main challenge associated with MEC is the need for at least three emission wavelengths free from spectral interference for reliable calibration. However, even using only two emission wavelengths, accurate results were achieved for Cu and Zn (Table 3). The results also demonstrated that cellulose was a suitable diluent for the sludge sample analysis, which is a requisite to achieve reliable results by MEC.
The LODs (Table 3) were calculated according to IUPAC recommendations,45 as previously described for MEC.31,33
3.4. Slope ratio calibration (SRC)
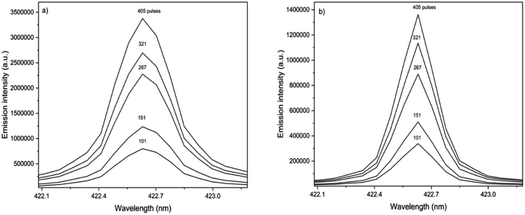
By considering the previously discussed drawbacks associated with EC and MEC, SRC was evaluated for sludge analysis. It is a novel calibration approach that requires only one standard and a single emission wavelength for quantitative measurements.34,35 The ablated mass functions (integrated area vs. number of laser pulses) were generated from the sewage sludge CRM029 (bstd) and the sludge sample (bsample) (Fig. 7). From the ratio between these slopes and the analyte mass fraction in CRM029 (Table 1), the unknown mass fractions in the test sample (Csample) were calculated by using eqn (2). | (2) |
The proportionality between the emission line intensities and the number of accumulated laser pulses is observed in the spectra obtained for Ca in the standard and sample pellets (Fig. 6). It is worth mentioning that the number of laser pulses was varied, keeping the other instrumental variables constant (laser energy of 20 mJ per pulse, delay time of 0.25 μs, and laser spot size of 50 μm). Calibration curves obtained for Ca, Fe and Zn using standard and sample pellets are shown in Fig. 7. The main parameters of analytical performance (linear determination coefficients and slopes for both the standard and sample, LOD, LOQ, and relative error) calculated for the SRC-LIBS method are shown in Table 4. The accuracy (relative errors < 21%) and agreement with the reference values at the 95% confidence level (t-test) demonstrate the potential of SRC as an efficient strategy for the quality control of sewage sludges. Measurements were based on peak integrated areas taking into account the greater effect of self-absorption observed in peak intensity compared to line integral intensity,46 thus producing more robust results.34
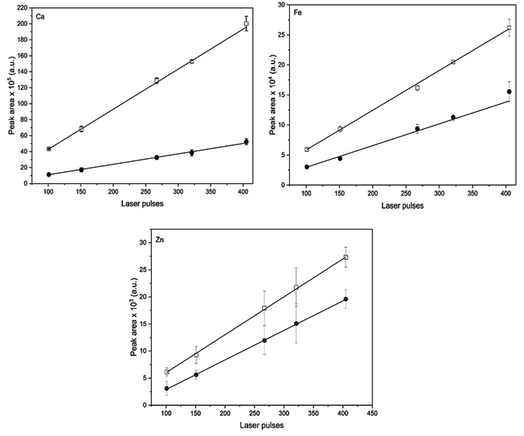 | ||
| Fig. 7 Ablated mass functions for CRM029 (●) and sewage sludge sample (□). Data correspond to mean ± standard deviation (n = 4). | ||
| Analyte | Standard | Sample | Reference value | Found value | Relative error (%) | LOD | LOQ | ||
|---|---|---|---|---|---|---|---|---|---|
| Slope | r 2 | Slope | r 2 | ||||||
| a Mass fraction (x) expressed as (a) wt% and (b) mg kg−1; y: peak emission integrated area. | |||||||||
| Ca | 13![[thin space (1/6-em)]](https://www.rsc.org/images/entities/char_2009.gif) 842 842 |
0.997 | 54![[thin space (1/6-em)]](https://www.rsc.org/images/entities/char_2009.gif) 397 397 |
0.999 | 19.7 ± 0.1a | 19 ± 1a | 4 | 0.1a | 0.3a |
| Fe | 425.63 | 0.999 | 685.01 | 0.997 | 3.0 ± 0.2a | 3.3 ± 0.2a | 10 | 0.1a | 0.3a |
| Zn | 63.30 | 0.999 | 76.85 | 0.994 | 1429 ± 78b | 1724 ± 196b | 21 | 392b | 1308b |
| Cu | — | — | — | — | <LOQ | — | — | 103b | 345b |
The copper content in the sample (328 mg kg−1) was below the estimated quantification limit (345 mg kg−1), hindering the determination of this micronutrient by the SRC-LIBS method. For zinc, the content in the sample (1429 mg kg−1) is only 9% higher than the estimated quantification limit (1308 mg kg−1), which hindered the precision (relative error of 20.7% and relative standard deviation of 11.4%), but still in statistical agreement with the reference value at the 95% confidence level (t-test).
The copper content in the sample (328 mg kg−1) was below the estimated quantification limit (345 mg kg−1), hindering the determination of this micronutrient by the SRC-LIBS method. For zinc, the content in the sample (1429 mg kg−1) is only 9% higher than the estimated quantification limit (1308 mg kg−1), which hindered the precision (relative error of 20.7% and relative standard deviation of 11.4%), but still in statistical agreement with the reference value at the 95% confidence level (t-test).
As presented in the literature,34,35 the SRC method requires that the unknown sample and the standard share similar characteristics and concentrations of the analyte for a perfect matrix-matching. In such a context, the same procedure was applied using another CRM as the standard (SRM695) for Ca, Fe, Zn and Cu determination in the sludge sample. The results obtained for Ca (5.9 wt%), Fe (4.4 wt%) and Zn (1533 mg kg−1) confirm that the laser-to-sample/standard interaction depends, among other things, on the physicochemical characteristics of the sample/standard matrix.
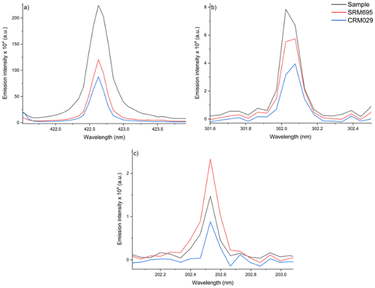
For Ca, the fertilizer matrix (SRM695) showed a higher slope (21003) than that obtained for CRM029 (slope: 13842), even having half the content of this element (2.26 wt% against 4.84 wt% in CRM029). Fig. 8 illustrates the matrix effect in the analysis of the two CRMs evaluated as possible standards in the SRC, for Ca, Fe, and Zn determination. The observed intensities (Fig. 8) were not proportional to the Ca and Fe concentrations, comparing the sample, SRM695 and CRM029.
Therefore, the difficulty to found an appropriate standard for obtaining a linear model for subsequent calibration transfer is a limitation of the SRC-LIBS method. The relative errors obtained using SRM695 as the standard were 70, 45 and 7%, for Ca, Fe and Zn respectively, highlighting the lack of accuracy for the determination of the first two analytes.
A comparison between the results obtained by the different calibration approaches evaluated in this work is shown in Fig. 9. The lowest accuracy was obtained by EC for all elements, while the MEC and SRC methods resulted in the highest accuracy. The determination of zinc showed the lowest precision among all elements and in all calibration methods. The low concentration of this element in the sample and the choice of an ionic emission line favor this result since Zn has the highest ionization energy among the evaluated analytes (906.4 kJ mol−1).47
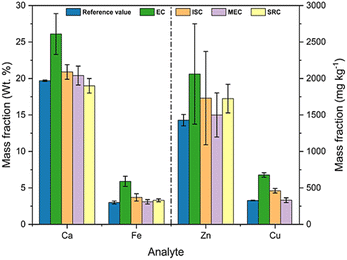 | ||
| Fig. 9 Results for the determination of Ca, Fe, Zn and Cu in the sample by EC, ISC, MEC and SCR methods. | ||
The Brazilian legislation regarding the sewage sludge disposal on land, mainly enforced by the National Environment Council (CONAMA) through the Resolution no. 498/2020, has set two distinct levels (class 1 and class 2) regarding the maximum concentrations allowed for Cu and Zn in this kind of material. For the first and second levels of sludge application on soil, the limits are 1500 mg kg−1 (Cu) and 2800 mg kg−1 (Zn), and 4300 mg kg−1 (Cu) and 7500 mg kg−1 (Zn), respectively.48 There are no maximum concentrations defined for Ca and Fe in the legislation. The results obtained in this work for Cu and Zn classify the analyzed sludge sample as class 1, according to the resolution. This classification allows for a wider range of applications for this material in the soil, compared to class 2 classification (e.g. different rate and area applications). It should be noted, nonetheless, that it is necessary to evaluate other aspects recommended by the legislation, including organic compounds and pathogenic microorganisms, prior to the application of sludge on land.
4. Conclusions
Four calibration approaches were evaluated aiming at quantitative determination of Ca, Fe, Cu, and Zn in sludge. The requirement of at least three standards similar in physical and chemical properties to the sample and covering the range of analyte mass fractions hindered the application of EC. Even using standards with similar matrices, e.g. fertilizer and clay, accurate results were not achieved, due to matrix effects (e.g. effect of physicochemical properties on the ablated masses). This was efficiently corrected by using C as the internal standard, which was chosen because it is found at constant concentration in the sample and standards.The lack of various appropriate CRMs is not an issue for MEC, which allowed quantitative determination of the target analytes; however, the need for at least three emission wavelengths free of spectral interference for each analyte is the main drawback. Although MEC graphs based on the responses at only two emission lines is not recommended because linearity may not be checked, accurate results were obtained for Zn and Cu under these conditions.
SRC was the simplest and practical calibration approach, which uses only one standard and analytical responses at a single emission wavelength and avoids the need for preparing sample/standard calibration mixtures, as required for MEC. The proportionality of emission line intensities and the number of accumulated laser pulses was observed, and for that, accurate results were obtained for Ca, Fe, and Zn when a sewage sludge reference material was used as the standard. Accurate results were not achieved for Ca and Fe when the fertilizer reference material was used instead, signaling the matrix-matching dependency of that approach. In fact, differently from MEC, matrix-matching is not involved in sample preparation in SRC. The limits of quantification achieved for SRC-LIBS hindered Cu determination and precision for Zn determination.
The low contents of Zn and Cu micronutrients observed in the sludge sample make their LIBS determinations even more challenging. On the other hand, according to the current legislation, these values are below the maximum allowed limit, enabling environmentally beneficial use of sewage sludge and contributing to save fertilizers. For all these purposes, LIBS proved to be an important and applicable analytical method.
Conflicts of interest
There are no conflicts to declare.Acknowledgements
We kindly acknowledge the Brazilian agency Fundação de Amparo à Pesquisa do Estado de São Paulo (2012/11998-0, 2021/14125-6) for financial support. We also thanks the Conselho Nacional de Desenvolvimento Científico e Tecnológico for F. R. P. R. (315866/2021-7) researchship. We are grateful to the Companhia de Saneamento Básico do Estado de São Paulo (SABESP) and Fábio de Jesus for supplying the sewage sludge sample. We also thank Coordenação de Aperfeiçoamento de Pessoal de Nível Superior (CAPES) for F.F.T. (88887.602449/2021-00) and A.C.E. (8887.372573/2019-00) fellowship. This is a contribution of the National Institute of Advanced Analytical Sciences and Technology (INCTAA).References
- D. Fytili and A. Zabaniotou, Sustain. Energy Rev., 2008, 12, 116–140 CrossRef CAS.
- P. H. T. Beckett, R. D. Davis and P. Brindley, Water Pollut. Control, 1979, 78, 419–445 CAS.
- E. Donner, C. G. Ryan, D. L. Howard, B. Zarcinas, K. G. Scheckel, S. P. McGrath, M. D. Jonge, D. Paterson, R. Naidu and E. Lombi, Environ. Pollut., 2012, 166, 57–64 CrossRef CAS PubMed.
- C. R. Tamanini, A. C. V. Motta, C. V. Andreoli and B. H. Doetzer, Braz. Arch. Biol. Technol., 2008, 51, 643–655 CrossRef.
- Y. Wei and Y. Liu, Chemosphere, 2005, 59, 1257–1265 CrossRef CAS PubMed.
- W. Halecki and S. Klatka, Environ. Manage., 2021, 67, 822–832 CrossRef PubMed.
- G. Sigua, M. Adjei and J. Rechcigl, Environ. Sci. Pollut. Res., 2005, 12, 80–88 CrossRef PubMed.
- P. Soler-Rovira, J. Soler-Soler, J. Soler-Rovira and A. Polo, Nutr. Cycling Agroecosyst., 1996, 43, 173–177 Search PubMed.
- G. S. Senesi, M. Dell’aglio, R. Gaudiuso, A. De Giacomo, C. Zaccone, O. De Pascale, T. M. Miano and M. Capitelli, Environ. Res., 2009, 109, 413–420 CrossRef CAS.
- V. S. Burakov, S. N. Raikov, N. V. Tarasenko, M. V. Belkov and V. V. Kiris, J. Appl. Spectrosc., 2010, 77, 595–608 CrossRef CAS.
- C. Pasquini, J. Cortez, L. M. C. Silva and F. B. J. Gonzaga, J. Braz. Chem. Soc., 2007, 18, 463–512 CrossRef CAS.
- D. W. Hahn and N. Omenetto, Appl. Spectrosc., 2010, 64, 335–366 CrossRef PubMed.
- D. W. Hahn and N. Omenetto, Appl. Spectrosc., 2012, 66, 347–419 CrossRef CAS PubMed.
- S. C. Jantzi, V. Motto-Ros, F. Trichard, Y. Markushin, N. Melikechi and A. De Giacomo, Spectrochim. Acta, Part B, 2016, 115, 52–63 CrossRef CAS.
- M. Martinez and M. Baudelet, Anal. Bioanal. Chem., 2019, 412, 27–36 CrossRef PubMed.
- R. Fantoni, L. Caneve, F. Colao, L. Fornarini, V. Lazic and V. Spizzichino, Spectrochim. Acta, Part B, 2008, 63, 1097–1108 CrossRef.
- M. D. Gomes, G. G. A. Carvalho, D. Santos Jr and F. J. Krug, Spectrochim. Acta, Part B, 2013, 86, 137–141 CrossRef.
- D. M. Silvestre, F. O. Leme, C. S. Nomura and A. N. Nascimento, Microchem. J., 2016, 126, 545–550 CrossRef CAS.
- W. B. Braga, L. C. Trevizan, L. C. Nunes, I. A. Rufini, D. Santos Jr and F. J. Krug, Spectrochim. Acta, Part B, 2010, 65, 66–74 CrossRef.
- B. A. Gething, J. J. Janowiak and R. H. Falk, For. Prod. J., 2009, 59, 67–74 Search PubMed.
- A. Uhl, K. Loebe and L. Kreuchwing, Spectrochim. Acta, Part B, 2001, 56, 795–806 CrossRef.
- J. Guezenoc, A. Gallet-Budynek and B. Bousquet, Spectrochim. Acta, Part B, 2019, 160, 105688 CrossRef CAS.
- N. S. Horner and D. Beauchemin, J. Anal. At. Spectrom., 2014, 29, 715–720 RSC.
- C. S. Nomura, D. P. Intima, F. J. Krug and P. V. Oliveira, Anal. Bioanal. Chem., 2008, 391, 1135–1137 CrossRef CAS PubMed.
- G. G. A. Carvalho, L. C. Nunes, P. F. Souza, F. J. Krug, T. C. Alegre and D. Santos Jr, J. Anal. At. Spectrom., 2010, 25, 803–809 RSC.
- R. Papai, R. H. Sato, L. C. Nunes, F. J. Krug and I. Gaubeur, Anal. Chem., 2017, 89, 2807–2815 CrossRef CAS.
- R. Papai, M. Silva, C. Pereira, C. Vilela, P. V. F. Costa, F. L. Oliveira, C. S. Nomura and I. Gaubeur, Talanta, 2019, 205, 120167 CrossRef CAS PubMed.
- M. Martinez and M. Baudelet, Spectrochim. Acta, Part B, 2020, 163, 105732 CrossRef CAS.
- F. O. Leme, D. M. Silvestre, A. N. Nascimento and C. S. Nomura, J. Anal. At. Spectrom., 2018, 33, 1322–1329 RSC.
- D. A. Cremers and L. J. Radziemski, Handbook of Laser Induced Breakdown Spectroscopy, John Wiley & Sons Ltd, 2013 Search PubMed.
- D. V. Babos, A. Virgilio, V. C. Costa, G. L. Donati and E. R. Pereira-Filho, J. Anal. At. Spectrom., 2018, 33, 1753–1762 RSC.
- F. M. Fortunato, T. A. Catelani, M. S. Pomares-Alfonso and E. R. Pereira-Filho, Anal. Sci., 2019, 35, 165–168 CrossRef CAS.
- A. A. C. Carvalho, L. A. Cozer, M. S. Luz, L. C. Nunes, F. R. P. Rocha and C. S. Nomura, J. Anal. At. Spectrom., 2019, 34, 1701–1707 RSC.
- L. C. Nunes, F. R. P. Rocha and F. J. Krug, J. Anal. At. Spectrom., 2019, 34, 2314–2324 RSC.
- V. C. Costa, D. V. Babos, J. P. Castro, D. F. Andrade, R. R. Gamela, R. C. Machado, M. A. Sperança, A. S. Araújo, J. A. Garcia and E. R. Pereira-Filho, J. Braz. Chem. Soc., 2020, 31, 2439–2451 CAS.
- J. Sirven, P. Mauchien and B. Sallé, Spectrochim. Acta, Part B, 2008, 63, 1077–1084 CrossRef.
- S. I. Gornushkin, I. B. Gornushkin, J. M. Anzano, B. W. Smith and J. D. Winefordner, Appl. Spectrosc., 2002, 56, 433–436 CrossRef CAS.
- J. T. Sloop, H. J. B. Bonilla, T. Harville, B. T. Jones and G. L. Donati, Talanta, 2019, 205, 120260 CrossRef PubMed.
- D. F Andrade, F. M. Fortunato and E. R. Pereira-Filho, Anal. Chim. Acta, 2019, 1061, 42–49 CrossRef PubMed.
- N. H. Thomas, B. L. Ehlmann, D. E. Anderson, S. M. Clegg, O. Forni, S. Schröder, W. Rapin, P. Y. Meslin, J. Lasue, D. M. Delapp, M. D. Dyar, O. Gasnault, R. C. Wiens and S. Maurice, J. Geophys. Res., 2018, 123, 1996–2021 CrossRef CAS.
- L. St-Onge, E. Kwong, M. Sabsabi and E. B. Vadas, Spectrochim. Acta, Part B, 2002, 57, 1131–1140 CrossRef.
- M. Radojevic and V. N. Bashkin, Practical Environmental Analysis, Royal Society of Chemistry, 2006 Search PubMed.
- D. Santos Jr, L. C. Nunes, G. A. C. Gustinelli, M. S. Gomes, P. F. Souza, F. O. Leme, L. G. C. Santos and F. J. Krug, Spectrochim. Acta, Part B, 2012, 71–72, 3–13 CrossRef.
- A. Virgilio, D. A. Gonçalves, T. McSweeney, J. A. G. Neto, J. A. Nóbrega and G. L. Donati, Anal. Chim. Acta, 2017, 982, 31–36 CrossRef CAS.
- IUPAC, Analytical Chemistry Division, Spectrochim. Acta, Part B, 1978, 33, 242–245 Search PubMed.
- A. Safi, B. Campanella, E. Grifoni, S. Legnaioli, G. Lorenzetti, S. Pagnotta, F. Poggialini, L. Ripoll-Seguer, M. Hidalgo and V. Palleschi, Spectrochim. Acta, Part B, 2018, 144, 46–54 CrossRef CAS.
- S. Ma, Y. Tang, S. Zhang, Y. Ma, Z. Sheng, Z. Wang, L. Guo, J. Yao and Y. Lu, Talanta, 2020, 214, 120849 CrossRef CAS.
- CONAMA – National Environment Council, No 498, 2020, Defines Criteria and Procedures for the Production and Application of Biosolids in Soils, and Makes Other Provisions, National Environment Council, Brasília, Brazil, p. 265 Search PubMed.
| This journal is © The Royal Society of Chemistry 2023 |

