 Open Access Article
Creative Commons Attribution 3.0 Unported Licence
Difficulties and artefacts in cryo-fixation of ovarian tissues for X-ray fluorescence analyses
Alessandra
Gianoncelli
 *a,
Katarina Vogel-
Mikuš
bc,
Murielle
Salomé
d,
Ernesto
Pascotto
e,
Giuseppe
Ricci
f and
Lorella
Pascolo
 f
f
aElettra Sincrotrone Trieste, SS 14 km 163,5 in Area Science Park, 34149 Basovizza, Trieste, Italy. E-mail: alessandra.gianoncelli@elettra.eu
bJožef Stefan Institute, 1000 Ljubljana, Slovenia
cSlovenia Biotechnical Faculty, University of Ljubljana, 1000 Ljubljana, Slovenia
dEuropean Synchrotron Radiation Facility, 38043 Grenoble, France
eULSS n.2 Marca Trevigiana, Dipartimento di Prevenzione, Servizi Veterinari di Asolo, 31100 Treviso, Italy
fInstitute for Maternal and Child Health, IRCCS Burlo Garofolo, via dell’Istria 65/1, 34137 Trieste, Italy
First published on 16th August 2023
Abstract
Even though measurements in cryogenic conditions are the preferred choice for single-cell and plant analyses to reduce sample preparation artefacts, preserve the integrity of samples and prevent loss of some chemical elements, cryo-fixation of human or animal soft tissue for X-ray fluorescence analysis still remains challenging. Here we report, compare and discuss analyses of bovine ovarian tissues performed in cryogenic or room temperature conditions, the latter both chemically fixed or freeze-dried.
It is generally accepted that working with frozen-hydrated cells and plant specimens under cryogenic conditions is the most efficient way to preserve sample structures and spatial biochemical composition, reduce chemical changes and sample radiation damage, particularly when prolonged or repeated analyses are required. Moreover, it allows to analyse the specimens as close as possible to physiological conditions, as it can provide good sample integrity combined with ionic elemental preservation.1–6 Such conditions, however, imply the use of a specific sample preparation procedure for vitrification of the specimens, not easily available in all laboratories, and a sample stage maintained at cryogenic temperature levels, together with a sample transfer not breaking the cold chain. All this complicates the measurements, since it requires specific equipment and technology, together with necessary expertise; however, it may produce exceptional results. Many examples in literature have shown the potential of cryogenic measurements for ptychography,7,8 tomography,9,10 XANES11 and X-ray Fluorescence (XRF) spectro-imaging.12
For these reasons, several synchrotron facilities have been equipped with appropriate sample environments. Yet, cryo-fixation and sectioning of human or animal soft tissues have remained a challenge.7,8
Cryo-fixation can be performed relatively easily and is widely used on small samples, such as cells,6,12–15 viruses, proteins etc., or porous specimens such as plants; especially for the latter, cryo-fixation is currently the most popular sample preparation protocol.16–21 A proper vitrification implies the formation of amorphous ice in the sample, which is crucial for its preservation, while an incomplete process would cause formation of the ice crystals leading to the breaking of membranes and distortion of the sample morphology. A complete vitrification can be easily achieved with only small samples (<1 mm3).22 The cryofixation becomes complicated for soft tissues, involving larger samples, with a complex architecture of cells enclosed in a three-dimensional loose extracellular matrix without hard cellular walls or dense connective material and structures.
Cryo measurements would be of particular interest in some clinical contexts, like the preservation of fertility, in order to monitor the integrity of gametes and tissues cryopreserved for future clinical use. An example are prepubertal girls recovering from malignant tumours and with a desire to procreate. For these patients, an experimental but realistic option consists in cryopreservation of ovarian tissue samples.23–25 The possibility of monitoring the changes in cryopreserved tissue during the many years of storage could provide a better understanding and improvements of cryopreservation protocols.
In this work we report a comparison between XRF analyses performed on a bovine ovarian tissue model, prepared with three different methods: (i) formalin-fixing and inclusion in paraffin (FFPE), (ii) freezing, cryo-slicing and freeze-drying (FD) and (iii) freezing, cryo-slicing and transfer in frozen state to be measured in cryogenic conditions (CRYO).
The ovarian tissue samples were obtained from young heifers at a slaughterhouse (macello Pelizzari, Loria, Treviso, Italy) accordingly to previously described procedures.26 Samples consisted of strips (3 mm thick, 4–5 mm wide) from the cortical part of the ovaries, manually separated from the medullar portion. All samples were collected in ice-cold PBS and then processed in three ways: (a) some tissue strips were immediately chemically fixed in PFA 10%, washed and dehydrated in ethanol prior to being included in paraffin and sliced to 10 μm thickness to be deposited onto ultralene foils; (b) fresh samples were embedded in tissue-tek (Sakura Finetek USA) slowly cooled down to −80 °C in less than 10 minutes, then sliced to a thickness of 10–20 μm using a cryomicrotome, maintained at −80 °C and directly transferred to the cryo-stage; (c) some samples from (b) were freeze-dried in vacuum and sandwiched between two ultralene foils. The cryo-sliced and freeze-dried samples were prepared as described in more details in.27 The slices were cut to 20 μm.
This protocol of cryo-fixation with slow freezing turned out to be inadequate for the ovarian tissue. The effects on the tissue structure and XRF detection are illustrated here.
The measurements were performed at the ID21 beamline28 of ESRF synchrotron facility (Grenoble, France). The samples were scanned at 7.3 keV photon energy with a step size of 500 nm and a micro-beam of 800 nm × 300 nm in size, delivered by Kirkpatrick-Baez mirrors, incident at 62° to the sample plane. The beam flux on the sample was around 5 × 10¹⁰ ph s−1, delivering point by point an estimated dose of about 4.4 × 10⁹ gray.29 An SDD detector, located at 69° from the incoming beam, collected the XRF photons point by point in a raster scan, with an acquisition time of 500 ms per pixel. The acquired spectra were processed and fitted by PyMCA software package,30 through a least-squares fitting algorithm and SNIP background subtraction routine, producing XRF elemental distribution maps. This ensures that the background noise is removed and that the remaining peaks are statistically relevant. The intensities of Kα X-ray lines of particular elements were taken into account and normalized to Compton scattering peak.
X-ray scattering is related to the sample composition, namely sample Z.31 Since scattering images to a great extent reflect the sample morphology, the intensities of the particular Kα X-ray fluorescence lines were normalized to Compton scattering peak to make the sample preparation treatments comparable. Unfortunately at the excitation energy of 7.3 keV the samples were transparent, so we were not able to obtain the absorption images, from which sample thickness could be calculated and fully quantitative analysis performed according to Kump et al.32 Heatmap was plotted from Kα intensities of particular elements for the three sample preparation protocols (FFPE, FD and CRYO) normalized to Compton scattering. The procedure involved z-normalization and two way cluster analysis (Euclidian distances) in R plot (Rx64 3.6.0).
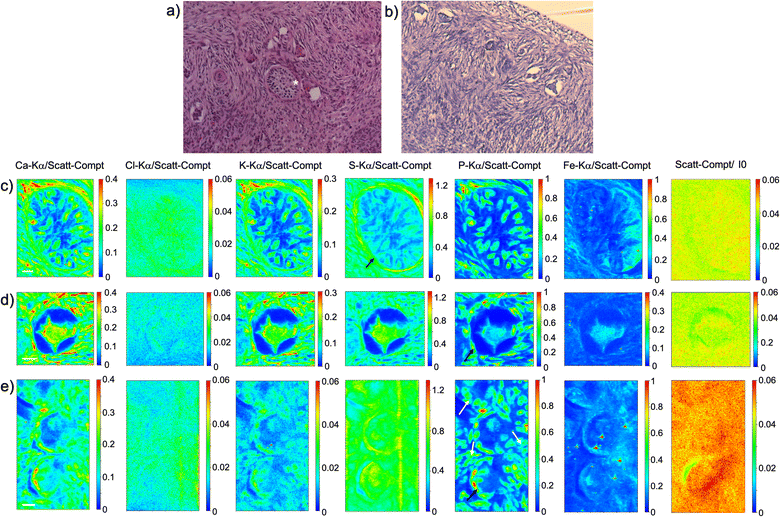
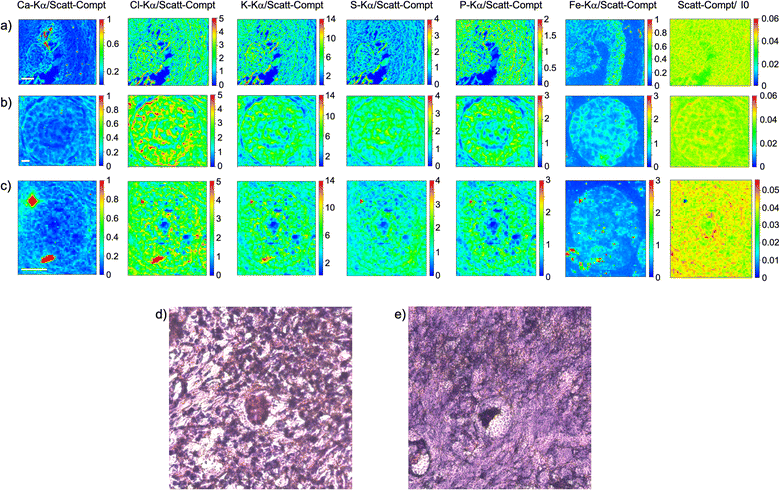
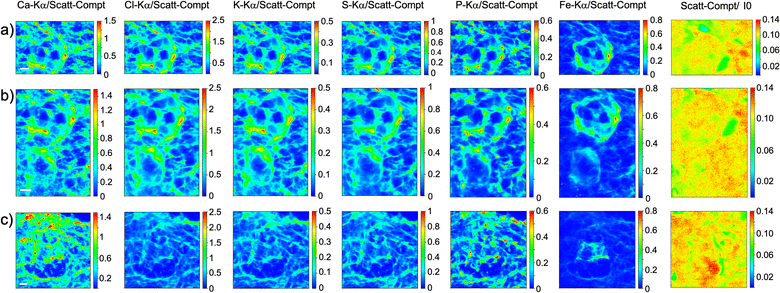
As visible in Fig. 1, the tissue's morphology in paraffin-embedded samples is quite well preserved, showing an abundant presence of follicles at different stages of maturation. Stroma cells (white arrows) and oocyte structures, like the granulosa and theca cells of follicles (black arrows), are well visible and easily identified in the XRF elemental mapping, especially by following phosphorus (P) distribution, as already shown in previous works for both bovine26 and human ovarian tissues.24,25,33 The morphology highlighted by P (revealing cell nuclei) and S (maximally abundant in the extracellular matrix) distributions resemble, at lower spatial resolution, the standard histological images (Fig. 1a and b) from visible light microscopy used by medical doctors and researchers to study and inspect this kind of tissues. In the XRF maps acquired on freeze-dried tissues (Fig. 2), analysed at room temperature as for FFPE ones, circular structure of oocytes is still discernible, but their morphology is hardly recognisable: in fact, the internal structures and stromal cells seem to have loosened up, with elements partially redistributed, appearing almost blurred. No single stromal cells or granulosa cells are identified separately as in FFPE case. Furthermore, cryo-sectioned tissues measured in cryo conditions (Fig. 3) present a completely different morphology: oocytes can hardly be identified, mainly by following Fe distribution, and the overall tissue appears disjointed and highly porous, like a spiderweb on a ten micrometres length scale. It looks like the tissue has lost its characteristic structure and integrity during slow freezing, and apart from oocytes, no other features can be discerned. In addition, X-ray emission photons of light elements like P and S are highly absorbed by water in the frozen-hydrated specimens, whereby the detection limits worsened.
This is typical artefact of a cryofixation. The sample was probably too large and the cooling rate too low to allow an appropriate vitrification. Ice crystals very likely formed and damaged the cellular structures.
Besides clear morphological changes induced by the different preparation protocols, elemental changes can also be spotted.
The ratio between incoherent (INC) and coherent (COH) scattering peak is related to the sample average Z.31 The ratios were 0.732, 0.712 and 0.691, respectively for FFPE, FD and CRYO samples indicating minimal differences in sample matrix, yet processes as chemical fixation and dehydration in the series of alcohols or via freeze-drying may affect element concertation and distribution.
Freeze-dried and cryo samples are comparable in terms of initial thickness, but the absence of water increases the sample density and hence the XRF Kα normalized intensities for P, S, Cl and K and Fe (Fig. 4). Oddly, as a possible consequence of redistribution, Ca-Kα intensities appear higher in cryo samples. However, washing-out of elements in ionic form or loosely bound to cell components (e.g. Ca2+, Cl−, K+, SO42−) can be expected in chemically fixed samples embedded in paraffin,22 which could also contribute to the difference in element distribution images between the three sample preparation protocols.
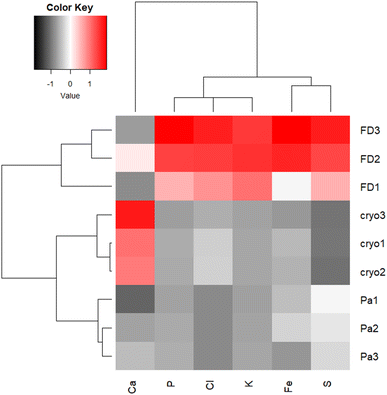 | ||
| Fig. 4 Heatmap presenting Z-normalized intensities of particular Kα lines normalized per Compton scattering peak, for FD, FFPE (Pa) and CRYO (Cryo) samples. | ||
Kα intensities appear at lowest levels in FFPE prepared tissues. Interestingly, K counts seem to be over ten times more intense in freeze-dried samples than in FFPE, which is probably again the consequence of element leaching during chemical fixation. Cl is very low in FFPE while at similar levels in the other two specimens. The same trend can be noticed for Fe as well. Higher concentrations of K and Cl were also measured by other authors34 in snap-frozen tissues in comparison to formalin-fixed, but here they seem comparable due to dilution effect in cryo samples (Fig. 4). These observations are also confirmed by considering the average XRF spectra collected of the whole analysed areas, for the three different preparations (Fig. 5). The peaks intensities shown in Fig. 5 are averaged on the whole tissue so they provide a general trend, while the XRF maps of Fig. 1–3 do show spatial peak intensities variations.
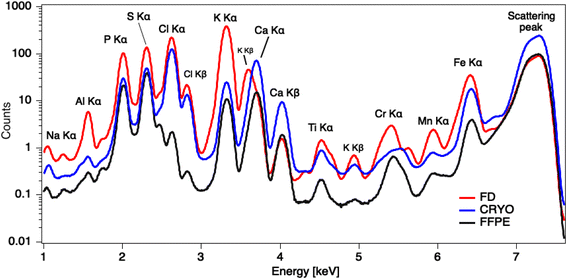 | ||
| Fig. 5 Average XRF spectra collected over the whole analysed areas for the three ample preparation protocols, highlighting average peak intensities differences. | ||
Considering the elemental distribution, in the elemental maps of frozen-hydrated tissue, elements P and K are much more uniformly distributed than in samples measured in freeze-dried conditions, in agreement with P. Vavpetič et al.,20 and also in FFPE samples. For the latter the cellular morphology is well discernible, while in tissues measured in cryo conditions it is almost completely lost: only the external perimeter of oocytes can be guessed, interestingly mostly for Fe signal. In freeze-dried tissues they all appear blurred or spread in an almost uniform way, as if the tissue has lost compactness. Indeed, even if these protocols are sometimes used also for soft tisses,11,35 they are better suited for relatively small samples, since the cooling rate is inversely proportional to the sample size.36 Similar considerations have been reported by other groups pointing out, for instance, that resin-embedding better preserves the wood structure, while cryo-sectioned structures change the shape under the beam during analysis.37 On the other hand, as expected, XANES spectra acquired on cryo-sections are cleaner than those from resin-embedded samples.37
For both FFPE and freeze-dried samples, visible images of histological sections are displayed (Fig. 1a, b and 2d, e), highlighting further the morphological changes induced by the sample preparation protocol. Even if FFPE fixation can induce some damage in the structure of the oocytes, as visible in Fig. 1b, it appears less pronounced than in freeze-dried sections where the stromal tissue has lost integrity and oocytes are identified only by their circular shape.
Conclusions
In summary, from the data presented, XRF analyses illustrate the fact that cryo-fixation with slow freezing of soft tissue is very delicate and can make the hydrated tissue lose integrity and almost collapse, if not performed in optimal conditions. Light elements appear redistributed and not representative of morphological features. While it is shown in the literature that other tissues can be imaged by XRF in similar conditions,11,20 other advanced cryo microscopies such as SEM38 and STEM39 suggest performing analyses at tissues thicknesses one order of magnitude smaller, in order to preserve the morphological information. However, such thicknesses would not be suitable for XRF measurements as they would provide a very low XRF signal.An alternative solution for future analyses on our frozen-hydrated samples might be to use the high pressure freezing,40 in order to avoid an incomplete or inhomogeneous vitrification due to quite large size of our histological sections, clearly affecting the delicate morphology of follicular structures. In addition, a possible use of cryoprotectants to facilitate vitrification procedure, like in clinical practice,41,42 could be investigated.
In conclusion, even if chemical fixation preserves well the tissue morphology, XRF analyses in cryo conditions represent the golden standard for elemental analysis, especially when combined with speciation investigations. However, as already noticed on other samples, XRF analyses in cryo conditions require a sophisticated tuning of the experimental and sample preparation, in order to reach a good compromise between morphology and XRF signal. Since cryo analyses are ever more recommended at synchrotron facilities, even though extremely complicated, they call for the development of dedicated platforms with personnel of high expertise to provide competent user support and to make the approach more accessible and successful.
Author contributions
Alessandra Gianoncelli: conceptualization, investigation, formal analysis, data curation, methodology, validation, writing – original draft, writing – review & editing. Katarina Vogel-Mikuš: investigation, methodology, validation and writing – original draft. Murielle Salomé: investigation and writing – original draft, writing – review & editing. Ernesto Pascotto: formal analysis and writing –review & editing. Giuseppe Ricci: supervision and funding acquisition. Lorella Pascolo: conceptualization, investigation, methodology, validation, writing – review & editing and funding acquisition.Conflicts of interest
There are no conflicts to declare.Acknowledgements
We acknowledge the European Synchrotron Radiation Facility (ESRF) for provision of synchrotron radiation facilities under proposal number MD1064. This work was supported by the Ministry of Health, Rome - Italy, in collaboration with the Institute for Maternal and Child Health IRCCS Burlo Garofolo, Trieste - Italy (5mille SD04/22). We also acknowledge the ARIS for the financing of the Programm group P1-0212.Notes and references
- J. Deng, D. J. Vine, S. Chen, Y. S. G. Nashed, Q. Jin, N. W. Phillips, T. Peterka, R. Ross, S. Vogt and C. J. Jacobsen, PNAS, 2015, 112, 2314–2319 CrossRef CAS PubMed.
- P. M. Kopittke, T. Punshon, D. J. Paterson, R. V. Tappero, P. Wang, F. P. C. Blamey, A. van der Ent and E. Lombi, Plant Physiol., 2018, 178, 507–523 CrossRef CAS PubMed.
- M. J. Pushie, I. J. Pickering, M. Korbas, M. J. Hackett and G. N. George, Chem. Rev., 2014, 114, 8499–8541 CrossRef CAS.
- P. Cheng, in X-Ray Microscopy, ed. P. D. P. Cheng and P. D. G. Jan, Springer Berlin Heidelberg, 1987, pp. 289–310 Search PubMed.
- S. Bohic, M. Cotte, M. Salomé, B. Fayard, M. Kuehbacher, P. Cloetens, G. Martinez-Criado, R. Tucoulou and J. Susini, J. Struct. Biol., 2012, 177, 248–258 CrossRef CAS.
- S. Matsuyama, M. Shimura, M. Fujii, K. Maeshima, H. Yumoto, H. Mimura, Y. Sano, M. Yabashi, Y. Nishino, K. Tamasaku, Y. Ishizaka, T. Ishikawa and K. Yamauchi, X-Ray Spectrom., 2010, 39, 260–266 CrossRef CAS.
- S. Chen, T. Paunesku, Y. Yuan, J. Deng, Q. Jin, Y. P. Hong, D. J. Vine, B. Lai, C. Flachenecker, B. Hornberger, K. Brister, C. Jacobsen, G. E. Woloschak and S. Vogt, AIP Conf. Proc., 2016, 1696, 020028 CrossRef.
- S. H. Shahmoradian, E. H. R. Tsai, A. Diaz, M. Guizar-Sicairos, J. Raabe, L. Spycher, M. Britschgi, A. Ruf, H. Stahlberg and M. Holler, Sci. Rep., 2017, 7, 6291 CrossRef CAS PubMed.
- J. Groen, J. J. Conesa, R. Valcárcel and E. Pereiro, Biophys. Rev., 2019, 11, 611–619 CrossRef PubMed.
- E. Duke, K. Dent, M. Razi and L. M. Collinson, J. Microsc., 2014, 255, 65–70 CrossRef CAS PubMed.
- S. Smulders, C. Larue, G. Sarret, H. Castillo-Michel, J. Vanoirbeek and P. H. M. Hoet, Toxicol. Lett., 2015, 238, 1–6 CrossRef CAS PubMed.
- C. Rumancev, A. Gräfenstein, T. Vöpel, S. Stuhr, A. R. von Gundlach, T. Senkbeil, J. Garrevoet, L. Jolmes, B. König, G. Falkenberg, S. Ebbinghaus, W. H. Schroeder and A. Rosenhahn, J. Synchrotron Radiat., 2020, 27, 60–66 CrossRef CAS PubMed.
- L. Perrin, A. Carmona, S. Roudeau and R. Ortega, J. Anal. At. Spectrom., 2015, 30, 2525–2532 RSC.
- Q. Jin, T. Paunesku, B. Lai, S.-C. Gleber, S. I. Chen, L. Finney, D. Vine, S. Vogt, G. Woloschak and C. Jacobsen, J. Microsc., 2017, 265, 81–93 CrossRef CAS PubMed.
- L. Merolle, L. Pascolo, L. Zupin, P. Parisse, V. Bonanni, G. Gariani, S. Kenig, D. E. Bedolla, S. Crovella, G. Ricci, S. Iotti, E. Malucelli, G. Kourousias and A. Gianoncelli, Molecules, 2023, 28, 1992 CrossRef CAS PubMed.
- T. Sabo-Attwood, J. M. Unrine, J. W. Stone, C. J. Murphy, S. Ghoshroy, D. Blom, P. M. Bertsch and L. A. Newman, Nanotoxicology, 2012, 6, 353–360 CrossRef CAS PubMed.
- A. D. Servin, H. Castillo-Michel, J. A. Hernandez-Viezcas, B. C. Diaz, J. R. Peralta-Videa and J. L. Gardea-Torresdey, Environ. Sci. Technol., 2012, 46, 7637–7643 CrossRef CAS PubMed.
- C. Peng, D. Duan, C. Xu, Y. Chen, L. Sun, H. Zhang, X. Yuan, L. Zheng, Y. Yang, J. Yang, X. Zhen, Y. Chen and J. Shi, Environ. Pollut., 2015, 197, 99–107 CrossRef CAS PubMed.
- H. A. Castillo-Michel, C. Larue, A. E. Pradas del Real, M. Cotte and G. Sarret, Plant Physiol. Biochem., 2017, 110, 13–32 CrossRef CAS PubMed.
- P. Vavpetič, K. Vogel-Mikuš, L. Jeromel, N. Ogrinc Potočnik, P. Pongrac, D. Drobne, Ž. P. Tkalec, S. Novak, M. Kos, Š. Koren, M. Regvar and P. Pelicon, Nucl. Instrum. Methods Phys. Res., Sect. B, 2015, 348, 147–151 CrossRef.
- C. Bissardon, S. Reymond, M. Salomé, L. André, S. Bayat, P. Cloetens and S. Bohic, J. Visualized Exp., 2019 DOI:10.3791/60461.
- K. Vogel-Mikuš, J. T. van Elteren, M. Regvar, J. Chaiprapa, B. Jenčič, I. Arčon, A. Kodre, P. Kump, A. Kavčič, M. Kelemen, D. Metarapi, M. Nečemer, P. Vavpetič, P. Pelicon and P. Pongrac, in Plant Metallomics and Functional Omics: A System-wide Perspective, ed. G. Sablok, Springer International Publishing, Cham, 2019, pp. 169–207 Search PubMed.
- R. Fabbri, Cell Tissue Banking, 2006, 7, 113–122 CrossRef.
- L. Pascolo, I. Venturin, A. Gianoncelli, R. Bortul, G. Zito, E. Giolo, M. Salomé, D. E. Bedolla, M. Altissimo, M. Zweyer and G. Ricci, Reprod. BioMed. Online, 2018, 37, 153–162, DOI:10.1016/j.rbmo.2018.04.051.
- L. Pascolo, I. Venturin, A. Gianoncelli, M. Salomé, M. Altissimo, D. E. Bedolla, E. Giolo, M. Martinelli, S. Luppi, F. Romano, M. Zweyer and G. Ricci, J. Instrum., 2018, 13, C06003 CrossRef.
- A. Gianoncelli, G. Sena Souza, G. Kourousias, E. Pascotto, P. Tafforeau, E. Longo, R. C. Barroso, M. Salomé, M. Stebel, F. Zingaro, C. Calligaro, G. Ricci and L. Pascolo, Int. J. Mol. Sci., 2023, 24, 3545 CrossRef PubMed.
- K. Vogel-Mikuš, P. Pongrac and P. Pelicon, Int. J. PIXE, 2014, 24, 217–233 CrossRef.
- M. Cotte, E. Pouyet, M. Salomé, C. Rivard, W. D. Nolf, H. Castillo-Michel, T. Fabris, L. Monico, K. Janssens, T. Wang, P. Sciau, L. Verger, L. Cormier, O. Dargaud, E. Brun, D. Bugnazet, B. Fayard, B. Hesse, A. E. P. del Real, G. Veronesi, J. Langlois, N. Balcar, Y. Vandenberghe, V. Armando Solé, J. Kieffer, R. Barrett, C. Cohen, C. Cornu, R. Baker, E. Gagliardini, E. Papillon and J. Susini, J. Anal. At. Spectrom., 2017, 32, 477–493 RSC.
- B. Fayard, M. Salomé, K. Takemoto, H. Kihara and J. Susini, J. Electron Spectrosc. Relat. Phenom., 2009, 170, 19–24 CrossRef CAS.
- A. Sole, E. Papillon, M. Cotte, P. Walter and J. Susini, Spectrochim. Acta, Part B, 2007, 62, 63–68 CrossRef.
- M. Nečemer, P. Kump, J. Ščančar, R. Jaćimović, J. Simčič, P. Pelicon, M. Budnar, Z. Jeran, P. Pongrac, M. Regvar and K. Vogel-Mikuš, Spectrochim. Acta, Part B, 2008, 63, 1240–1247 CrossRef.
- P. Kump and K. Vogel-Mikuš, J. Instrum., 2018, 13, C05014 CrossRef.
- L. Pascolo, G. Sena, A. Gianoncelli, A. Cernogoraz, G. Kourousias, B. D. Metscher, F. Romano, G. Zito, S. Pacilè, R. Barroso, G. Tromba, M. Zweyer and G. Ricci, J. Synchrotron Radiat., 2019, 26, 1322–1329 CrossRef CAS PubMed.
- S. Pessanha, A. Veiga, D. Doutel, F. Silva, J. Silva, P. M. Carvalho, S. Barbosa, J. P. Santos, A. Félix and J. Machado, Spectrochim. Acta, Part B, 2023, 205, 106704 CrossRef CAS.
- A. D. Surowka, A. Gianoncelli, G. Birarda, S. Sala, N. Cefarin, A. Matruglio, M. Szczerbowska-Boruchowska, A. Ziomber-Lisiak and L. Vaccari, J. Synchrotron Radiat., 2020, 27, 1218–1226 CrossRef PubMed.
- M.-P. Isaure, S. Huguet, C.-L. Meyer, H. Castillo-Michel, D. Testemale, D. Vantelon, P. Saumitou-Laprade, N. Verbruggen and G. Sarret, J. Exp. Bot., 2015, 66, 3201–3214 CrossRef CAS PubMed.
- T. Mansikkala, M. Patanen, A. Kärkönen, R. Korpinen, A. Pranovich, T. Ohigashi, S. Swaraj, J. Seitsonen, J. Ruokolainen, M. Huttula, P. Saranpää and R. Piispanen, Molecules, 2020, 25, 2997 CrossRef CAS PubMed.
- A. J. Saubermann, P. Echlin, P. D. Peters and R. Beeuwkes, J. Cell Biol., 1981, 88, 257–267 CrossRef CAS.
- K. Zierold, J. Microsc., 1982, 125, 149–156 CrossRef CAS.
- D. Studer, B. M. Humbel and M. Chiquet, Histochem. Cell Biol., 2008, 130, 877–889 CrossRef CAS PubMed.
- L. Gangwar, S. S. Phatak, M. Etheridge and J. C. Bischof, CryoLetters, 2022, 43, 316–321 CrossRef.
- T. El Cury-Silva, M. E. G. Nunes, M. Casalechi, F. V. Comim, J. K. Rodrigues and F. M. Reis, Cryobiology, 2021, 103, 7–14 CrossRef CAS PubMed.
| This journal is © The Royal Society of Chemistry 2023 |

