An integrated ion-exchange membrane-based microfluidic device for irreversible dissociation and quantification of miRNA from ribonucleoproteins
Kyle P.
McCarthy
 a,
David B.
Go
 ab,
Satyajyoti
Senapati
 a and
Hsueh-Chia
Chang
 *a
*a
aDepartment of Chemical and Biomolecular Engineering, University of Notre Dame, Notre Dame, Indiana 46556, USA. E-mail: hchang@nd.edu
bDepartment of Aerospace and Mechanical Engineering, University of Notre Dame, Notre Dame, Indiana 46556, USA
First published on 1st December 2022
Abstract
Ribonucleoproteins (RNPs), particularly microRNA-induced silencing complex (miRISC), have been associated with cancer-related gene regulation. Specific RNA-protein associations in miRISC complexes or those found in let-7 lin28A complexes can downregulate tumor-suppressing genes and can be directly linked to cancer. The high protein-RNA electrostatic binding affinity is a particular challenge for the quantification of the associated microRNAs (miRNAs). We report here the first microfluidic point-of-care assay that allows direct quantification of RNP-associated RNAs, which has the potential to greatly advance RNP profiling for liquid biopsy. Key to the technology is an integrated cation-anion exchange membrane (CEM/AEM) platform for rapid and irreversible dissociation (k = 0.0025 s−1) of the RNP (Cas9-miR-21) complex and quantification of its associated miR-21 in 40 minutes. The CEM-induced depletion front is used to concentrate the RNP at the depletion front such that the high electric field (>100 V cm−1) within the concentration boundary layer induces irreversible dissociation of the low KD (∼0.5 nM) complex, with ∼100% dissociation even though the association rate (kon = 6.1 s−1) is 1000 times higher. The high field also electrophoretically drives the dissociated RNA out of the concentrated zone without reassociation. A detection limit of 1.1 nM is achieved for Cy3 labelled miR-21.
Introduction
Ribonucleoproteins (RNPs) are complexes composed of ribonucleic acids (RNAs) and RNA-binding proteins (RBPs). RNPs form throughout cells and serve a variety of biological functions, including gene silencing, gene transport, enzymatic reaction, folding, and arrangement of RNA and proteins. These molecules are bonded by intermolecular forces whose bonds vary in specificity and strength to match their function.1,2 The bound RNA in these complexes can vary, including long non-coding RNA (lncRNA), microRNA (miRNA), and messenger RNA (mRNA), and their function is generally determined by the associated RBP(s).3,4 These complexes are essential for healthy cell functionality and behaviour but can also be key in disease behaviour as certain associations can disrupt healthy cell behaviour. Improvements in lab-bound RNP isolation and identification techniques within the last 10 years, including cross-linking immunoprecipitation (CLIP)5–8 and gradient profiling by sequencing (grad seq),9,10 have increased our understanding of their role in healthy and diseased cells.1,11,12 Stress proteins like heat shock proteins often appear as RNP with RNA chaperons. Gene-silencing by miRNA-induced silencing complex (miRISC) with Argonaute 2 protein is particularly relevant to liver,13 colorectal14 and breast15 cancers. The MiRISC RNP is known to carry miRNA cargo distinct from those in extracellular vesicles (EVs), such as exosomes.16 While point-of-care (POC) EV isolation and quantification technologies are now available, these technologies do not work for RNPs, which are considerably smaller than small EVs and are not vesicles that can be easily lysed by surfactants or thermally. They are complexes of proteins and RNAs that require a different repertoire of POC technologies.Nevertheless, increased libraries of RNPs with known functionality have opened the potential for RNPs as a promising disease biomarker, particularly as POC liquid biopsy targets for cancer screening and therapy management,11,17 as well as for neurodegenerative and autoimmune disorders. Known associations have also been identified in diseased patient samples with immunoprecipitation methods, especially in studies of the composition of granular bodies like stress granules (SGs)18–20 and p-bodies (PBs) formed from RNA–RNA, protein–protein, and RNA-protein interactions.21,22 Understanding the role of these complexes in disease allows for a better prediction of their stability and potential as a diagnostic, prognostic, or therapeutic marker. Often the complex is responsible for silencing genes that regulate cellular growth and communication allowing exponential growth in tumor cells or inhibiting the cell's natural response to growth, plaquing, or pathogens.17,23 Let7 RNA with Lin28A/B protein were the first RNP associations linked to cancer and other diseases by silencing translation of the Let7 gene and causing unrestrained growth in tumor cells.17 Box C/D snoRNP association has been associated with leukaemia24 and miR-21 has been identified as a pancreatic cancer biomarker and is found free-floating in plasma primarily held in ribonucleoproteins.25 These RNAs are also expressed by healthy cells. Hence, the isolation of RNPs specifically from tumor cells should yield a higher over-expression factor. Consequently, being able to quantify RNA from specific RNPs, particularly miRISC, may provide the necessary sensitivity and specificity for early screening or therapy management in cancer diagnostics. Yet the conversion of current lab-bound RNP analytical technologies to POC applications has not been reported.
Current laboratory technologies used to study the binding of RNA and protein primarily include fluorescence resonance energy transfer (FRET), gradient profiling by sequencing (grad seq), cross-linking immunoprecipitation (CLIP), and other immunoprecipitation methods.26 These techniques are effective for determining the complex constituents and the binding site(s) but cannot quantify. Although the CLIP technique can stabilize RNA-protein association, its crosslinking process has low efficiency, resulting in the crosslinking of a limited number of RNPs. FRET and similar imaging techniques require fluorescent labelling that can determine the binding kinetics but are not suitable for liquid biopsy applications.27,28 These techniques have allowed the creation of libraries of RNA-binding sites (RBS) and RBPs and their subsequent RNPs that exist in cells at different stages of cell life. It is known, however, that the expression level of RNP and their specific panels of overexpressed miRNAs vary with disease progression.11,29 Quantification is hence important for a viable liquid biopsy platform. Because of relatively rapid metastasis, quantification of RNA in RNPs is particularly important for POC liquid biopsy and would be a major contribution to cancer diagnosis/prognosis.
A key obstacle to the quantification of RNP RNAs in general, and miRISC in particular, is the high affinity between the positively charged proteins and the negatively charged RNA, with dissociation constants on the order of nM for miRNAs.30,31 This high affinity is the cause of RNP stress granule formation and anomalously strong associations. This high affinity is also why CLIP requires UV cross-linking to prevent the indiscriminate association of RNPs. Despite this high affinity, the RNP association is reversible with the proper stimuli. Studies have shown that lysing and isolation techniques can cause dissociation and reassociation of RNP complexes with companions different from their partners within the in vivo landscape.9,32 RNP association alone can be unreliable as a biomarker after cell lysing. A change in the ionic strength, pH, and even the molecular crowding environment can dissociate some RNPs and that can cause their constituents to reassociate with different proteins/RNAs. The chemical composition of some dissociation solutions can introduce significant bias. For miRNAs in particular, mechanical dissociation of RNP can also lyse exosomes and release their miRNAs to cause additional bias.33 UV cross-linking to prevent dissociation, used in CLIP techniques, is not a solution due to its low crosslinking efficiency and the need for an additional enzyme digestion step by proteinase to cleave the associated proteins from their RNAs. There is also evidence that part of the protein remains on the RNA after digestion26 which could interfere with probe-based identification and quantification of short RNAs like miRNA. As we shall show in this study, even the bound Cas9 proteins in RNP can interfere with the RNA quantification (see Fig. 2B). Ultimately, the degree of dissociation and reassociation, and hence accurate quantification, depends on the strength of RNP association and the dissociation method.
In this manuscript, we report the first membrane-integrated microfluidic chip to allow precise quantification of RNP-associated RNAs, taking advantage of perm-selective membrane modules to overcome the many obstacles outlined above. In our earlier work, we have used the ion depletion front from a perm-selective membrane to concentrate analytes and exosomes34–36 and have designed ionic modules to control the location of these fronts.37 We have also developed perm-selective membrane sensors with functionalized probes to quantify DNA, RNA, and protein in various analytes including plasma.33,34,38–40 In this work, we develop a set of integrated microfluidic technologies for dissociating and quantifying the RNAs in RNPs. We assumed that the RNPs have been isolated from EVs by ultrafiltration and hence demonstrated the new technologies with synthetic RNP solutions. We concentrated the RNPs at a depletion front generated by a cation-exchange membrane (CEM) and used the high field in the depletion front to dissociate the RNP at the concentration band and separate the dissociated RNAs and proteins from the band. We also design the operating conditions (flow rate, applied current) so the dissociated RNA does not reassociate with the protein before both leave this concentrated band. It is conceptually similar to the irreversible purification of nucleic acids by electrodialysis41 but without the dialysis membrane and with a much shorter purification time. The novelty of the work lies in our unique chip design that allows the irreversible dissociation of RNPs, as negatively charged RNAs and positively charged proteins are electrophoretically separated in the concentrated band, thus preventing their reassociation. This irreversible dissociation hence allows precise quantification of the RNP-associated RNAs and proteins. Here, we demonstrate in situ miRNA detection after RNP dissociation with an integrated anion-exchange membrane (AEM) sensor42,43 using a synthesized model RNP consisting of Cas-9 protein and Cyamine 3 (Cy3) labelled miR-21. This work represents the first application of a perm-membrane depletion front to irreversibly dissociate high-affinity RNPs for precise RNA quantification.
Materials and methods
RNP preparation
To synthesize the model RNP, 5 μM Cyanine 3 (Cy3) labelled microRNA-21, TAGCTTATCAGACTGATGTTGA (IDT), was mixed with an equal concentration of fluorescently labelled Cyanine 2 (Cy2) labelled (ThermoFisher) Cas9 protein (Synthego) in 0.1× PBS buffer at pH 7.4 and incubated in a shaker at 22 °C for 20 minutes before being stored at 4 °C until use. The formation of RNP was verified by gel electrophoresis. Cas9 was labelled with a Cyanine 2 NHS Ester (Lumiprobe) using the supplier's protocol. The conjugated sample was purified by gravitational and centrifugal filtration using an Amicon Ultra 0.5 μm centrifugal filter kit (Sigma-Aldrich). A fluorescently labelled Alexa Fluor 488 attached to 5′ of the miR-21 sequence (IDT) was used for the initial preconcentration study (Fig. 1D).Fabrication and operation of integrated dissociation and sensing chip
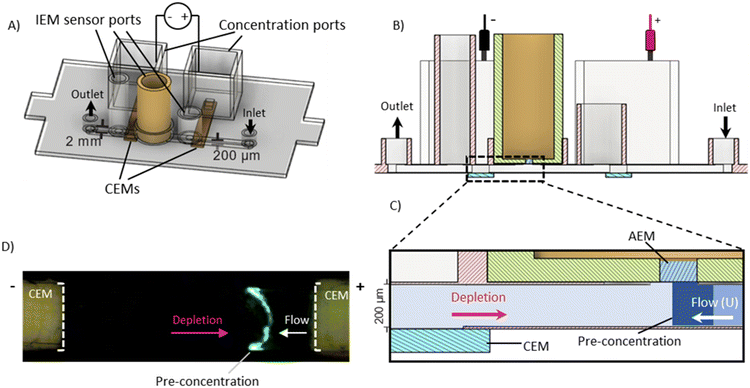
For the integrated dissociation and sensing chip (Fig. 1A), a three-layered polycarbonate (PC) microchannel was fabricated using our standard fabrication process.35,39,44 Briefly, the three layers of the PC sheet were cut using a Graphtec cutter and formed into a channel with dimensions of 15 × 2 × 0.2 mm3 (l/w/h) and orifices for the inlet and outlet and sensing and concentration units. All three layers were combined and bonded together by passing through a thermal laminator. To generate the dissociation-inducing depletion front, two cation-exchange membranes (CEMs) composed of polystyrene-divinylbenzene fine particles with strong acid sulphone groups (SO3−) supported by polyethylene as a binder and polyamide/polyester textile fiber (Mega a.s., Czech Republic) were glued into the bottom of the PC chip, bridging the microfluidic channel and electrode reservoir orifices (Fig. 1B). Both CEM reservoirs were filled with 10× TAE buffer (IBI Scientific). Platinum electrodes were used to apply a constant current of 0.8 mA through the two CEMs using a DC power supply (Keithley 2400 SourceMeter) with a maximum of 180 V. The application of an electric field generates a depletion zone at the interface of the anode CEM, concentrating negatively charged RNPs where the enhanced field allows for irreversible dissociation (Fig. 1C). The sample was injected through the microfluidic channel using a syringe pump in a solution of 0.1× PBS at a flow rate of 0.12 mL h−1.For the detection of RNP-associated miRNAs, an anion-exchange membrane (AEM) (Mega a.s., Czech Republic) was embedded in a resin mold using a process reported earlier.45 The AEM membrane is made of polystyrene–divinylbenzene fine particles with strong basic quaternary ammonium groups (R – (CH3)3N+) supported by polyethylene as a binder and polyamide/polyester textile fiber. The mold was made with silicone in a 3D printed base created with an Elegoo Mars Pro 3D printer. The AEM was hand cut and placed in the silicone mold before being closed with a PDMS block and filled with a polyurethane resin (Tap Quik-Cast, Tap Plastics) and left for 30 minutes for curing. The cured membrane sensor face was then removed from the mold and glued to a 3D-printed reservoir. The AEM sensor was then soaked in 0.1× PBS and swelled for at least 8 hours. To detect the target miR-21, the sensor was functionalized with ssDNA oligonucleotide probes having a complementary sequence of TCAACATCAGTCTGATAAGCTA using EDC/NHS coupling chemistry.44,45
The functionalized sensor was placed in a sensing slot at the top of the microfluidic channel in between the two CEMs (Fig. 1A). The position of the membrane is designed so that upon the dissociation of RNP at the depletion front, the separated miRNAs remain beneath the AEM sensor and hybridize with the specific probe attached to the sensor (Fig. 1C). 1× TAE buffer was used to fill the sensing reservoirs. The current–voltage (I–V) measurement of the AEM sensor was performed in 0.1× PBS where a Gamry 500 potentiometer (Gamry Instrument) was used to measure a voltage drop across the sensor by applying a current via two platinum electrodes. Two reference electrodes (Ag–AgCl) were used to measure the voltage drop.
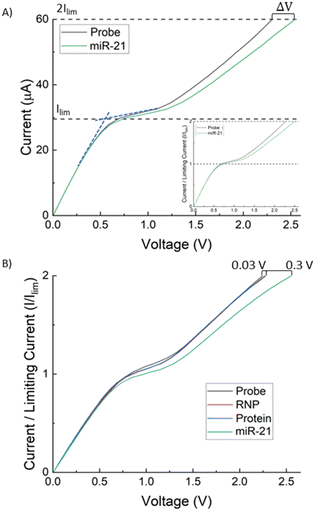
The AEM sensor's current–voltage (I–V) response depends on the probe and hybridized target on its surface. To normalize with respect to variations in the sensor size and surface roughness, the voltage shift of the AEM sensor is calculated based on the over-limiting voltage at a current equal to twice the limiting current.40,46 The limiting current (Ilim) is measured at the overlap of the slope of the ohmic and limiting regions, shown in Fig. 2A. The difference in over-limiting voltage between the baseline (probe) and sample at this current (2Ilim) gives the voltage shift ΔV. While the current–voltage signal may vary from sensor to sensor, this shift varies little across all sensors for a given concentration of the miRNA target (see error analysis in Fig. 3). We refer the readers to our earlier publications on the electrode designs, configuration, and placements.33,34,38–40
AEM sensor
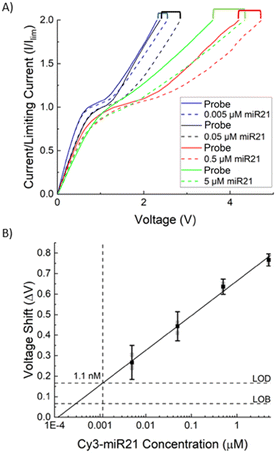
Fig. 2A depicts a set of typical current–voltage curves (CVCs) for the AEM sensor, where the response initially has an ohmic behaviour (under-limiting) before plateauing (limiting) and then increasing further (over-limiting). When target miRNA hybridizes with oligoprobes on the surface of the IEM, there is a distinct voltage shift in the over-limiting region that can be calibrated to the target concentration. We first calibrated the sensor of the integrated chip, without depletion action, with batch samples of Cas9-miR-21 RNP, Cas9 alone, and Cy3 labelled miR-21 alone (Fig. 2B). A 10× increase in voltage shift is observed for Cy3 labelled miR-21 (ΔV = 0.3 V) compared to RNP (ΔV = 0.03 V) and protein (ΔV = 0.01 V), where the latter both show a negligible voltage shift. This demonstrates that the probe-based assay cannot detect RNP RNA without dissociating the RNP first and that dissociated Cas9 does not interfere with the sensor. We measure the voltage shift for different concentrations of labelled miR-21 (0.005 μM, 0.05 μM, 0.5 μM, and 5 μM) and the voltage shift increases with concentration as shown in Fig. 3A. We use these voltage shifts to create a calibration plot for this sensor shown in Fig. 3B, where a limit of detection (LOD) of 1.1 nM was found for Cy3 labelled miR-21 with a dynamic range of 3 decades.The LOD of 1.1 nM is lower than the typical KD of miR-oligo reversible hybridization on surfaces or on particles, which is between 30 to 300 nM (see, for example, Marczak et al.35). It is, however, higher than our previous AEM study44 where 1 pM LOD was observed for miR21. In this dissociation study, we used RNPs that are synthesized with Cy3 labelled miR-21 and Cy2 labelled Cas9 protein. We hence used Cy3 labelled miR-21 samples to develop the calibration plot so that we can determine the miR-21 concentration with the AEM sensor after the RNP dissociation study. The shifting of the calibration range from pM–nM in an earlier study44 to nM–μM here is likely due to the presence of a reduced negative charge on the AEM sensor surface after hybridization of Cy3 labelled miR-21 targets with the complementary sequences attached to the AEM sensor. The attachment of positively charged Cy3 dye to miR-21 (ref. 5) decreases the net negative charge of the Cy3 labelled miR-21 and as a result, a lower voltage shift is observed compared to non-labelled miR-2144 in the over-limiting region of the CVC since the voltage shift is a function of the negative charge present on the AEM sensor. We have shown previously that, due to the depletion action of the AEM sensor, the sensor does not need to be calibrated for every sample.39,44 We note that the voltage shift scales as the logarithm of the miRNA concentration, as the effective surface Zeta potential, which is a measure of the electric activity coefficient, is a logarithm function of the captured charged RNAs.37
Experimental protocol for RNP dissociation and in situ miR-21 quantification
To conduct an integrated dissociation and in situ detection experiment, first, a baseline CVC was recorded in 0.1× PBS using a Gamry potentiostat 500. Then, a field yielding a constant current of 0.8 mA was applied across the CEMs (Iapp = 0.8 mA, Vmax = 180 V). After application of the field for 3 minutes, an RNP sample in 0.1× PBS was injected into the channel at a flow rate of Q = 0.12 mL h−1 for 40 minutes to achieve near full dissociation (see Results and discussion). Once the full dissociation time was reached, current and flow were stopped, and the sample was left in the channel to incubate over the sensing membrane for 20 minutes. The membrane was then washed with 4× PBS for 15 seconds to remove non-specific targets from the membrane surface, followed by 0.1× PBS for 1 minute to return the buffer concentration to 0.1× PBS over the AEM surface for measurement. The I–V signal of the AEM was then measured and recorded. Any voltage shift from the baseline signal indicates the successful detection of the miRNA RNP, and the extent of the shift accounts for the concentration of dissociated miRNA RNP in the sample.Fluorescence imaging of RNP dissociation
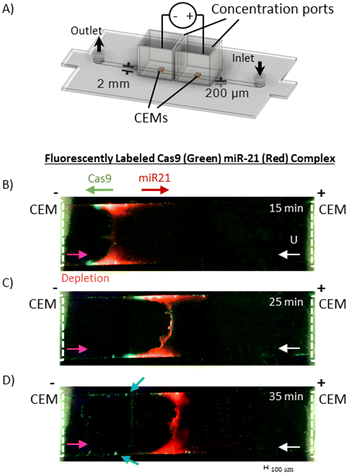
Qualitative fluorescence imaging of RNP dissociation in the channel was conducted with a Dinocapture Premier Pro dual fluorescence microscope (DinoLite). An independent concentration and dissociation module that excluded the sensor unit and consisted only of the two CEMs, as shown in Fig. 4A, was fabricated and used for the fluorescence studies. The main channel was filled with 0.1× PBS, the concentration ports were filled with 10× TAE buffer. RNP sample (4 μL of 5 μM) composed of equimolar positively charged Cy2 labelled Cas9 protein and negatively charged Cy3 labelled miR-21 RNA was loaded into the channel with a syringe pump at a flow rate of 0.12 mL h−1 followed by 0.1× PBS. The potential was applied across the concentration ports (Iapp = 0.8 mA, Vmax = 180 V) simultaneous to the sample introduction and the channel was monitored for the concentration of the RNP band.4 μL of RNP are loaded into the channel over 2 minutes followed by the pumping of 0.1× PBS. After 3 minutes, the RNP has reached the concentration membranes. The position of the concentrated RNP slug between the two concentrated membranes was monitored by tracking the fluorescently labelled miRNA of the RNP complex as shown in Fig. 4B. The flow from the outlet was collected to measure the fluorescence intensity of protein (labelled ‘integrated flowthrough’ in Fig. 5A and 6A).
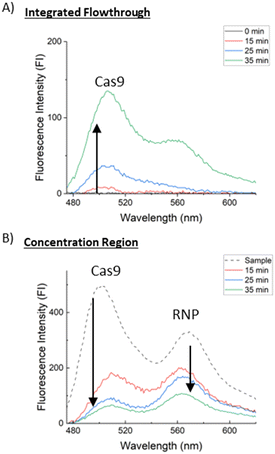
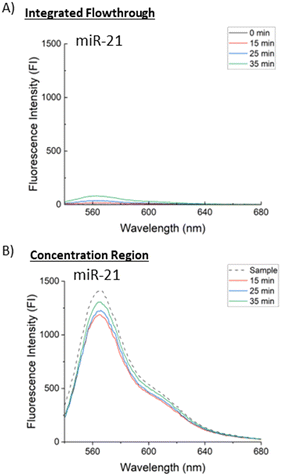
After dissociation and concentration for a fixed amount of time (15 min, 25 min, or 35 min), the applied voltage and flow were stopped, trapping the concentrated miR-21 in the channel. The channel was then slowly pumped, and the flowthrough collected until the concentrated plug reached the edge of the channel as verified by fluorescence of the labelled miRNA. The outlet line was removed and flushed before being replaced with new tubing and pumped to collect the trapped miR-21 and non-dissociated RNP complex from the concentration region (labelled “concentration region” in Fig. 5B and 6B). The volume of each collected fraction was measured and diluted to the same volume (200 μL) with 0.1× PBS in a 96 well plate. Samples at different concentration times were collected and fluorescence emission spectra for each were measured with an infinite 200 PRO plate reader (Tecan) for excitation wavelengths of 440 nm and 510 nm for the Cas9 and miR-21, respectively. For 440 nm excitation, emission was observed at 510 nm corresponding to the protein peak and at 568 nm due to excitation of Cy3 miR-21 and the Cy2 protein emission; this peak corresponds to associated RNP in the channel.
Results and discussion
Principle of irreversible dissociation by depletion front
Our irreversible dissociation design is based on electrophoretic isolation of positively charged Cas9 proteins from negatively charged RNP and miR-21 that are concentrated within a thin boundary layer at the depletion front formed by the CEMs. The large electric field in the depletion region concentrates the negatively charged miR-21 and positively charged Cas9, where the electromigration of positively charged dissociated Cas9 is faster than the reassociation rate of Cas9-miR-21 RNP.It is important to design the module such that the irreversible dissociation occurs at the boundary layer of the depletion front and the dissociated RNA is out of the same boundary layer without recombination. The characteristic flow velocity U is roughly 0.01 cm s−1 for a flow rate of 0.12 mL h−1. Over an ion-depleted zone of about 0.18 cm (the spacing from the CEM to the AEM in Fig. 1C), we predict a voltage drop of 100 V and estimate the field at the depletion front to be over 500 V cm−1; this yields an electromigration velocity of roughly 0.01 cm s−1 for the RNP,47,48 comparable to the flow velocity but in the opposite direction. Due to a balance between convection and diffusion, the RNP boundary layer has a thickness of roughly D/U, where D is their diffusivity; this is approximately, 4 × 10⁻⁶ cm for a characteristic RNP diffusivity of 4 × 10⁻⁸ cm2 s−1.49 With a typical miRNA electrophoretic mobility of 2 – 4 × 10⁻⁴ cm2 V s−1,50,51 we estimate the electromigration time of the dissociated RNA from this boundary layer to be 3 × 10⁻⁵ s, which is significantly shorter than the diffusion time or the rapid association time for Cas9 and miR-21 (kon−1 ≈ 0.164 s)52 RNP due to high RNA-protein electrostatic affinity. This is a result of both the small thickness of the boundary layer and the large electric field.
To verify this rapid dissociation and separation mechanism, we first tested the dissociation module without the sensing module, as shown in Fig. 4A. In Fig. 4B, we see that at the boundary layer concentrated RNP is marked by overlapping red and green fluorescence 15 minutes after the introduction of the RNP, 4 μL of 5 μM Cas9-miR-21, dissociated Cas9 migrates left as it is driven downstream of the boundary layer by electromigration and convective flow towards the cathode. As time progresses, the depletion front moves toward the anode, against the direction of flow, and the dissociated Cas9 and miR-21 further separate. The Cy2 labelled miR-21 starts to concentrate, forming a red plug. With a diffusivity of 1.8 × 10⁻⁷ cm2 s−1, we estimate the depletion boundary layer thickness D/U to be about 1.8 × 10⁻⁵ cm, which is impossible to verify experimentally. However, as time progresses, we observed the dissociated green labelled Cas9 migrate out of the depletion front region towards the cathode and precipitate at the sidewalls of the channel, as marked by blue arrows in Fig. 4D. This precipitation is due to the concentration of Cas9 near the negatively charged PC channel side walls. Recirculation flow (due to a combination of pressure-driven and electro-osmotic flow at the depletion region) convects the segregated Cas9 to the side walls where it migrates downstream by electromigration. Moreover, we do not see a concentrated green labelled Cas9 band that matches the red labelled miR-21 band at the boundary layer, suggesting all the proteins have dissociated.
To quantify this dissociation and removal of dissociated proteins, trials were run with 4 μL of 5 μM Cas9-miR-21 RNP for different concentration times and two samples were collected for each trial. These samples are the integrated flowthrough and the concentration region plug. Fluorescence intensity (FI) spectra were measured for three concentration times (15, 25, and 35 minutes) shown at excitation wavelengths of 440 nm for Cy-2 labelled Cas9 as shown in Fig. 5 and 510 nm for Cy-3 labelled miR-21 as shown in Fig. 6, each diluted to the same volume. Pure 0.1× PBS, shown as “0 minutes” in the integrated flowthrough measurements in Fig. 5A and 6A, and a pure RNP sample, shown as “sample” in the concentrated region measurements in Fig. 5B and 6B. Fig. 5 shows that there is a 63% decrease in the FI from 15 to 35 minutes for Cas9 in the concentration region and a 25× increase in the Cas9 FI from 15 to 35 minutes in the integrated flowthrough. As more RNPs are dissociated, the Cas9 is convected downstream, leading to an increase in the flowthrough and a decrease in the concentration region. Emission at 568 nm in Fig. 5 corresponds to non-dissociated RNP, and we similarly see this peak decrease in the concentration region.
Analyzing the miR-21 fluorescence emission spectra, excited at 510 nm, in Fig. 6 shows miR-21 retention of approximately 90% over 35 minutes while only 6% of the total initial miR-21 FI is measured in the flowthrough. As the retained miR-21 FI in the concentration region increased with time as well as the flowthrough miR-21 FI, we don't see a direct trend of miR-21 or RNP loss downstream during concentration and this flowthrough miR-21 may be caused by sample collection. An alternative method to quantify the dissociated miR-21 concentration in the channel, without needing to remove the concentration plug, is described in the next section to avoid this sampling bias and give a more accurate measurement of dissociated RNP concentration.
In situ sensing of dissociated RNA and dissociation efficiency
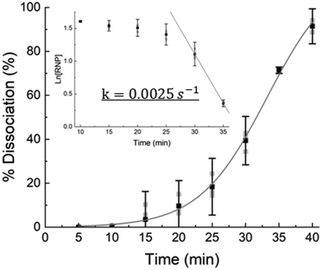
As Fig. 4 suggests that the RNP dissociation yield is a function of time because of the limiting irreversible dissociation kinetics, we verify this with direct in situ miR-21 sensing using our integrated chip (Fig. 1). Using a Cas9 and Cy3-miR-21 RNP sample, with an initial concentration [RNP]0 = 5 μM that is much higher than the dissociation equilibrium KD ∼ 0.5 nM, we quantify the concentration of dissociated miR-21 for different dissociation durations. As shown in Fig. 7, the dissociation percentage, defined by the ratio of detected miR-21, [RNA], to initial RNP concentration, or| % Dissociation = [RNA]/[RNP]0 | (1) |
We estimate the dissociation rate constant k to be about 0.0025 s−1, which is roughly consistent with literature values of koff for Cas9-miR-21 dissociation.52 In contrast, with reversible Langmuir type kinetics,53 the association kinetic constant after all the RNPs have dissociated is kon[RNP]0 + koff and, as [RNP]0 ≫ KD, the association rate constant should be roughly kon[RNP]0 or  for the tested conditions of [RNP]0 = 5 μM and KD = 0.5 nM. We have hence favored the 1000× slower dissociation rate by imposing irreversible field-assisted dissociation with the separation of dissociated products.
Conclusions
By inducing irreversible dissociation with a depletion front, we report the first assay, based on integrated perm-selective membrane modules on a biochip, that can identify and quantify the RNAs in a model RNP with high electrostatic affinity. A high dissociation yield is achieved because our design and protocol enable rapid dissociation of the RNP and separation of the dissociated RNA and protein from the thin RNP boundary layer to prevent them from reassociating. The RNP boundary layer is robust because of the low RNP diffusivity compared to the buffer ion diffusivity and is hence insensitive to any hydrodynamic dispersion effects due to front instability. This robust and thin RNP boundary layer and its high electric field is the reason for the high dissociation rate, as the electromigration time across the boundary layer is much shorter than the association kinetic time to render the dissociation irreversible. Other than significantly improved sensitivity, our platform exhibits very high throughput, with a 40 minutes assay time compared to days for the conventional CLIP and grad-seq RNP assays.There are several possible improvements of the current RNP technology towards a new liquid biopsy platform. The RNA binding proteins may have RNA-specific affinities which are pH-sensitive. Consequently, the profiling of RNAs associated with a specific protein may provide information on the intracellular and extracellular origins of the RNP, given the large pH range within a cell and the low pH of the tumor microenvironment. RNPs with miRISC proteins and stress proteins carry overexpressed RNAs due to two distinct causes: gene-silencing and external stress. Quantifying overexpression of specific RNAs in RNPs with specific proteins should hence provide more prognostic information than the overall RNA over-expression. We have shown in this report that capture of the RNP miR-21 by a functionalized oligo probe is inhibited by the bound Cas9 protein in the RNP. However, the capture of Cas9 RNP with protein antibody probes is possible, as is done in ELISA and other Cas9 detection schemes. The epitopes of Cas9 remain exposed and accessible to the antibody probes and remain relatively uninhibited by the complex formed with miR-21. This observation suggests that selective protein probes can be used to pull down different RNPs using a multiplexed membrane sensor, followed by the dissociation of bound RNAs for downstream RNA quantification. Alternatively, we can profile proteins in the RNP. We have already demonstrated the quantification of proteins with the AEM sensor in our recent work.39 Such multiplexed correlated profiling of both RNP RNA and protein would significantly elevate the sensitivity and specificity of liquid biopsy.
There are also several potential obstacles. Upstream removal of free-floating proteins and EVs with the same RNAs may need to be implemented if only RNP biomarkers are of interest. Moreover, because our technology is probe-based, any liquid biopsy platform that stems from it can only profile with known RNAs and proteins. It is hence not as comprehensive as probe-free technologies like next-generation-sequencing. It should, however, be much faster and more economical.
Author contributions
H. C. C., S. S., and K. M. conceived the idea, K. M. carried out experiments, K. M., D. B. G., S. S., and H. C. C. completed data analysis and wrote the paper.Conflicts of interest
There are no conflicts to declare.Acknowledgements
This work was also partially supported by the NIH Commons Fund, through the Office of Strategic Coordination/Office of the NIH Director, 1UH3CA241684-01, National Heart, Lung, and Blood Institute (NHLBI) under award number R01HL141909 and Arthur J Schmitt Fellowship.References
- A. M. Khalil and J. L. Rinn, Semin. Cell Dev. Biol., 2011, 22, 359–365 CrossRef CAS PubMed.
- B. M. Beckmann, A. Castello and J. Medenbach, Pfluegers Arch., 2016, 468, 1029–1040 CrossRef CAS PubMed.
- D. S. Schwarz and P. D. Zamore, Genes Dev., 2002, 16, 1025–1031 CrossRef CAS PubMed.
- N. Sanchez de Groot, A. Armaos, R. Graña-Montes, M. Alriquet, G. Calloni, R. M. Vabulas and G. G. Tartaglia, Nat. Commun., 2019, 10, 1–13 CrossRef CAS PubMed.
- E. C. Urdaneta, C. H. Vieira-Vieira, T. Hick, H. H. Wessels, D. Figini, R. Moschall, J. Medenbach, U. Ohler, S. Granneman, M. Selbach and B. M. Beckmann, Nat. Commun., 2019, 10, 1–17 CrossRef CAS PubMed.
- X. Li, J. Xu, Y. Xiao and S. Ning, Non-coding RNAs in Complex Diseases: A Bioinformatics Perspective, Springer Nature Singapore Pte Ltd., 2018 Search PubMed.
- M. Ramanathan, D. F. Porter and P. A. Khavari, Nat. Methods, 2019, 16, 225–234 CrossRef CAS PubMed.
- M. W. Hentze, A. Castello, T. Schwarzl and T. Preiss, Nat. Rev. Mol. Cell Biol., 2018, 19, 327–341 CrossRef CAS PubMed.
- M. Gerovac, J. Vogel and A. Smirnov, Front. Mol. Biosci., 2021, 8, 186 Search PubMed.
- J. Hör, S. di Giorgio, M. Gerovac, E. Venturini, K. U. Förstner and J. Vogel, Nucleic Acids Res., 2020, 48, 9301–9319 CrossRef PubMed.
- H. Qin, H. Ni, Y. Liu, Y. Yuan, T. Xi, X. Li and L. Zheng, J. Hematol. Oncol., 2020, 13, 1–23 CrossRef PubMed.
- B. Wolozin, Mol. Neurodegener., 2012, 7, 1–12 Search PubMed.
- P. K. Santhekadur and D. P. Kumar, Genes Dis., 2020, 7, 199–204 CrossRef CAS PubMed.
- M. I. Aslam, K. Taylor, J. H. Pringle and J. S. Jameson, Br. J. Surg., 2009, 96, 702–710 CrossRef CAS PubMed.
- A. Balian and F. J. Hernandez, Biomark. Res., 2021, 9, 1–16 CrossRef PubMed.
- J. D. Arroyo, J. R. Chevillet, E. M. Kroh, I. K. Ruf, C. C. Pritchard, D. F. Gibson, P. S. Mitchell, C. F. Bennett, E. L. Pogosova-Agadjanyan, D. L. Stirewalt, J. F. Tait and M. Tewari, Proc. Natl. Acad. Sci. U. S. A., 2011, 108, 5003–5008 CrossRef CAS PubMed.
- J. Balzeau, M. R. Menezes, S. Cao and J. P. Hagan, Front. Genet., 2017, 8, 1–16 Search PubMed.
- M. Ramaswami, J. P. Taylor and R. Parker, Cell, 2013, 154, 727–736 CrossRef CAS PubMed.
- Y. Yamazaki, N. Zhao and T. R. Caulfield, Nat. Rev. Neurol., 2019, 15, 501–518 CrossRef CAS PubMed.
- B. Maziuk, H. I. Ballance and B. Wolozin, Front. Mol. Neurosci., 2017, 10, 1–9 Search PubMed.
- S. Tian, H. A. Curnutte and T. Trcek, Molecules, 2020, 25, 3130 CrossRef CAS PubMed.
- J. R. Wheeler, S. Jain, A. Khong and R. Parker, Methods, 2017, 126, 12–17 CrossRef CAS PubMed.
- P. T. Nelson, A. G. Hatzigeorgiou and Z. Mourelatos, RNA, 2004, 10, 387–394 CrossRef CAS PubMed.
- F. Zhou, Y. Liu, C. Rohde, C. Pauli, D. Gerloff, M. Köhn, D. Misiak, N. Bäumer, C. Cui, S. Göllner, T. Oellerich, H. Serve, M. P. Garcia-Cuellar, R. Slany, J. P. Maciejewski, B. Przychodzen, B. Seliger, H. U. Klein, C. Bartenhagen, W. E. Berdel, M. Dugas, M. M. Taketo, D. Farouq, S. Schwartz, A. Regev, J. Hébert, G. Sauvageau, C. Pabst, S. Hüttelmaier and C. Müller-Tidow, Nat. Cell Biol., 2017, 19, 844–855 CrossRef CAS PubMed.
- D. Bautista-Sánchez, C. Arriaga-Canon, A. Pedroza-Torres, I. A. de La Rosa-Velázquez, R. González-Barrios, L. Contreras-Espinosa, R. Montiel-Manríquez, C. Castro-Hernández, V. Fragoso-Ontiveros, R. M. Álvarez-Gómez and L. A. Herrera, Mol. Ther.–Nucleic Acids, 2020, 20, 409–420 CrossRef PubMed.
- M. Hafner, M. Katsantoni, T. Köster, J. Marks, J. Mukherjee, D. Staiger, J. Ule and M. Zavolan, Nat. Rev. Methods Primers, 2021, 1, 1–23 CrossRef.
- G. Singh, E. P. Ricci and M. J. Moore, Methods, 2014, 65, 320–332 CrossRef CAS PubMed.
- C. Lin and W. O. Miles, Nucleic Acids Res., 2019, 47, 5490–5501 CrossRef CAS PubMed.
- D. Kang, Y. Lee and J. S. Lee, Cancers, 2020, 12, 1–33 Search PubMed.
- I. J. MacRae, E. Ma, M. Zhou, C. V. Robinson and J. A. Doudna, Proc. Natl. Acad. Sci. U. S. A., 2008, 105, 512–517 CrossRef CAS PubMed.
- A. Deerberg, S. Willkomm and T. Restle, Proc. Natl. Acad. Sci. U. S. A., 2013, 110, 17850–17855 CrossRef CAS PubMed.
- S. Mili and J. A. Steitz, RNA, 2004, 10, 1692–1694 CrossRef CAS PubMed.
- D. Taller, K. Richards, Z. Slouka, S. Senapati, R. Hill, D. B. Go and H. C. Chang, Lab Chip, 2015, 15, 1656–1666 RSC.
- Z. Slouka, S. Senapati and H. C. Chang, Annu. Rev. Anal. Chem., 2014, 7, 317–335 CrossRef CAS PubMed.
- S. Marczak, K. Richards, Z. Ramshani, E. Smith, S. Senapati, R. Hill, D. B. Go and H. C. Chang, Electrophoresis, 2018, 39, 2029–2038 CrossRef CAS PubMed.
- C. Zhang, G. Sun, S. Senapati and H. C. Chang, Lab Chip, 2019, 19, 3853–3861 RSC.
- G. Sun, S. Senapati and H. C. Chang, Lab Chip, 2016, 16, 1171–1177 RSC.
- Z. Yin, Z. Ramshani, J. J. Waggoner, B. A. Pinsky, S. Senapati and H. C. Chang, Sens. Actuators, B, 2020, 310, 127854 CrossRef CAS.
- Z. Ramshani, F. Fan, A. Wei, M. Romanello-Giroud-Joaquim, C. H. Gil, M. George, M. C. Yoder, D. Hanjaya-Putra, S. Senapati and H. C. Chang, Talanta, 2021, 225, 122021 CrossRef CAS PubMed.
- S. Sensale, Z. Ramshani, S. Senapati and H. C. Chang, J. Phys. Chem. B, 2021, 125, 1906–1915 CrossRef CAS PubMed.
- U. Göbel, R. Maas and A. Clad, J. Biochem. Biophys. Methods, 1987, 14, 245–260 CrossRef PubMed.
- L. J. Cheng and H. C. Chang, Lab Chip, 2014, 14, 979–987 RSC.
- L. J. Cheng and H. C. Chang, Biomicrofluidics, 2011, 5, 1–8 CrossRef PubMed.
- Z. Ramshani, C. Zhang, K. Richards, L. Chen, G. Xu, B. L. Stiles, R. Hill, S. Senapati, D. B. Go and H. C. Chang, Commun. Biol., 2019, 2, 1–9 CrossRef PubMed.
- S. Senapati, Z. Slouka, S. S. Shah, S. K. Behura, Z. Shi, M. S. Stack, D. W. Severson and H. C. Chang, Biosens. Bioelectron., 2014, 60, 92–100 CrossRef CAS PubMed.
- J. N. Chuang, P. Y. Diao, W. S. Huang, L. F. Huang, S. Senapati, H. C. Chang and Y. M. Sun, ACS Appl. Mater. Interfaces, 2020, 12, 54459–54472 CrossRef CAS PubMed.
- G. Chen, A. A. Abdeen, Y. Wang, P. K. Shahi, S. Robertson, R. Xie, M. Suzuki, B. R. Pattnaik, K. Saha and S. Gong, Nat. Nanotechnol., 2019, 14, 974–980 CrossRef CAS PubMed.
- W. Sun, W. Ji, J. M. Hall, Q. Hu, C. Wang, C. Beisel and Z. Gu, Angew. Chem., Int. Ed., 2015, 54, 12029–12033 CrossRef CAS PubMed.
- X. Lai and A. Friedman, PLoS One, 2016, 11, e0167706 CrossRef PubMed.
- P. D. Grossman and D. S. Soane, J. Chromatogr., 1991, 559, 257–266 CrossRef CAS PubMed.
- N. Stellwagen, C. Gelfi and P. G. Righetti, Biopolymers, 1998, 42, 687–703 CrossRef.
- A. T. Raper, A. A. Stephenson and Z. Suo, J. Am. Chem. Soc., 2018, 140, 2971–2984 CrossRef CAS PubMed.
- I. Langmuir, J. Am. Chem. Soc., 1918, 40, 1361–1403 CrossRef CAS.
| This journal is © The Royal Society of Chemistry 2023 |

