 Open Access Article
Integrated silicon microfluidic chip for picoliter-scale analyte segmentation and microscale printing for mass spectrometry imaging
Weihua
Shi†
 a,
Sara
Bell†
 b,
Hrishikesh
Iyer
 a,
Christopher Kenji
Brenden
 c,
Yan
Zhang
a,
Sungho
Kim
 a,
Insu
Park
 c,
Rashid
Bashir
 c,
Jonathan
Sweedler
 b and
Yurii
Vlasov
 *ac
*ac
aDepartment of Electrical and Computer Engineering, University of Illinois Urbana Champaign, IL 61801, USA. E-mail: yvlasov@illinois.edu
bDepartment of Chemistry and the Beckman Institute, University of Illinois Urbana Champaign, IL 61801, USA
cDepartment of Bioengineering, University of Illinois Urbana Champaign, IL 61801, USA
First published on 7th December 2022
Abstract
A silicon single-chip microfluidics system that integrates microscale fluidic channels, an analyte segmentation device, and a nozzle for electrohydrodynamic-assisted printing is designed for hyphenation with MALDI mass spectrometry (MS) imaging. A miniaturized T-junction segments analytes into monodisperse picoliter oil-isolated compartments. The printing nozzle deposits generated droplets one-by-one into an array on a conductive substrate without splitting or coalescing. Virtually single-shot MS analysis is enabled due to the ultrasmall droplet volumes and highly localized printing. The signal-to-noise ratio indicates that detection limits at the attomole level are achieved for γ-aminobutyric acid.
Introduction
Automated liquid handling and dispensing through droplet arrays is attracting increasing interest in the fields of single cell analysis,1 drug discovery2 and clinical diagnosis.3 Compared with conventional multiwell plate approaches, droplet arrays minimize sample consumption4 and enable high throughput screening.5,6 A reduced sample volume lowers the detection limit for analysis techniques such as matrix-assisted laser desorption–ionization mass spectrometry (MALDI-MS), which is attributed to the decreased spreading of the dried sample spot.7 Owing to the isolated detection on each droplet, the droplet array also enables analyte concentration monitoring8 if the droplets are printed following the chronological order in which they were sampled, preserving the temporal resolution.9For applications such as neurochemistry,9–11 being able to monitor the dynamics of neurotransmitter release is vital for investigating brain function. To achieve a high recovery rate in microdialysis, sampling at ultra-low perfusion flow rates is beneficial.10 However, during sampling, transportation, and detection stages, temporal resolution could be compromised by Taylor dispersion,12 where the concentration gradient of the analyte is smeared out due to longitudinal diffusion. Therefore, collecting samples as a segmented flow9,10 has been proposed to improve temporal resolution by confining Taylor dispersion within each segmented oil-isolated analyte droplet. If the analyte is segmented near the sampling port and then printed on a MALDI substrate, the resulting array represents a series of chemical events in a chronological order, with the temporal resolution defined by the segmentation frequency.
While temporal resolution could be preserved by analyte segmentation, the volume of droplets is typically at the microliter scale9–11,13 resulting in increased surface spreading during deposition that lowers MS sensitivity.13 Smaller picoliter droplets are therefore beneficial for reduction of analyte spreading upon deposition,14 increased ionization efficiency, better tolerance to salt contamination and oil interference, leading to lower limits of detection (LODs).15 However, typical microfluidic devices based on a polydimethylsiloxane (PDMS) platform are utilizing relatively large 100 × 100 μm2 channel cross-sections with flow rates in the μL min−1 range, that, together with the small Young's modulus of PDMS and unwanted swelling, make it difficult to control the ultra-small droplet formation in the picoliter regime. Complex multistage designs16 or utilization of surfactants17 are required to produce pL-scale monodisperse droplets. Owing to a much larger Young's modulus and precise control of microfluidic channels down to a few μm radius, silicon microfluidics provides superior control of the ultralow flow rates in the nL min−1 range critical for maintaining droplet volumes in the picoliter regime18 and maintaining their monodispersity.19
To transfer droplets onto a MALDI substrate while preserving their chronological order, various deposition techniques have been reported including contact printing,20 as well as contactless approaches including electrospray deposition21 and electrohydrodynamic (EHD) assisted printing.22 Contact printing enables deposition13 or formation23 of picoliter to femtoliter droplets by passing a waterfront through an array of prepatterned hydrophilic sites. Among contactless methods, electrospray ionization has been used to introduce picoliter-scale segmented analytes for MS analysis;10,19 however, when used for deposition on a MALDI substrate, analytes are aerosolized and ionized in the electrosprayed jet24 which significantly increases the spread of printed patterns and lowers MS sensitivity.14 The EHD-assisted printing with electric field strength below the formation of the electrospray jet has been demonstrated to produce pL-scale droplets,25,26 limited, however, to a continuous non-segmented analyte flow. To achieve contactless printing of oil-segmented picoliter droplets into a MALDI array while simultaneously preserving their chronological order, high temporal resolution, and minimal spreading area, the integration of flow segmentation and printing functionalities in a single device is needed.
In this paper, a single-chip silicon integrated device is developed to segment continuous analytes into pL droplets, and then prints droplets individually into a MALDI array. Attomole-level detection sensitivity is demonstrated for a deposit site localized within the area of a single laser shot.
Fabrication
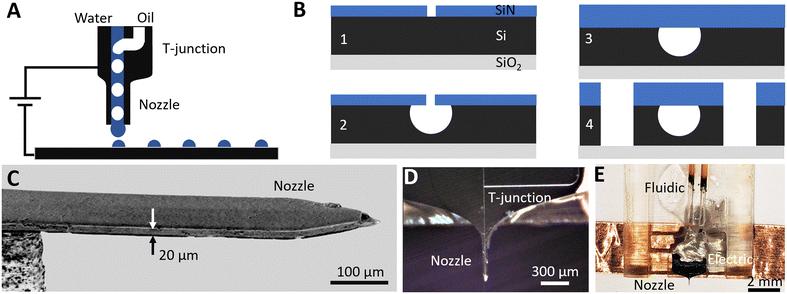
To segment analytes into a series of individual oil-isolated compartments and then print them one-by-one with the assistance of an electric field, a microfabrication platform19 based on silicon on insulator (SOI) wafers is used. It consists of three levels of aligned photolithography, several steps of dielectric deposition and etching. Here, four devices (Fig. 1A) are integrated on-chip: connection stubs for fluidic interfacing, sealed surface channels that provide microfluidic flow, a T-junction droplet generator for monodisperse analyte segmentation, and a printing nozzle for individual droplet transfer.The fabrication is divided into two stages (Fig. 1B): channel definition (Fig. 1B.1–3) and formation of a printing nozzle (Fig. 1B.4). The chip is built on an SOI wafer (UltraSil LLC) with a doped 15 μm device layer, a 0.5 μm buried oxide layer and a 450 μm handle layer. Silicon, as a rigid substrate, eliminates channel deformation and resulting pressure fluctuations to provide stable ultralow flows down to a few nL min−1. To define microfluidic channels, a 0.3 μm hard mask of SiNx is first deposited on top of the device layer via plasma enhanced chemical vapor deposition (PECVD) (Fig. 1B.1). Direct laser writing (Heidelberg μPG 101) is used to pattern the SiNx mask, creating a line of 1 μm diameter holes separated by 2 μm gaps along the center of the designed channel length. Inductively coupled plasma reactive ion etching (ICP-RIE) is then used to open the patterned holes on the SiNx mask, and isotropic XeF2 etching is performed to form hemispherical microfluidic channels (Fig. 1B.2). The channel radius can be tuned from 7 to 12 μm by controlling the XeF2 etching time. A 7 μm radius ensures that etched portions under adjacent 1 μm holes merge uniformly to form a continuous microfluidic channel. A maximum radius of 12 μm is limited by the 15 μm device layer thickness. To seal the 1 μm holes in the SiNx mask, a 4 μm thick layer of SiNx is deposited by PECVD (Fig. 1B.3).
To define the perimeter of the printing nozzle (Fig. 1B.4), contact photolithography is performed on the device layer side. ICP-RIE is used to etch through the SiNx mask, then deep reactive ion etching (DRIE) is used to etch through the Si device layer until the buried oxide layer is reached. Finally, aligned contact photolithography and DRIE are performed from the handle layer side (not shown) to undercut the nozzle and to release the chip from the wafer. The scanning electron microscopy (SEM) side view image of the released nozzle cantilever (Fig. 1C) shows a rectangular shape suspended silicon needle with a 15 × 75 μm cross-section. To efficiently electrify droplets at the nozzle outlet to ease printing, the device layer is heavily doped yielding 0.005 Ω cm resistance providing electrical contact without charging of the analyte flow.27
The fabricated chip that integrates an upstream T-junction droplet generator, downstream printing nozzle and sealed microfluidic channels (Fig. 1D) is released from the wafer and is packaged to provide fluidic and electrical interfaces (Fig. 1E). To interface with external microfluidic pumps, the inlet/outlet of each microfluidic channel is shaped into a 170 × 450 μm silicon 1400 μm long stub to fit with silica capillaries (Polymicro TSP530700, 650 μm ID). UV curable resin (Norland Products, NOA 68T) is applied at the stub–capillary junction to ensure airtight sealing. For electrical connection, copper tape is bound to the doped device layer via conductive adhesive (MG Chemicals 8331D). The final device (Fig. 1E) with fluidic and electrical interfaces is packaged into a 3D-printed plastic holder.
Analyte segmentation
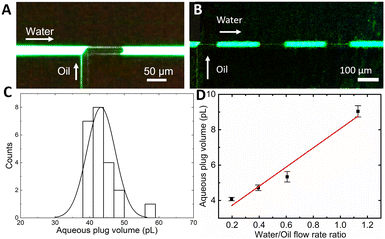
Since the inner surface of the as-fabricated microfluidic channels is covered by a thin silicon dioxide layer, the channels' surface is hydrophilic. Therefore, the oil phase is dispersed, while the aqueous phase is continuous. To segment the aqueous analyte (10 μM fluorescein, Sigma-Aldrich in DI water) into monodisperse picoliter-scale plugs separated by oil droplets (Fluorinert FC40, Sigma-Aldrich), a cross-flow shear in a T-junction structure with a 12 μm channel radius is utilized (Fig. 2). The aqueous phase flow was maintained at a constant flow rate of 15 nL min−1 by a syringe pump (Harvard Apparatus Pump11 Elite). The oil phase was introduced at a pressure varied between 100 and 500 mbar by a pressure pump (FlowEZ LU-FEZ-7000) to tune the flow rate ratio.As fabricated, the microfluidic channels are hydrophilic, hence oil is the segmented phase, while the aqueous phase is continuous. Previous MS measurements28 of the potential carry-over of analytes between consecutive aqueous plugs have shown that carry-over of analytes in the oil-segmented aqueous flow between aqueous plugs of similar volume and frequency is suppressed by at least 3 orders of magnitude.
Since the silicon nitride sealing on top of a surface microfluidic channel is transparent for visible light, the droplet flow can be analysed with standard fluorescence microscopy (Olympus IX73 fitted with a Canon Rebel T7i video camera). Fig. 2A displays a single frame in a video recorded during droplet formation at an oil pressure of 300 mbar (1![[thin space (1/6-em)]](https://www.rsc.org/images/entities/char_2009.gif) :
:![[thin space (1/6-em)]](https://www.rsc.org/images/entities/char_2009.gif) 2 oil to water flow rate ratio), which shows a characteristic “necking” of the oil protruding into the aqueous phase flow and blocking the entire channel diameter. The oil droplet generates a pressure build-up in the channel that eventually overcomes the interfacial tension between phases followed by the droplet's release.17 When operating in such a “squeezing” regime,29 the process results in a repeatable generation of almost identical aqueous plugs (Fig. 2B). Analysis of recorded videos reveals the mean aqueous phase volume of 43 pL with a monodispersity of 9% relative standard deviation (SD) (Fig. 2C). Both, a plug frequency of 2.1 Hz with an SD of 0.2 and volume, are stable for tens of minutes of continuous operation. By adjusting the oil to water flow rate ratio from 0.5 to 3 by tuning the oil phase pressure, the aqueous plug volume can be continuously tuned down to 25 pL.
2 oil to water flow rate ratio), which shows a characteristic “necking” of the oil protruding into the aqueous phase flow and blocking the entire channel diameter. The oil droplet generates a pressure build-up in the channel that eventually overcomes the interfacial tension between phases followed by the droplet's release.17 When operating in such a “squeezing” regime,29 the process results in a repeatable generation of almost identical aqueous plugs (Fig. 2B). Analysis of recorded videos reveals the mean aqueous phase volume of 43 pL with a monodispersity of 9% relative standard deviation (SD) (Fig. 2C). Both, a plug frequency of 2.1 Hz with an SD of 0.2 and volume, are stable for tens of minutes of continuous operation. By adjusting the oil to water flow rate ratio from 0.5 to 3 by tuning the oil phase pressure, the aqueous plug volume can be continuously tuned down to 25 pL.
Even smaller aqueous plug volumes are attainable (Fig. 2D) by decreasing the microfluidic channel radius down to just 7 μm by adjusting the XeF2 etching time. In this chip, with the oil phase pressure tuned from 300 to 500 mbar and the aqueous phase flow rate kept constant at 10 nL min−1, the flow rate ratio is tuned from 0.2 to 1.1. The resulting mean aqueous plug volume is tuned from 4 to 9 pL (Fig. 2D). Within the whole tuning range, the monodispersity is preserved below 5% RSD and the dependence of the aqueous plug volume on the flow rate ratio shows high linearity (R2 = 0.962), confirming operation in the squeezing regime.30
Nozzle tip design for EHD-assisted printing
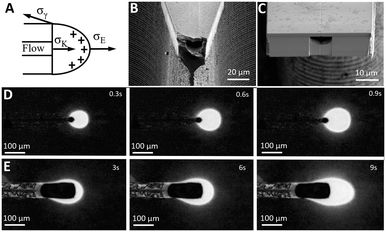
Once the analyte is segmented into a train of individual pL-scale aqueous plugs at a few Hz frequency, they need to be deposited one-by-one onto a MALDI substrate without splitting or coalescing to preserve their chronological order and ensure temporal resolution of the MS analysis. The goal for the nozzle tip design, therefore, is to guarantee that the upstream pulsatile dripping at the tip31 is in resonance with the volume and frequency of droplets generated downstream at the T-junction. That is challenging since the pulsatile flow segmentation at the nozzle tip is defined by a balance of many forces (Fig. 3A). A viscous drag of the flow pulling on the protruding water meniscus at the nozzle tip,32σK = 4/3ρQU (where ρ is the liquid density, Q is the flow rate, and U is the average velocity of the liquid), may not be enough for ultra-slow nL min−1 flow rates to overcome a counteracting interfacial tension, σγ = 2πLγ (where γ is the surface energy and L is the wetting perimeter), that keeps protruding water from being detached from the silicon interface (Fig. 3A). Gravitational forces, important for microliter and nanoliter volume droplets,13 can be neglected for picoliter volumes since the Bond number (the ratio of gravity to interfacial tension) is only 10−5. Therefore, under gravity alone, picoliter segmented analytes will coalesce into much larger droplets at a slower frequency, hence degrading the temporal resolution and mixing their chronological sequence for the MALDI-MS analysis.EHD-assisted printing22 enables fine tuning of the droplet detachment since it relies on additional electrostatic force,33σE = 2πr2ε0Ec2 (where r is the droplet radius, ε0 is the air permittivity, and Ec is the electric field strength), that changes the force balance at the nozzle tip (Fig. 3A). Various EHD spraying regimes31 are typically observed with the increase of electric field strength starting with dripping, followed by micro-dripping, spindle, and cone-jet.26 Among these regimes, droplet formation in the pulsatile micro-dripping regime is preferred when a periodic series of monodisperse (no siblings) droplets34 with a diameter about the nozzle size D are formed at an axially stable meniscus.26 However, the micro-dripping regime occurs only within a narrow range of electric field strengths and flow rates.26,34
To explore this parametric space to produce pL-scale aqueous droplets at a few Hz frequency, two complementary tip designs are fabricated (Fig. 3B and C) with the same width of the nozzle base of 75 μm that is either tapered down to a sharp tip (Fig. 3B) or terminated in a flat tip (Fig. 3C). This additional capability, provided by silicon micro-fabrication to lithographically define the micron-scale geometry of the nozzle, enables the influence of the balance of forces (Fig. 3A) by modulation of the wetting perimeter L, and concentrating the electric field at the sharpened nozzle tip19 as opposed to a more uniform field in the flat tip design.
To map the parametric space of a micro-dripping regime in both designs, a series of experiments were performed to electrospray a continuous aqueous phase (10 μM fluorescein in DI water) at different flow rates (5 nL min−1 and 20 nL min−1) and applied voltages. A voltage is applied between the chip and the ITO coated glass slide (Delta Tech CB-40IN-S111) located at a 2 mm distance from the nozzle tip. To quantify droplet formation, a fluorescence microscopy video was recorded, and a single background image was subtracted from all individual frames (Fig. 3D and E) to increase the droplet visibility. The resulting high-contrast images captured during EHD-assisted deposition enable the measurements of the droplet volume and frequency at different voltages and flow rates for both sharp-tip (Fig. 3D) and flat-tip (Fig. 3E) designs.
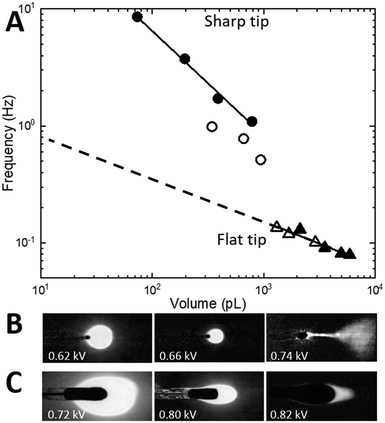
For the sharp-tip design, at voltages below 0.62 kV, large and irregular nL-scale droplets are accumulated at the tip driven mostly by gravity (Fig. 4B, left). At voltages higher than 0.72 kV (Fig. 4B, right), the EHD spraying occurs in the form of unstable spindles and microjets.26,31 The range of voltages between 0.64 kV and 0.7 kV at a constant 20 nL min−1 flow rate results in pulsatile generation of almost identical droplets (Fig. 4B, center) indicative of a micro-dripping regime.26,31 At 0.64 kV, the sharp-tip design produced droplets with a mean volume of 786 ± 15 pL at 1.1 ± 0.2 Hz (Fig. 3D). A gradual increase of the voltage in 0.2 kV increments results in the decrease of the droplet volume accompanied by a reduction of pulsation frequency that is summarized in a log–log plot in Fig. 4A (circles). At 20 nL min−1 flow rate (closed circles), the log–log dependence shows high linearity (R2 = 0.998, black line) with a slope of −0.895. At the slower 5 nL min−1 flow rate (open circles), the droplet frequency decreased 2× with a similar slope.
In contrast, for the flat-tip design (Fig. 4C), the voltage range for a stable micro-dripping regime is shifted to higher voltages between 0.7 kV and 0.82 kV. At 0.80 kV and 20 nL min−1, much larger 2100 ± 100 pL droplets are generated at a 10× slower frequency of 0.12 ± 0.01 Hz (Fig. 3E). The corresponding log–log plot (Fig. 4A, triangles) exhibits highly linear dependence (slope −0.384, R2 = 0.928, black line), almost identical to both 5 nL min−1 (open triangles) and 20 nL min−1 (closed triangles) flow rates.
Scaling dependencies of EHD-assisted spraying are defined by the quasi-static force balance σE + σK = σγ at the time of the droplet detachment35 (Fig. 3A). If the dimensionless electric Bond number BE = ε0Ec2D/γ is introduced, the force balance for the micro-dripping regime, when droplet diameter 2r is of the order of outlet nozzle size D and of the wetting perimeter L, can be rewritten as:
 | (1) |
The results for the sharp tip design (Fig. 4A, circles) differ significantly from eqn (1), that is most likely defined by two separate contributions to the force balance. First, the flow velocity U is measured to be 2× faster than that in the flat tip design that is likely to be induced by larger electro-osmotic drag due to higher field concentration at the sharp tip discontinuity.19 This results in 4× larger kinetic force σK indicating faster droplet detachment and hence higher frequency. Second, the interfacial tension σγ is 3× smaller than that in the flat tip design due to smaller wetting perimeter L (Fig. 3D). Considering the electro-osmotic acceleration, the force balance requires35ρr4f2 ∼ ε0Ec2r2, and eqn (1) can be rewritten as:
| fV = BE0.5 | (2) |
Our estimate of the balancing forces at the tip end (Fig. 3A) indicates that the scaling dependence between the frequency and volume outlined in eqn (1) and (2) (Fig. 4A) is, to a first approximation, invariant to the concentration of analytes and to the concentration of various salts which are abundant in biological samples. The electrostatic force σE acting on a hanging droplet at the tip of an electrified nozzle does not depend36 on liquid conductivity K if the electric relaxation time te = ε0ε/K, required for the equipotential to reach the droplet surface, is much shorter than the droplet detachment time. For example, the te is about 10−10 s for the cerebrospinal fluid (ε = 109 and K = 2 S m−1 at low frequency37) that is at least 9 orders of magnitude faster than the printing period used here. For analytes with a concentration of a few μM dissolved in DI water, the conductivity K is still large enough38 (K = 2 × 10⁻⁴ S m−1) to yield a te of 10−6 s, still 5 orders smaller than the printing period. The te is becoming long enough to potentially affect droplet detachment only for the DI water of grade 3 (K = 10−7 S m−1).
Resonant one-to-one droplet deposition
Neither of the nozzle tip designs could operate at resonance with the droplet train generated at the T-junction (a few pL at frequencies around 1 Hz). Therefore, under conditions explored in Fig. 4, the aqueous plugs generated at the T-junction during flow segmentation will either split into smaller droplets or coalesce into larger ones thus disrupting their chronological sequence and degrading temporal resolution. Intuition built upon the results in Fig. 4 implies that if the balance of forces can be shifted towards smaller volumes and higher frequencies, the resonance condition can potentially be within reach for the flat-tip design as indicated by extrapolation of experimental results to smaller volumes (dashed line in Fig. 4A). It has been shown39 that the transition from dripping to spindle and jetting modes occurs at the critical Weber number, We = ρv22r/γ, that depends on the flow velocity v. Widening the channel radius from 7 μm (design in Fig. 2D and 4) to 12 μm (design in Fig. 2A–C) will decrease the flow velocity (hence the critical Weber number) as much as 5-fold.39 Therefore, at the same flow rate, by increasing the channel radius, the boundary from micro-dripping to jetting regimes will be pushed to higher voltages, so that smaller droplets could be printed.To verify this intuition, the Si integrated chip with 12 μm radius channels equipped with a T-junction (design in Fig. 2A–C) and a flat-tip nozzle (design in Fig. 3C) was fabricated. The chip was mounted in front of an ITO coated glass slide (Delta Tech CB-40IN-S111) at a 2 mm distance. For chemical sensitivity measurements, 200 μM γ-aminobutyric acid (GABA) is added to the aqueous phase (10 μM fluorescein, Sigma-Aldrich in DI water). Under the same conditions as in Fig. 2C (aqueous flow rate = 15 nL min−1 and oil pressure = 300 mbar with a 1![[thin space (1/6-em)]](https://www.rsc.org/images/entities/char_2009.gif) :
:![[thin space (1/6-em)]](https://www.rsc.org/images/entities/char_2009.gif) 2 oil to water flow rate ratio) and with application of 1.2 kV between the chip and the slide, the flow is segmented into a series of monodisperse oil-separated aqueous plugs.
2 oil to water flow rate ratio) and with application of 1.2 kV between the chip and the slide, the flow is segmented into a series of monodisperse oil-separated aqueous plugs.
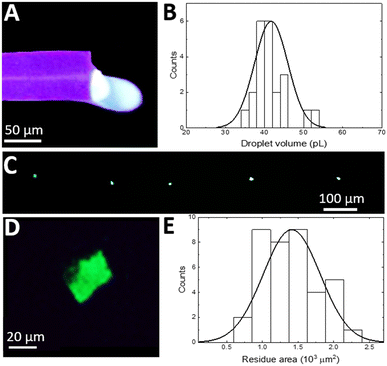
Analysis of fluorescence microscopy images taken at the outlet of a printing nozzle right before the aqueous droplet detachment (Fig. 5A) shows stable pulsatile (2 Hz frequency) generation of monodisperse droplets with a mean volume of 42 pL and 10% SD (Fig. 5B). The distribution in Fig. 5B was determined to not differ significantly (t-test, p = 0.054) from that in Fig. 2C. This confirms that the device operates in resonance with aqueous droplets leaving the nozzle individually one-by-one without splitting or coalescing.
To print an array of the droplets, the ITO glass slide was fixed on top of a motorized stage translated at a constant 500 μm s−1 speed. Once deposited, droplets evaporate leaving a periodic array of deposits on the slide surface. Bright-field and fluorescence microscopy techniques using an Axio Imager M2 (Carl Zeiss, Jena, Germany) were used to visualize residue locations with respect to fiducial marks (Fig. 5C). Images were stitched and exported using Zen 2 (Carl Zeiss, Blue edition) software.
The observed fluorescently labelled residues are separated by a constant 250 μm gap (Fig. 5C) which is expected for a stage traveling at 500 μm s−1 at 2 Hz generation and transfer frequency. Further analysis of the fluorescent residues (Fig. 5D) shows an area of 1250 μm2 (Fig. 5D) consistent with the expected 40 μm diameter of a 40 pL droplet. The distribution of fluorescent residue areas for 38 printed droplets (Fig. 5E) has a mean value of 1410 μm2 with 28% SD that confirms that each fluorescence residue corresponds to an individual aqueous droplet. No sign of oil was observed throughout the substrate that is likely due to fast evaporation of oil droplets with a volume as small as just 20 pL (2![[thin space (1/6-em)]](https://www.rsc.org/images/entities/char_2009.gif) :
:![[thin space (1/6-em)]](https://www.rsc.org/images/entities/char_2009.gif) 1 water to oil ratio in Fig. 2B).
1 water to oil ratio in Fig. 2B).
Characterization of droplets during all stages of droplet generation, transfer, detachment, and landing confirms that individual, intact droplets are transferred.
Mass spectrometry of deposited droplets
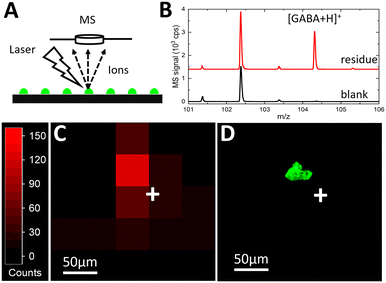
Matrix-assisted laser desorption/ionization-time of flight (MALDI-TOF) mass spectrometry imaging (MSI) was used to map the chemical contents of the deposited droplet arrays. MSI can provide untargeted, multiplexed detection in biochemical systems,40 making it an ideal detection method to couple to the Si platform for future biomedical applications. To perform MALDI-MSI, after fluorescence microscopy, the ITO glass slide was covered with a thin layer of a common MALDI matrix, α-cyano-4-hydroxycinnamic acid (CHCA). The CHCA solution was prepared at 10 mg mL−1 in 70% acetonitrile. An HTX-M5 Sprayer (HTX Technologies, Chapel Hill, NC) was used to apply the matrix to the glass surface at 100 μL min−1 and 60 °C, with nebulizing gas pressure at 10 psi. The fluorescence image acquired in Fig. 5C was used within FlexImaging (Bruker Corp., Billerica, MA) to identify sites for targeted MALDI-MSI of the printed droplets. Mass spectra were acquired on an UltrafleXtreme MALDI TOF/TOF mass spectrometer with a frequency tripled Nd:YAG solid-state laser (Bruker Corp.) using a spatial resolution of 50 × 50 μm2, the “Ultra” laser setting, and 100 laser shots.When the MALDI laser spot is focused on the target area (Fig. 6A), a clear ion signal at m/z = 104.07 is detected (Fig. 6B, red) corresponding to [M + H]+ of GABA. The GABA signal taken at an adjacent blank spot representing the background (Fig. 6B, black) is 2–3 orders of magnitude smaller. The appearance of this signature peak only at the residue site confirms that the signal at m/z = 104.07 cannot be attributed to matrix or background interference. The nearby peak at around m/z = 102.5 is attributable to the matrix or contamination but does not interfere or overlap with GABA signal detection. These mass spectra confirm that the analyte signal is detected at the printing site, and the signal peak is isolated well enough to avoid interference.
The unwanted spatial delocalization of the analyte can occur due to analyte diffusion beyond the initial printed droplet residue during solution-based matrix application that can significantly degrade chemical sensitivity. It has been shown14 that the analyte diffusion with the CHCA matrix application procedure is negligible for 60 pL deposited droplets. To evaluate potential analyte spreading, a spatial resolution study of the MS signal was performed to compare MSI signal mapping (Fig. 6C) with the fluorescent droplet areas (Fig. 6D). The MSI heat map shows the spatial distribution of the GABA signal at m/z = 104.07 (Fig. 6C). Total ion count (TIC) normalization is used to reduce the effect of differences in ionization efficiency and/or matrix–analyte co-crystallization across pixels representing adjacent spots on the ITO glass slide. Since the laser step size (pixel width) is set at 50 μm while the laser beam diameter is 100 μm, the GABA signal from a 40 μm diameter fluorescent droplet residue is expected to be confined to a 100 μm radius. The heat map shows that the GABA signal is mostly concentrated in a single 50 μm pixel with a few, lower intensity adjacent pixels within a 100 μm radius.
To identify the localization of the MS signal at m/z = 104.07 relative to the position of the deposited residue, the fluorescence image (Fig. 6D) of the substrate was acquired from the same area as the MS image (Fig. 6C). The fluorescent droplet residue at the same coordinates (relative to the white crosses in Fig. 6C and D that mark the same location) is strongly co-localized with the pixel of the highest intensity GABA signal. Even with the current step-wise scanning approach for MSI, the number of pixels scanned per printed droplet is relatively small due to the ultrasmall pL droplet volume indicating virtually single-pixel sample ionization.
MALDI-MS imaging of printed droplet array
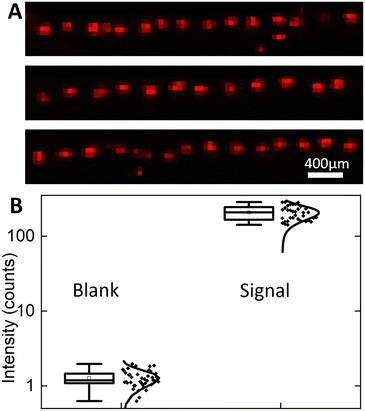
To demonstrate the capability of the system for high-throughput droplet array printing and high sensitivity MALDI-MSI detection, 41 droplets were printed in a row and then analysed by MALDI-MSI. A 1 mm long area was scanned using the same MALDI-MSI parameters above to create the TIC normalized GABA signal heat map for all 41 droplets (Fig. 7A). All printed droplets are detected as well-isolated 100 μm radius individual GABA deposits. Since the frequency for droplet transfer is 2 Hz, it takes only 20 seconds to print this line automatically, enabling further expansion into 2D arrays by adding another axis of movement to the mechanized stage. These results confirm the high throughput printing and detection capabilities of the system.To assess the chemical sensitivity of the approach, the signal to noise ratio (SNR) and limits of detection (LODs) of MALDI-MSI for GABA detection are estimated. The LOD for MSI is expected to be improved14 by concentrating the analyte to a small area. Owing to analyte segmentation into pL droplets, the MS signal is strongly localized with a single printed site not extending beyond 100 μm diameter thus promising high sensitivity (Fig. 6C). To provide a noise level reference, a blank background signal is collected during MSI scanning in the immediate vicinity of the GABA residue. The highest intensity, TIC normalized intensity at m/z = 104.07 for blank pixels, is 1.98, which is attributable to chemical noise and possible isobaric ions formed from the MALDI matrix and/or the ITO-coated glass surface. This highest intensity signal from blank pixels is used as a threshold to distinguish between the true GABA signal and background signal. For all pixels at each printing site, pixels with TIC normalized intensity (m/z = 104.07) higher than the threshold of 1.98 are considered pixels with the GABA signal. All pixels with signal intensity above the threshold for a given printed site are summed to calculate the total GABA intensity per printed droplet area. The mean summed intensity at printed sites is found to be 206.6 ± 44.6 (mean ± standard deviation), while blank pixels only have 1.27 ± 0.32 (Fig. 7B). Given that each droplet contains 40 pL of 200 μM solution of GABA, the measured summed signal from each printed site corresponds to 8 femtomoles of GABA molecules. To calculate the LOD, a single point calculation was done since only one GABA concentration was printed. The mean blank intensity + 3× blank standard deviation was calculated as 2.2 to represent the signal intensity for GABA at the LOD. To determine the concentration of GABA corresponding to the LOD, the LOD signal is multiplied by the ratio of 8 fmol per mean summed droplet intensity to yield an LOD of 86 amol. Therefore, an attomole level LOD for the MSI detection of GABA was achieved using the Si integrated chip with a flat nozzle for automated, high-throughput droplet array printing.
Conclusions
A silicon microfluidic chip that integrates multiple devices including microfluidic channels, analyte segmentation, a nozzle for EHD-assisted droplet printing, and packaging stubs is designed and fabricated. The T-junction analyte segmentation device operating at an ultralow nL min−1 flow rate produced monodisperse droplets with tuneable volumes at the picoliter scale. The EHD-assisted printing nozzle design operates in resonance with the pre-segmented analytes to print droplets individually one-by-one without splitting or coalescing. Printed droplets on ITO glass are highly localized and well-isolated forming a periodic array that is ideal for MALDI-MSI analysis. Virtually single-pixel acquisition of mass spectra is enabled due to the ultrasmall droplet volumes and highly localized printed droplet deposits. A fewer pixels per droplet concentrate the MS signal and increase the sensitivity leading to an 86 attomole LOD for GABA. This integrated Si chip has strong potential for single cell analysis, by virtue of the reduction of the droplet volume down to the single cell level. Application of this approach to microdialysis-based neurochemistry,40 where the sample volume is usually limited and temporal information needs to be preserved, is promising.Author contributions
The manuscript was written through contributions of all the authors. All the authors have given approval to the final version of the manuscript.Conflicts of interest
There are no conflicts to declare.Acknowledgements
The research reported in this publication was supported in part by the NINDS of the NIH grants UF1NS107677 and RF1NS126061 and the NSF grant 1735252. The content is solely the responsibility of the authors and does not necessarily represent the official views of the National Institutes of Health.Notes and references
- Y. Zhu, Y.-X. Zhang, W.-W. Liu, Y. Ma, Q. Fang and B. Yao, Sci. Rep., 2015, 5, 9551 CrossRef.
- A. Kulesa, J. Kehe, J. E. Hurtado, P. Tawde and P. C. Blainey, Proc. Natl. Acad. Sci. U. S. A., 2018, 115, 6685–6690 CrossRef.
- A. C. Hatch, J. S. Fisher, A. R. Tovar, A. T. Hsieh, R. Lin, S. L. Pentoney, D. L. Yang and A. P. Lee, Lab Chip, 2011, 11, 3838–3845 RSC.
- T. S. Kaminski, O. Scheler and P. Garstecki, Lab Chip, 2016, 16, 2168–2187 RSC.
- G. Du, Q. Fang and J. M. den Toonder, Anal. Chim. Acta, 2016, 903, 36–50 CrossRef CAS PubMed.
- J. G. Xu, M. S. Huang, H. F. Wang and Q. Fang, Anal. Chem., 2019, 91, 10757–10763 CrossRef CAS PubMed.
- S. Jespersen, W. M. A. Niessen, U. R. Tjaden, J. van der Greef, E. Litborn, U. Lindberg, J. Roeraade and F. Hillenkamp, Rapid Commun. Mass Spectrom., 1994, 8, 581–584 CrossRef CAS.
- M. Sun, S. S. Bithi and S. A. Vanapalli, Lab Chip, 2011, 11, 3949–3952 RSC.
- G. Petit-Pierre, A. Bertsch and P. Renaud, Lab Chip, 2016, 16, 917–924 RSC.
- T. Ngernsutivorakul, D. J. Steyer, A. C. Valenta and R. T. Kennedy, Anal. Chem., 2018, 90, 10943–10950 CrossRef CAS PubMed.
- G. Aubry and H. Lu, Lab Chip, 2017, 17, 4303–4311 RSC.
- A. Alizadeh, C. A. Nieto de Castro and W. A. Wakeham, Int. J. Thermophys., 1980, 1, 243–284 CrossRef CAS.
- S. K. Küster, S. R. Fagerer, P. E. Verboket, K. Eyer, K. Jefimovs, R. Zenobi and P. S. Dittrich, Anal. Chem., 2013, 85, 1285–1289 CrossRef.
- S. E. Bell, I. Park, S. S. Rubakhin, R. Bashir, Y. Vlasov and J. V. Sweedler, ACS Meas. Sci. Au, 2021, 1, 147–156 CrossRef CAS PubMed.
- P. Önnerfjord, J. Nilsson, L. Wallman, T. Laurell and G. Marko-Varga, Anal. Chem., 1998, 70, 4755–4760 CrossRef PubMed.
- Y. Liu, S.-Y. Jung and C. P. Collier, Anal. Chem., 2009, 81, 4922–4928 CrossRef CAS PubMed.
- J. H. Xu, S. W. Li, J. Tan, Y. J. Wang and G. S. Luo, AIChE J., 2006, 52, 3005–3010 CrossRef CAS.
- N. R. Beer, B. J. Hindson, E. K. Wheeler, S. B. Hall, K. A. Rose, I. M. Kennedy and B. W. Colston, Anal. Chem., 2007, 79, 8471–8475 CrossRef CAS PubMed.
- Y. Zhang, S. Kim, W. Shi, Y. Zhao, I. Park, C. Brenden, H. Iyer, P. Jha, R. Bashir, J. V. Sweedler and Y. Vlasov, Lab Chip, 2022, 22, 40–46 RSC.
- V. Romanov, S. N. Davidoff, A. R. Miles, D. W. Grainger, B. K. Gale and B. D. Brooks, Analyst, 2014, 139, 1303–1326 RSC.
- O. Wilhelm, L. Mädler and S. E. Pratsinis, J. Aerosol Sci., 2003, 34, 815–836 CrossRef CAS.
- A. C. Da Silva, J. Wang and I. R. Minev, Nat. Commun., 2022, 13, 1353 CrossRef CAS PubMed.
- A. H. Kunding, L. L. Busk, H. Webb, H. W. Klafki, M. Otto, J. P. Kutter and M. Dufva, Lab Chip, 2018, 18, 2797–2805 RSC.
- J. B. Fenn, M. Mann, C. K. Meng, S. F. Wong and C. M. Whitehouse, Mass Spectrom. Rev., 1990, 9, 37–70 CrossRef CAS.
- J. He, X. Zhao, J. Chang and D. Li, Small, 2017, 13, 1702626 CrossRef.
- A. Jaworek and A. Krupa, J. Aerosol Sci., 1999, 30, 873–893 CrossRef CAS.
- A. Schmidt, M. Karas and T. Dülcks, J. Am. Soc. Mass Spectrom., 2003, 14, 492–500 CrossRef CAS PubMed.
- Y. Zhang, K. Li, Y. Zhao, W. Shi, H. Iyer, S. Kim, C. Brenden, J. V. Sweedler and Y. Vlasov, Anal. Chem., 2022, 22, 40–46 Search PubMed.
- M. De Menech, P. Garstecki, F. Jousse and H. A. Stone, J. Fluid Mech., 2008, 595, 141–161 CrossRef.
- A. Gupta and R. Kumar, Microfluid. Nanofluid., 2010, 8, 799–812 CrossRef.
- R. Juraschek and F. W. Röllgen, Int. J. Mass Spectrom., 1998, 177, 1–15 CrossRef CAS.
- G. F. Scheele and B. J. Meister, AIChE J., 1968, 14, 9–15 CrossRef CAS.
- T. Takamatsu, Y. Hashimoto, M. Yamaguchi and T. Katayama, J. Chem. Eng. Jpn., 1981, 14, 178–182 CrossRef CAS.
- Q. Wang, Z. Wang, Y. Jiang and S. Yang, Experimental and Computational Multiphase Flow, 2021, 3, 38–46 CrossRef.
- A. J. Hijano, I. G. Loscertales, S. E. Ibáñez and F. J. Higuera, Phys. Rev. E: Stat., Nonlinear, Soft Matter Phys., 2015, 91, 013011 CrossRef CAS.
- T. Takamatsu, Y. Hashimoto, M. Yamaguchi and T. Katayama, J. Chem. Eng. Jpn., 1981, 14, 178–182 CrossRef CAS.
- S. Gabriel, R. W. Lau and C. Gabriel, Phys. Med. Biol., 1996, 41, 2251–2269 CrossRef CAS PubMed.
- R. B. McCleskey, J. Chem. Eng. Data, 2011, 56, 317–327 CrossRef CAS.
- Z. Wang, S. Yang, Y. Zhang and B. Li, Int. J. Multiphase Flow, 2021, 143, 103775 CrossRef CAS.
- T. Ngernsutivorakul, D. J. Steyer, A. C. Valenta and R. T. Kennedy, Anal. Chem., 2018, 90, 10943–10950 CrossRef CAS PubMed.
Footnote |
| † WS and SB contributed equally to this paper. |
| This journal is © The Royal Society of Chemistry 2023 |

