
 Open Access Article
 This Open Access Article is licensed under a
 Creative Commons Attribution 3.0 Unported Licence
In situ spatiotemporal characterization and analysis of chemical reactions using an ATR-integrated microfluidic reactor†
K.
Srivastava‡
 a,
N. D.
Boyle‡
b,
G. T.
Flaman
b,
B.
Ramaswami
b,
A.
van den Berg
a,
W.
van der Stam
c,
I. J.
Burgess
*b and
M.
Odijk
*a
a,
N. D.
Boyle‡
b,
G. T.
Flaman
b,
B.
Ramaswami
b,
A.
van den Berg
a,
W.
van der Stam
c,
I. J.
Burgess
*b and
M.
Odijk
*a
aBIOS Lab on Chip Group, Mesa+ Institute of Nanotechnology and Max Planck Institute of Complex Fluid Dynamics, University of Twente, The Netherlands. E-mail: m.odijk@utwente.nl
bBurgess Research Group, Department of Chemistry, University of Saskatchewan Canada, Canada. E-mail: ian.burgess@usask.ca
cInorganic Chemistry and Catalysis, Utrecht University, The Netherlands
First published on 11th October 2023
Abstract
Determining kinetic reaction parameters with great detail has been of utmost importance in the field of chemical reaction engineering. However, commonly used experimental and computational methods however are unable to provide sufficiently resolved spatiotemporal information that can aid in the process of understanding these chemical reactions. With our work, we demonstrate the use of a custom designed single-bounce ATR-integrated microfluidic reactor to obtain spatiotemporal resolution for in situ monitoring of chemical reactions. Having a single-bounce ATR accessory allows us to individually address different sensing areas, thereby providing the ability to obtain spatially and temporally resolved information. To further enhance the spatial resolution, we utilize the benefits of synchrotron IR radiation with the smallest beam spot-size ∼150 μm. An on-flow modular microreactor additionally allows us to monitor the chemical reaction in situ, where the temporal characterization can be controlled with the operational flowrate. With a unique combination of experimental measurements and numerical simulations, we characterize and analyse a model SN2 reaction. For a chemical reaction between benzyl bromide (BB) and sodium azide (SA) to produce benzyl azide (BA), we successfully show the capability of our device to determine the diffusion coefficients of BB and SA as 0.367 ± 0.115 10−9 m2 s−1 and 1.17 ± 0.723 10−9 m2 s−1, respectively. Finally, with the above characteristics of our device, we also calculate a reaction rate of k = 0.0005 (m3s−1mol−1) for the given chemical reaction.
1 Introduction
The combination of microfluidics with spectroscopy and other detection tools opens avenues to perform in situ characterization of chemical reactions.1 This offers the opportunity to obtain a real-time analysis of reactive fluid media. Microfluidics exhibits advantages such as enhanced mass and heat transfer, reduced reagent consumption and advanced fluid control,2,3 while the incorporation of spectroscopy tools allows researchers to efficiently analyse chemical reactions.4,5 In recent years, in situ monitoring of chemical reactions has seen significant advances in obtaining information regarding kinetic rate orders, rate constants and reaction mechanisms.6 To obtain the most meaningful spectra for a reaction within microfluidic devices, high spatial resolution is needed to distinguish concentration and composition changes along the channel length. Spectroscopic techniques such as Raman, FTIR (Fourier Transform Infra-Red), and synchrotron sourced X-ray spectroscopy possess sufficient spatial resolution to do so and additionally do not require laborious labelling to analyse the kinetics of a chemical reaction.1,7–10 To detect molecular changes, Raman or FTIR are the spectroscopies of choice as they provide detailed chemical information about the structure of the molecules which fluorescence and other labelling techniques do not.11,12 Raman is a well-known technique for spatially resolving chemical reactions in a microenvironment for kinetic studies, however it often suffers from poor sensitivity and long acquisition times. Raman's complimentary spectroscopic technique, FTIR on the other hand, has been quite successful in measuring on-flow chemical reactions, especially in attenuated total reflection (ATR) mode.1,13In ATR-FTIR, an evanescent electric field is created at the primary reflection surface, which decays exponentially with distance from the sensing interface making it surface sensitive and far less susceptible to problematic effects caused by highly absorbing solvents. Integrating microfluidic platforms on internal reflection elements (IREs) provides an attractive technique for in situ chemical reaction monitoring capabilities.14–19
Lozeman et al.14 and Hassler et al.15 provided examples of the in situ monitoring capability of microreactors with integrated ATR-FTIR functionality. In these approaches, a multi-bounce ATR was used to improve the signal strength. However, by using a multibounce ATR technique, the systems lacked temporal characterization as most of the information obtained was averaged over the entire sensor area. Similar drawbacks can also be observed for the work of Haas et al.16 where a multi-bounce diamond ATR was used to sample saliva glucose. Obtaining information regarding reaction kinetics, rate constants and overall progression of the chemical reaction with great detail, requires the higher spatial resolution offered by single bounce ATR.
However, there has been very limited use of a single-bounce ATR IREs for monitoring chemical kinetics. Sommer et al.17 reported using a single-bounce ATR crystal to study solutes in aqueous solutions but the absence of a continuous-flow microfluidic geometry hampered the application of in situ reaction monitoring. The same conclusion can also be drawn from the work of Marcott et al.18 where ATR-IR was used to investigate different blends of polyesters.
In this work, we combine the functionalities of a microfluidic reactor with a single-bounce micromachined IRE and the high-brilliance of synchrotron sourced IR to obtain spatially and temporally resolved chemical information.19 Here, the use of a synchrotron IR radiation with a variable aperture allows for beam diameters as small as 50 μm to be focused on individually addressable sensing areas thereby increasing the spatial resolution of the device. Adding to this, the microreactor is designed such that collection of chemical information can be done along the two in-plane axes of the device, thereby allowing us to monitor the chemical reaction as time progresses. With this, we show a unique method to spatiotemporally characterize a chemical reaction by determining reactant diffusion coefficients and the reaction rate constant. We obtain these reaction parameters, by fitting the numerically simulated results to the experimentally measured data.
2 Materials and methods
2.1 Microreactor design
The custom designed ATR-integrated microfluidic reactor used in this work consists of a two layer system. The top layer made in glass houses the microfluidic channels where the chemical reaction occurs. ATR-IR sensing is achieved from a custom-designed micromachined Si IRE which forms the bottom layer of the microreactor. Fig. 1a and b show a 2D top view of the microfluidic channel layer and the Si IRE layer respectively.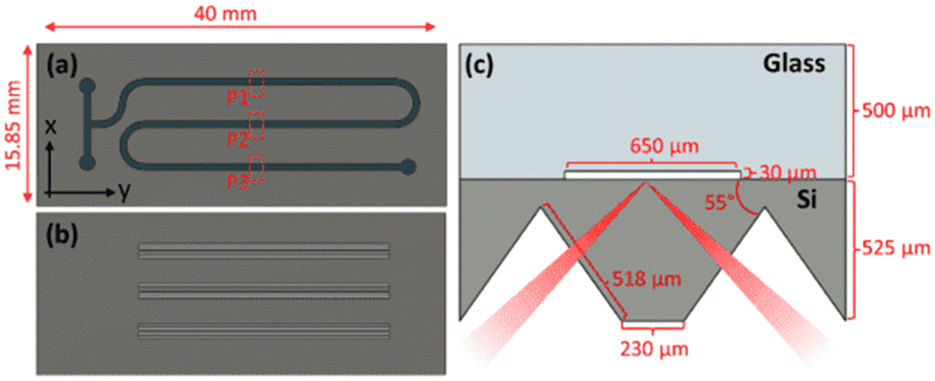 | ||
| Fig. 1 Schematic of microreactor employed in this work a) top view of microreactor displaying reaction channels and cross-section measurement positions 1, 2 and 3 denoted by P1, P2 and P3. b) Bottom view of microreactor displaying three 55° etched facets. c) Cross-section of the device channel. Ignoring Si refraction, the incident and reflected IR beam is shown. The sample medium (within the channel) is probed in the attenuated total reflection sampling mode via the evanescent wave. | ||
2.2 Device fabrication
The fabrication of the complete device was carried out at the Nanolab, Mesa+ Institute of Nanotechnology, University of Twente. The two layers of the microreactor device are fabricated separately initially and subsequently bonded together and diced to form six chips from one wafer stack. Fig. 2a and b show the processing steps used for the fabrication of the microreactor.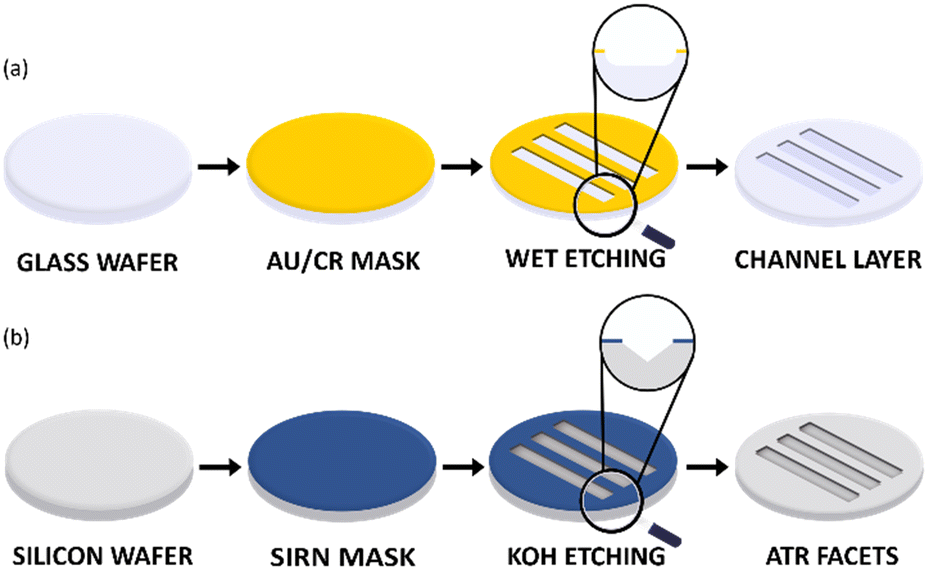 | ||
| Fig. 2 Schematic representation of the fabrication process flow for (a) microfluidic channel layer in glass and (b) IREs for ATR-IR sensing in silicon. | ||
For the fabrication of the microfluidic channel layer, a gold/chromium (Au/Cr) mask was sputtered (TCOathy) on a clean glass borofloat wafer. The wafer was then primed with HMDS and coated with Olin Oir 907-17 photoresist. By employing a UV light source for exposure (EVG 6200), the channel layer pattern was transferred to the coated photoresist. The soft mask formed on the photoresist after development was then transferred to the Au/Cr layer by etching first the Au layer and then the Cr layer. The hard mask formed was resistant to HF wet-etching. The microfluidic channels were therefore only etched in the unprotected areas of the Au/Cr mask as shown in the wet etching step in Fig. 2a. For a 25% HF solution, an etching time of 30 min resulted in a microfluidic channel with a height (h) of 30 μm. Due to the isotropic nature of wet-etching, a 30 μm under-etch on either side of the channel was expected. However, as the channel width (w) is 650 μm such that the w ≫ h, the additional under-etch had negligible impact on the functionality of the device. Finally, the Au/Cr mask was dissolved in Au and Cr etchant respectively. The wafer was subjected to a RCA-2 cleaning procedure to remove metallic and ionic impurities. Finally, to connect the channel layer with an external microfluidic set up (syringes, pumps, etc.), the inlets and outlets were fabricated with powder blasting.
For the fabrication of the silicon IREs, a silicon-rich nitride (SiRN) hard mask was used. To form the hard mask, SiRN was deposited on a Si wafer using low-pressure chemical vapor deposition. Similar to the microfluidic channel layer, photolithography was used to transfer the soft mask pattern to the SiRN layer. Reactive ion etching of SiRN (Adixen DE) with CHF3 and O2 gases was then performed to form the hard mask. Next, to form the IRE facets, the SiRN patterned wafer was subjected to KOH wet-etching at 75 °C. The anisotropic nature of etching results in the fabrication of ‘V’ grooves which were etched at an angle of 54.7° as shown under the KOH etching step in Fig. 2b. The wafers were etched for approximately 7 hours with an etch rate of 1 μm min−1 for the Si 〈100〉 plane, resulting in a groove depth of 423 μm. Finally, the SiRN mask was removed by etching in 50% HF and the wafer was cleaned with a RCA-2 cleaning procedure.
Once the microfluidic channel and the IRE layers were fabricated, the wafers were aligned (EVG 6200), clamped together and then anodically bonded (EVG 510). In Fig. 1c, the side view of a IRE/Channel interface can be seen. The microreactor was designed in such a way that the Si IRE ran underneath the channel layer in perfect synchronization to yield the best possible spatial temporal resolution characteristics. A detailed fabrication process flow for the microreactor can be found in the ESI† section S1. The fabrication process flow was adapted from our previous work.20
2.3 SN2 chemical reaction
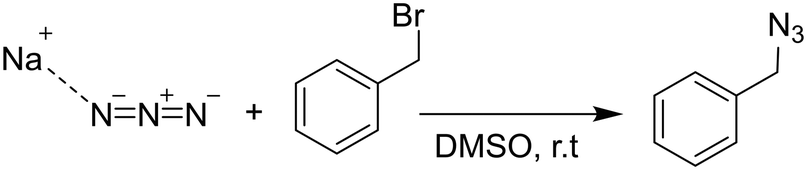
In a proof of principle demonstration, the second order nucleophilic substitution (SN2) reaction of benzyl bromide (BB) and azide (SA) to form benzyl azide (BA) was studied. Benzyl bromide (98%) and sodium azide (>99.5%) were purchased from Sigma-Aldrich. The reactants are readily dissolved in DMSO (Sigma Aldrich, 99.5%), although the sodium azide exists in an equilibrium between an ion pair and freely dissociated ions.21 The chemical reaction is shown below.2.4 Synchrotron measurements and ATR-IR data collection
All microreactor measurements were performed at the horizontal ATR end station19 of the mid-IR beamline facility at the Canadian Light Source (CLS). Using an angle of incidence (AOI) of 35°, synchrotron radiation was focused at the IRE/channel interface with the beam path orthogonal to the groove direction. An off-axis parabolic (OAP) mirror was used to focus a 150 μm beam spot onto the sample and the reflected light was collected with a second OPA mirror which directed the light towards the detector. The sampling stage's ability to translate in both the x-axis and the y-axis allowed access to different positions on the device.Teflon tubing (1/16 inch ID), flangeless ferrules and O-rings connect the fluid inlets of the microreactor holder to the reagent containing syringes (1 mL Gastight Hamilton syringe). Syringe pumps (New Era Pump Systems, Inc.) were used to introduce the fluidic system to the microreactor at a set volume flowrate of 2 μL min−1 and left to stabilize for 15–20 min prior to beginning measurements. The channel environment was monitored by collecting a channel cross-section perpendicular to the direction of flow. Beginning at the channel boundary, a spectrum spatially averaged over the 150 μm spot size area was collected every 50 μm across the channel width at three regions of interest as shown in Fig. 1a. Absorbance spectra were calculated using eqn (1):
 | (1) |
Spectrometer settings of 512 co-added interferograms, 8 cm−1 resolution, and 40 MHz scanning velocity, were used to collect measurements of the SN2 reaction. The reactants, 0.5 M SA in DMSO and 0.5 M BB in DMSO, were introduced at inlets 1 and 2 respectively, to co-flow in the channel at a combined flowrate of 2 μL min−1. After absorbance spectra were calculated, characteristic bands for each reactant and the product were integrated and converted to concentrations on the basis of calibration measurements (see ESI† section S2).
2.5 Diffusion coefficient determination
The diffusion coefficients of BB and SA were determined by co-flowing parallel streams of pure solvent (DMSO) and 0.5 M solutions of either BB or SA. Spatially resolved ATR-FTIR cross-sectional spectra were collected at the points of interest shown in Fig. 1a using the same data collection procedure detailed above. Integration of characteristic bands at 1230 cm−1 (BB) and 2000 cm−1 (SA) allowed the generation of experimental concentration profiles shown in Fig. S3.†2.6 COMSOL simulations
To simulate the mass-transport and chemical reaction in the custom designed microreactor, numerical simulations were performed on COMSOL Multiphysics 6.0. For this, a combination of creeping flow, transport of diluted species and chemical reaction engineering modules were used.The creeping flow study based on Navier–Stokes equation was used to set the microfluidic parameters. As we operate in the microfluidic regime with low Reynolds number (Re ≪ 1), the inertial Stokes term was neglected. In this domain, the fluid properties and the inlet and outlet of the model were defined. Since the width of the microfluidic channel (650 μm) is much bigger than its height (30 μm), we use a shallow channel approximation, effectively reducing this model to a 2D simulation. Mass transport from top to bottom of the channel occurs within ∼2–3 seconds as seen from eqn (2), effectively homogenizing any significant concentration differences along the z-axis quickly, compared to the time-scales of mass transport along the length or width of the channel.22–24 In the equation below, t is time, h is the height of the channel and D is the diffusion coefficient of the species.
| t = h2/2D | (2) |
To accurately simulate the chemical reaction and extract information regarding the reaction kinetics, diffusion profiles and rate constant, the model was modified to yield minimally errored simulation results while simultaneously also reducing the computing time. The successful results obtained from the COMSOL simulations were a result of the subsequent mentioned techniques.
First, to simplify the geometry of the microreactor, a space transformation was applied. Fig. 3 shows a schematic representation of the microfluidic channel layer that was modelled in COMSOL consisting of two regions: a) anisotropic regions shown in dark grey and b) isotropic regions shown in light grey. The space transformation essentially means that the residence time of flow and molecules remains equal in the compressed space (along y-axis) when compared to the real channel size in the transverse direction (x-axis). Using a compression factor of 40, the channel geometry was designed in such a way that an anisotropic region of 600 μm length served as a channel length of 24![[thin space (1/6-em)]](https://www.rsc.org/images/entities/char_2009.gif) 000 μm. This means that each anisotropic unit in the y-axis represented 40 units of 1 unit cell in the isotropic domain. The fluid and diffusion properties of the simulated species were adjusted accordingly in the anisotropic sections. This resulted in reduction in the degrees of freedom used by the model, thereby reducing the computational time.
000 μm. This means that each anisotropic unit in the y-axis represented 40 units of 1 unit cell in the isotropic domain. The fluid and diffusion properties of the simulated species were adjusted accordingly in the anisotropic sections. This resulted in reduction in the degrees of freedom used by the model, thereby reducing the computational time.
 | ||
| Fig. 3 Schematic representation of the COMSOL model where modified settings were applied in the transport of diluted species model due to a space transformation. Here, the channel geometry consists of two regions; (1) isotropic regions where the diffusion coefficient, Dxx = Dyy and velocity field, vy = vy,creeping flow and (2) anisotropic regions where diffusion coefficient, Dyy = Dxx/40 and velocity field, vy = vy,creeping flow/40. Bridging between curved isotropic and straight anisotropic channels are ‘spacer’ regions to avoid fringing effects. | ||
Additionally, in order to simulate the chemical reaction seen in Scheme 1, three inlets were defined in the COMSOL geometry. The zoomed inset in Fig. 3 shows the three inlets used in the simulations. While inlet 1 and 2 are set for the two reactants, BB and SA respectively, a third inlet with a 5 μm zone is added to avoid computational problems. As very little amount of product, BA, would have formed at the channel entrance, an infinitely fine mesh would have been needed to resolve the steep gradient formed at the BB/SA interface. By adding inlet 3, set for BA, a gentler gradient is forced at the start which can be resolved using reduced computational memory and time. A combination of a fine mesh with an exponential growth rate parameter aids in the process of computing the mesh and avoiding errored results. The need for this can also be observed from the simulation image shown in Fig. S5.† The zoomed insets show the use of this fine mesh to capture not only the steep gradient at the inlets but also the subtle changes in flow profile at sharp turns in the geometry.
 | ||
| Scheme 1 Formation of BA from SA and BB at room temperature, in DMSO. | ||
Lastly, a spacer region was added between the anisotropic regions and the isotropic curved channel regions as shown in Fig. 3. It was observed that convection had a small, but noticeable contribution to the mass transport in the x-direction due to the presence of the 180° turns in the channel geometry. As the inner bends have a reduced channel length as compared to the outer bends, the hydraulic resistance experienced by the inner bends is much smaller. This leads to a higher velocity observed for the inner bend as evidenced from Fig. S5(b).† Transitioning from an anisotropic region to a curved isotropic region can therefore lead to the fringing effects, for example skewing of the concentration profile, which can result in misleading results. The addition of a suitable sized spacer region helped in avoiding these errors. In this work, the combination of the space transformation, 2D channel approximation, addition of a third inlet to avoid steep concentration gradients and the usage of spacer transitional regions resulted in the smooth operation of the COMSOL model both in terms of memory and computational time.
3 Results and discussion
The main body of the results and discussion is separated into three sections. First, the design parameters for the microreactor and synchrotron imaging configuration, keeping in mind the intended application, are discussed. Next, the results obtained from the diffusion experiments using the fabricated microreactor are analysed. Using COMSOL simulations, a diffusion coefficient is fit for each reactant. Finally, the experimental results from the SN2 chemical reaction monitoring are discussed and the COMSOL simulations are used to determine a rate constant by fitting the simulation data to the experimental results.3.1 Microfluidic chip design
In order to spatially monitor the chemical reaction and obtain time-resolved information using ATR-FTIR, a bespoke, monolithic IRE was designed with three, micromachined grooves that can be individually addressed using focused IR sourced from a sufficiently brilliant source such as a synchrotron. The SEM image of the IRE is shown in Fig. 4b. A single bounce system offers the advantage of individually addressing spatially confined locations at the channel/IRE interface.17 This showcases the capability of our device to resolve two-dimensional information as each measurement datapoint can be successfully translated into a x- and y-coordinate. By combining this functionality with a high brilliance synchrotron IR source,25 sufficiently small beam diameters can be used to characterize spatial information of a chemical reaction in the direction perpendicular to flow (x-direction). Additionally, displacing the IR beam along the direction of flow (y-axis) allows one to obtain temporally resolved information due to the progression of the chemical reaction along the microreactor. When operated under steady-state flow conditions, each geometric location corresponds to a specific time coordinate of the chemical reaction.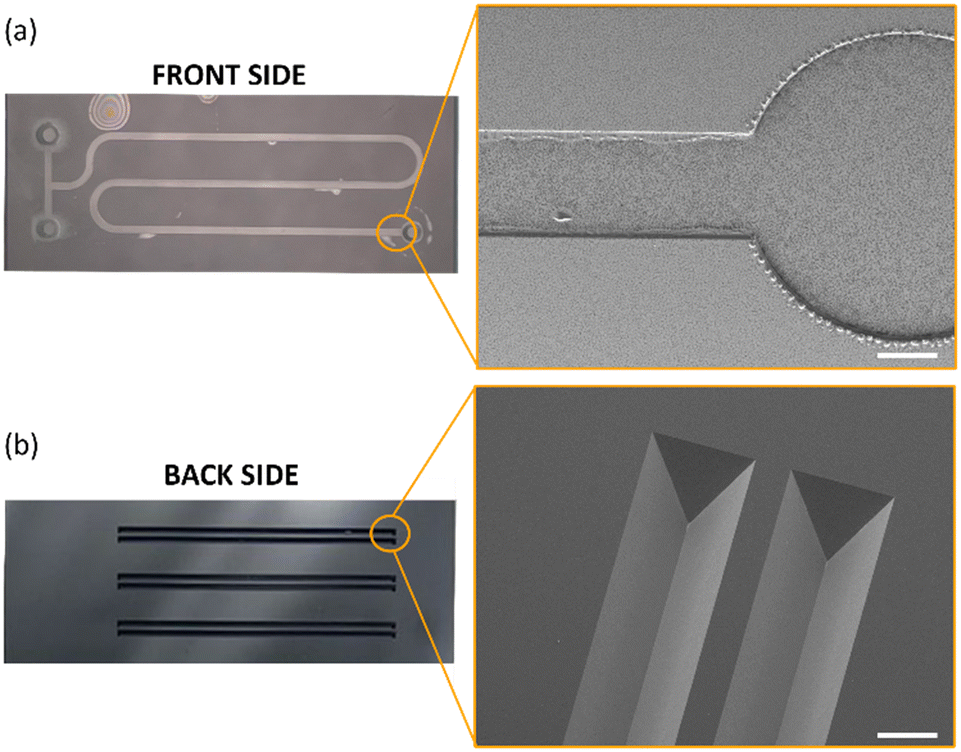 | ||
| Fig. 4 (a) Microfluidic channel layer of the device with a zoomed inset containing the SEM image of the inlet/outlet (b) ATR-IRE layer of the device with a zoomed inset of the SEM image of the IREs. Scale bar is 300 μm. | ||
The microfluidic channel layer must therefore be designed and constructed with excellent spatial registry between the IRE and the glass microfluidic device. The SEM image of a part of the channel layer can be found in Fig. 4a. The meandering shape of the channel layer was chosen to ensure a maximum residence time of the chemical reaction on a 4.0 cm × 1.585 cm chip. Certain design elements such as the channel width and height were selected based on the suitability of the application. A 650 μm channel width ensured that sufficient datapoints along the perpendicular direction of flow (x-direction) could be scanned to obtain chemical information. Additionally, the height of the channel was selected to be 30 μm for three reasons. First, the channel layer design with the given dimensions resulted in operational conditions for the microreactor compatible with microfluidic equipment available. Secondly, as the probing depth of the evanescent wave generated at the channel/IRE interface is only a few micrometers,26 having a substantially high channel did not result in the procurement of any additional information. Lastly, having a w ≫ h resulted in a fully developed flow at the channel/IRE interface.27
In this work, 11 spatially resolved points in cross-section to the microfluidic channel were used to map the spectral signatures of the reaction on flow. Having a small beam spot size is equivalent to obtaining the best spatial resolution possible. However, this greatly depends on the signal to noise ratio (SNR) in the IR spectra. The maximum spatial resolution is defined by the Airy principle and the diffraction limit of light used.28 For mid-IR wavelengths imaged on a silicon device with a refractive index of 3.4, a theoretical resolution of 1–5 μm should be achievable. However, this is often limited by the optical configuration in use. In our set up, the light from the synchrotron is focused to a point and then passed through an aperture to obtain only the brightest and least nosiest part of the synchrotron beam. With a 1× magnification and an aperture size of 150 μm, the defined beam spot size used in this work is therefore 150 μm. A beam spot size of ∼70 μm has been used in previous work,19 however in this work, we decided to work with a beam spot size of ∼150 μm due to the low SNR for BB.
3.2 Determination of diffusion coefficients
The diffusion of a chemical species can be characterized by observing its transport in a solvent under steady-state flow conditions.29 A low Reynolds number (Re = 6.08 × 10⁻⁴ in this work) contributes to a poor mixing performance typically observed for many microfluidic reactors.30–34 However, in our case it ensures that a gradual diffusion of the species across the channel width can be easily observed and analysed by co-flowing the species dissolved in a solvent on one side and the pure solvent on the other. If no additional forces such as migration or electric field are applied, it can be assumed that the transport of the species is purely due to diffusive flux.27,29 By fitting a COMSOL model to the experimentally measured diffusion profiles, a diffusion coefficient can be estimated for the species of interest. Here, the method is applied to determine the diffusion coefficient of BB and SA. Fig. 5a depicts the concentration profile obtained for a molecule diffusing from left to right in the channel, with a diffusion coefficient of 0.44 × 10⁻⁹ m2 s−1. It is worth mentioning that in the simulations, the conditions are set to replicate the experimental diffusion experiments where for example BB (or SA) in DMSO is flowed from inlet 1 and pure DMSO from inlet 2.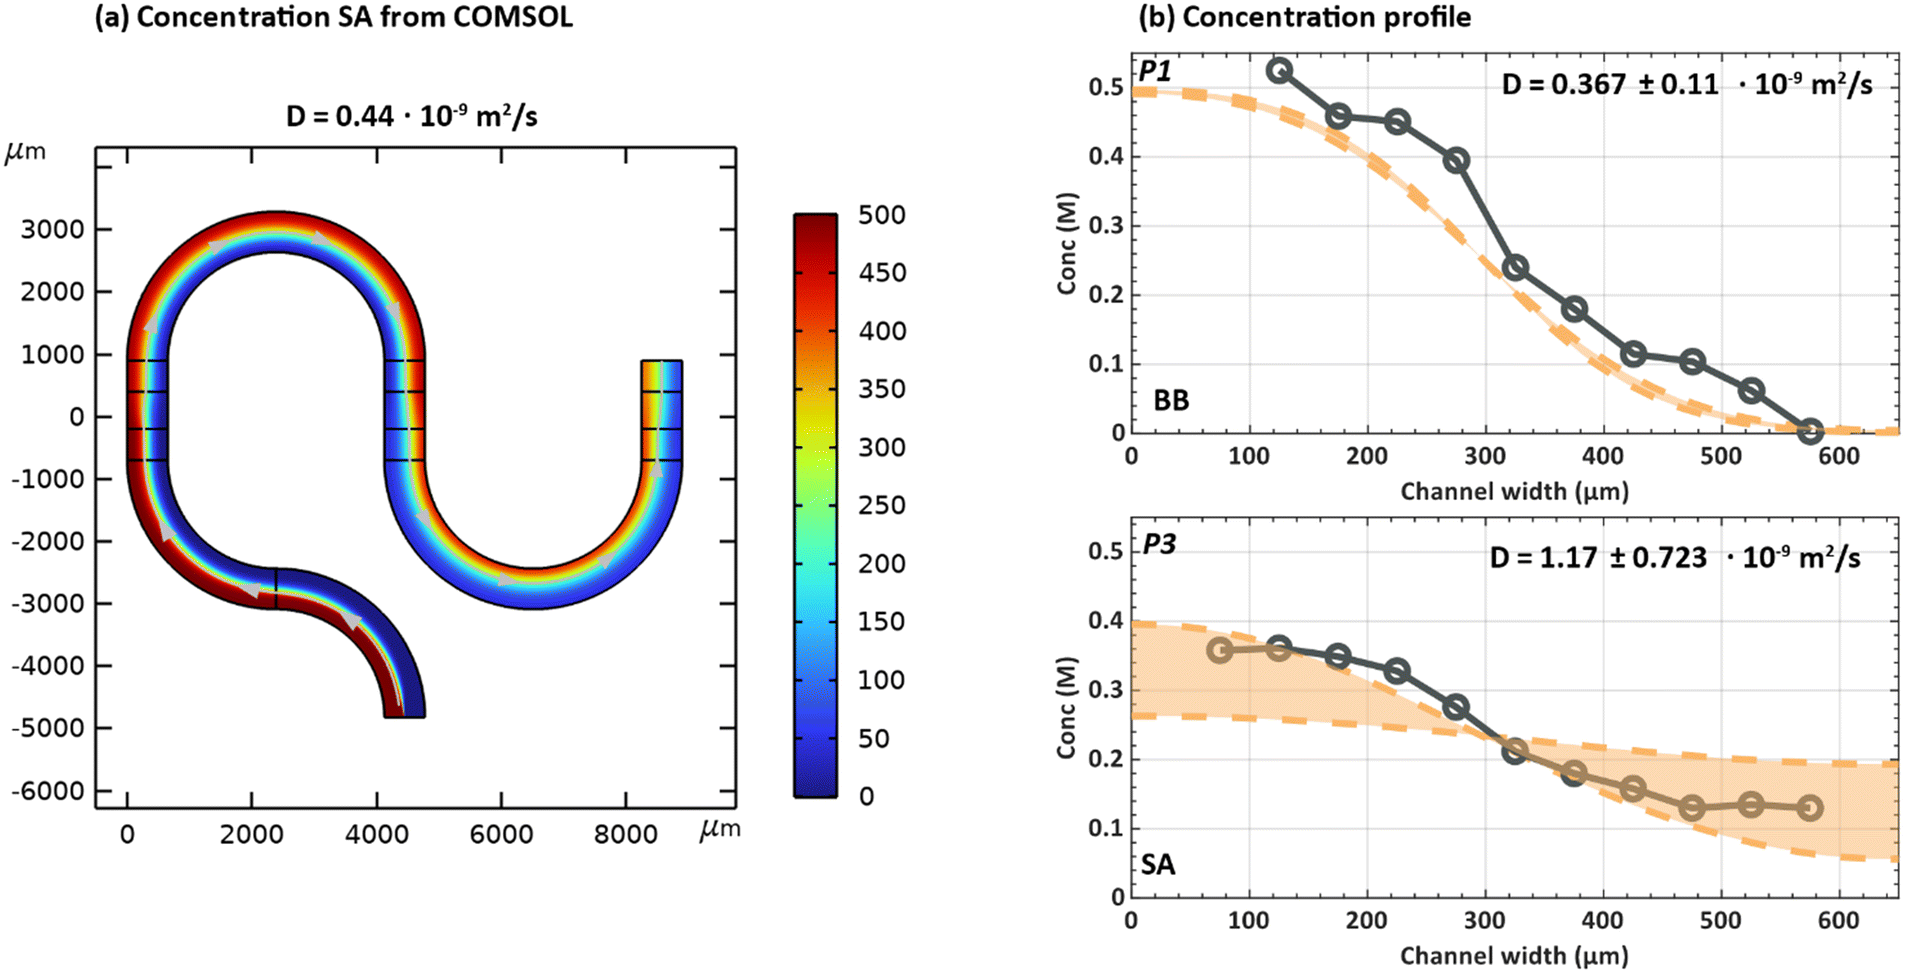 | ||
| Fig. 5 (a) 2D concentration flux (mol m−3) for SA modelled in COMSOL with diffusion coefficient, D = 0.44 × 10⁻⁹ m2 s−1. (b) Numerically simulated (dashed lines) diffusion coefficients for experimentally measured (circles) diffusion profiles of BB (top) and SA (bottom) with diffusion coefficients D = 0.367 ± 0.115 × 10⁻⁹ m2 s−1 and D = 1.17 ± 0.723 × 10⁻⁹ m2 s−1 for BB and SA, respectively. The shaded orange area indicates one standard deviation from the determined diffusion coefficients. | ||
The method of determining the diffusion coefficient is two-fold. First, various diffusion coefficients are simulated and their profiles are extracted from a converged simulation model. Next, an error analysis is performed where the data points for the simulated diffusion profile are compared to that of experimentally measured results. Based on the sum of square of residuals, the value resulting in the least error is chosen. The error analysis is performed using the following equation:
 | (3) |
To determine the diffusion coefficient of BB and SA, experimental data sets were collected at three positions (p1, p2 and p3 as shown in Fig. 1 on the chip). The same locations are then used to extract the simulated diffusion profiles from the COMSOL model. Using eqn (3), the diffusion coefficient with the best fit was determined for each position. The best-fit D values obtained at each of the three positions were then pooled and used to calculate an overall average diffusion coefficient and its standard deviation. This approach yields a diffusion coefficient of 0.367 ± 0.115 × 10⁻⁹ m2 s−1 and 1.17 ± 0.723 × 10⁻⁹ m2 s−1 for BB and SA respectively. Concentration profiles derived from the best fit diffusion coefficients with one standard deviation for BB and SA can be found in Fig. 5b for position 1 (BB) and position p3 (SA). Results for other positions can be found in Fig. S6.†
Zhou et al. reported a diffusion coefficient of 0.81 × 10⁻⁹ m2 s−1 for BB in DMF.35 It can be understood from the Stokes–Einstein relation as shown in eqn (4) that the diffusion coefficient of a solute of particle size, a, present in a liquid solvent is influenced by the dynamic viscosity (η) of the solvent and the temperature (T).29
| D = kBT/(6πaη) | (4) |
3.3 Determination of rate constant
The fundamental parameter that defines the kinetics of a chemical reaction is the rate constant and knowledge of this constant is a design parameter in process engineering. To determine the rate constant by data-fitting, the concentrations of the reactants, BB and SA, and the product, BA are experimentally determined from operando ATR-FTIR micro-spectroscopy measurements and then fitted to simulated concentration profiles. Fig. 6a shows a plot of the IR spectra recorded at three coordinates (x = 75 μm, x = 225 μm and x = 425 μm) for position p1. The peak at 1230 cm−1 arises from the C–CH2 stretching mode in C6H5CH2–Br,39 whereas the strong absorption feature at 2000 cm−1 is the N![[double bond, length as m-dash]](https://www.rsc.org/images/entities/char_e001.gif) NN asymmetric stretching mode of the azide reactant.40 We note that when DMSO is used as a solvent, the azide forms a rapidly exchanging equilibrium between the fully solvated anion and a solvated contact ion-pair.21 The asymmetric stretch of the free anion is centred at 2000 cm−1 whereas the same vibration for the contact ion pair is blue-shifted to 2024 cm−1. Formation of BA, benzyl azide, shifts the N3 asymmetric band frequency to 2100 cm−1. The small peaks that appear at 1920 and 1950 cm−1 likely arise from changes in the atmospheric concentration of water vapour. At the time of these measurements, the hATR end station at the CLS was not under a purged atmosphere and the bending mode of gas-phase water has extensive ro-vibrational structure that extends weakly into this spectral window. The 1230 cm−1 band is strongest at x = 75 μm, which is closest to the edge of the channel for inlet 1. As one moves towards x = 425 μm, the 1230 cm−1 peak intensity decreases. The opposite trend is observed for SA which is expected given that SA is introduced from inlet 2. Although the residence time is relatively short at position p1, Fig. 6a clearly shows the characteristic peak of benzyl azide41,42 at 2100 cm−1 and confirms that product formation has taken place.43 The BA peak is found to be the highest at x = 225 μm, i.e. near the centre of the channel (x = 325 μm) where maximum overlap of the concentration profiles of the two reactants occurs.
NN asymmetric stretching mode of the azide reactant.40 We note that when DMSO is used as a solvent, the azide forms a rapidly exchanging equilibrium between the fully solvated anion and a solvated contact ion-pair.21 The asymmetric stretch of the free anion is centred at 2000 cm−1 whereas the same vibration for the contact ion pair is blue-shifted to 2024 cm−1. Formation of BA, benzyl azide, shifts the N3 asymmetric band frequency to 2100 cm−1. The small peaks that appear at 1920 and 1950 cm−1 likely arise from changes in the atmospheric concentration of water vapour. At the time of these measurements, the hATR end station at the CLS was not under a purged atmosphere and the bending mode of gas-phase water has extensive ro-vibrational structure that extends weakly into this spectral window. The 1230 cm−1 band is strongest at x = 75 μm, which is closest to the edge of the channel for inlet 1. As one moves towards x = 425 μm, the 1230 cm−1 peak intensity decreases. The opposite trend is observed for SA which is expected given that SA is introduced from inlet 2. Although the residence time is relatively short at position p1, Fig. 6a clearly shows the characteristic peak of benzyl azide41,42 at 2100 cm−1 and confirms that product formation has taken place.43 The BA peak is found to be the highest at x = 225 μm, i.e. near the centre of the channel (x = 325 μm) where maximum overlap of the concentration profiles of the two reactants occurs.
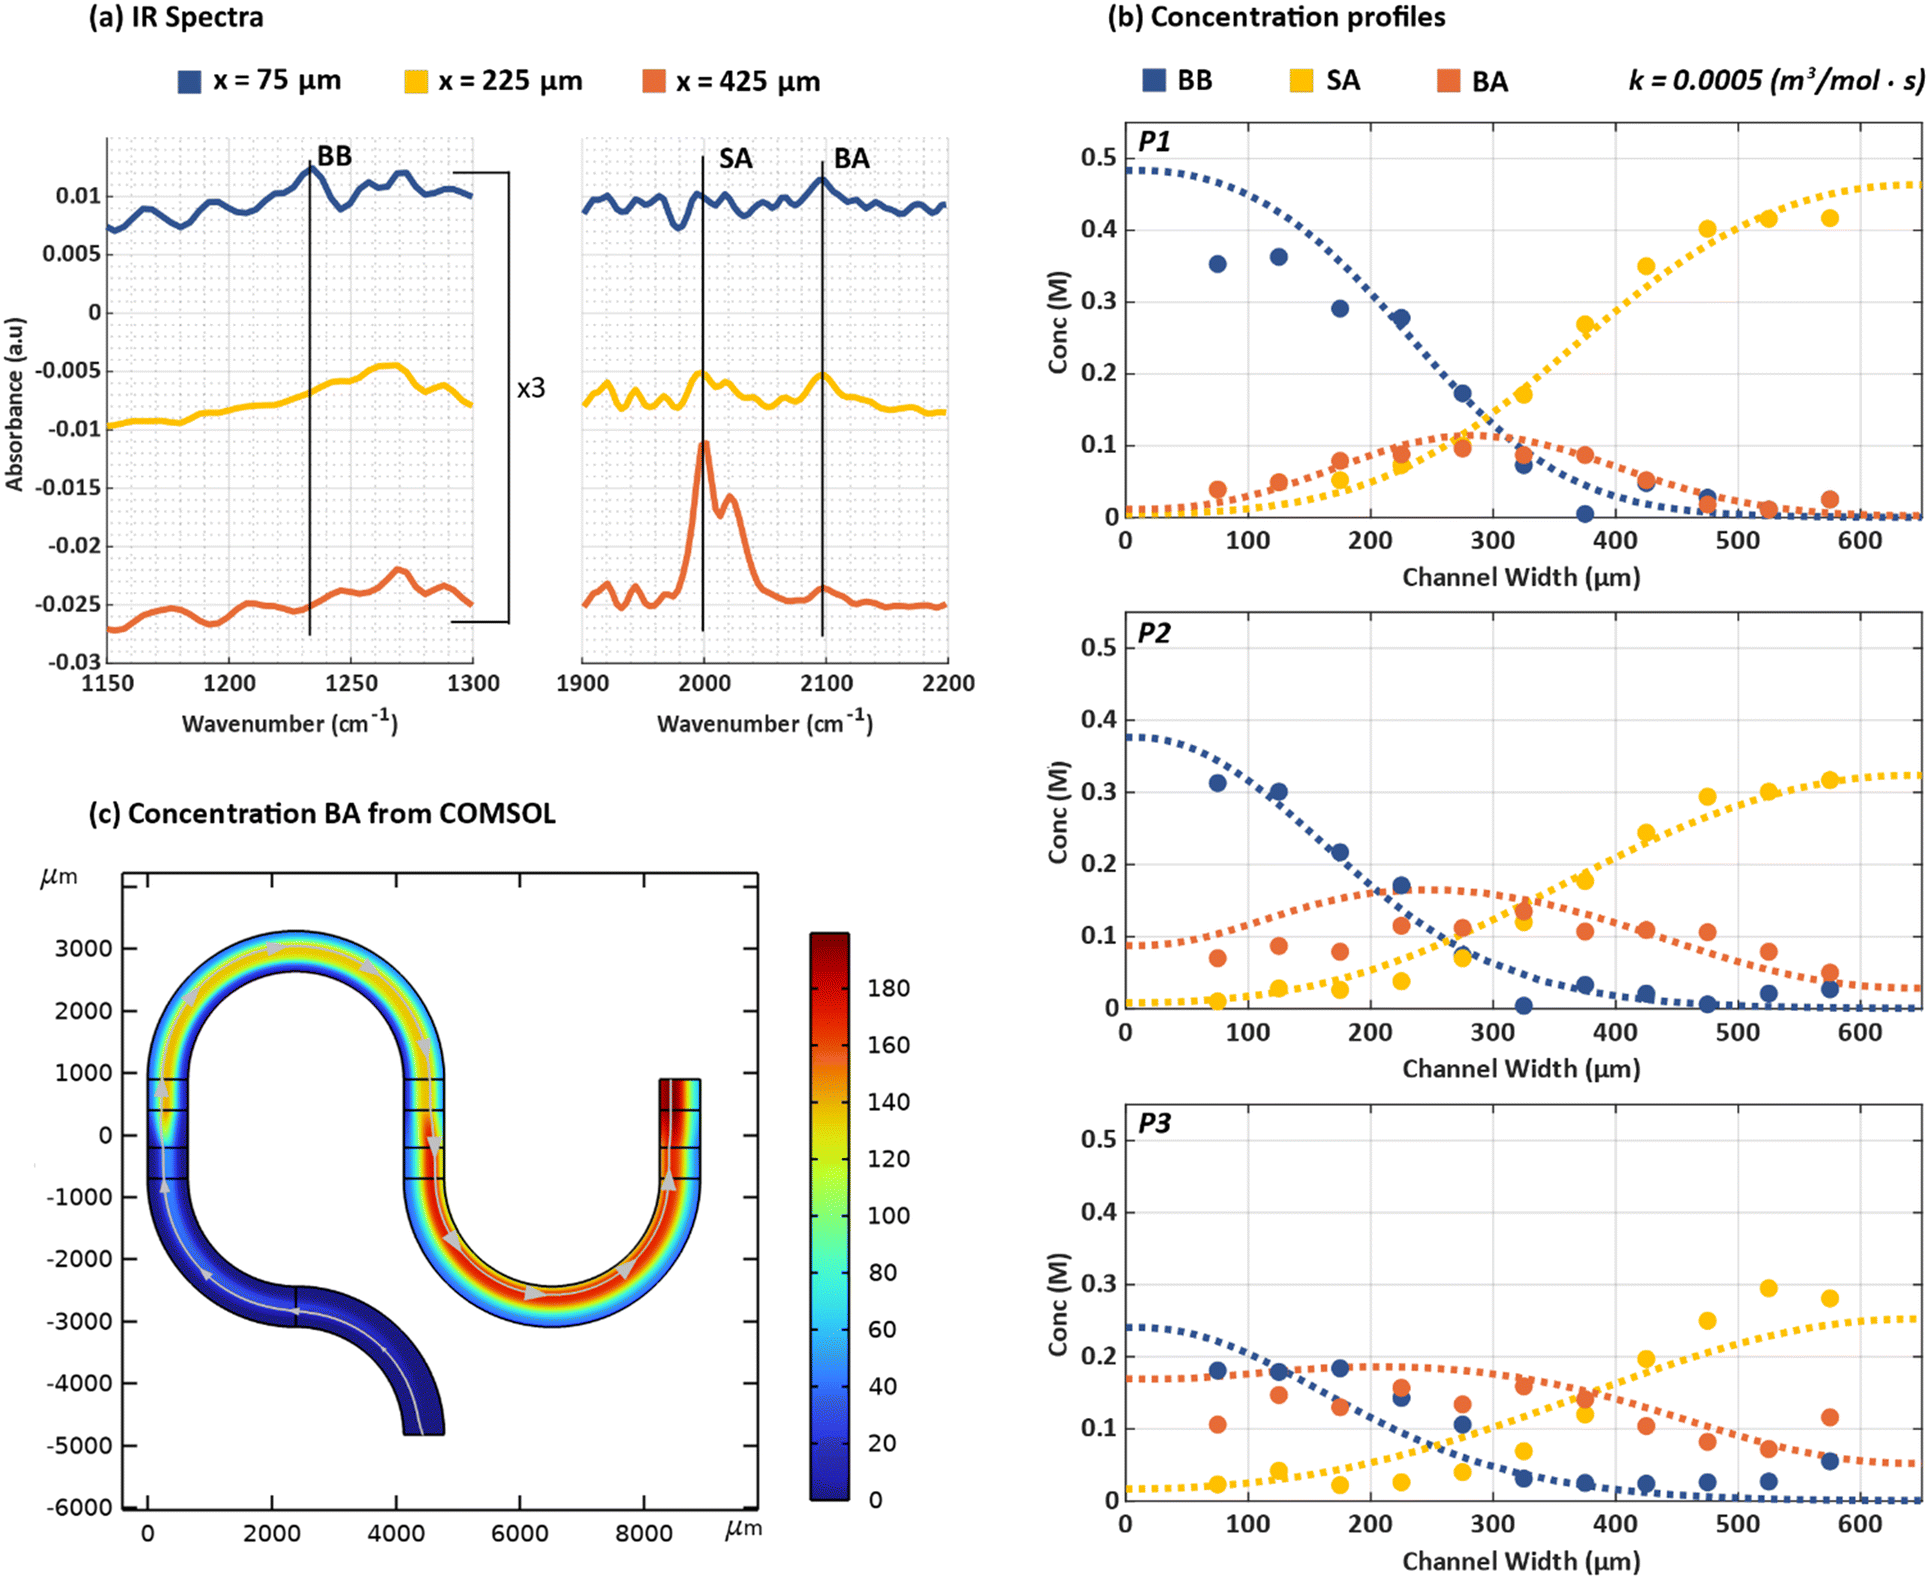 | ||
| Fig. 6 (a) IR spectra for the chemical reaction in Scheme 1 at position p1 at x = 75 μm (blue), 225 μm (yellow) and 425 μm (orange). Characteristic peaks for BB, SA and BA can be detected at 1230 cm−1, 2000 cm−1 and 2100 cm−1 respectively. (b) Experimentally measured (circles) and simulated (dashed lines) concentration profiles for BB (blue), SA (yellow) and BA (orange) for positions p1, p2 and p3 on the microreactor. Parameters used in simulations include: DBB = 0.367 ± 0.115 × 10− m2 s−1, DSA = 1.17 ± 0.723 × 10− m2 s−1DBA = 0.367 ± 0.115 × 10− m2 s−1 and k = 0.0005 (m3 mol−1 s−1). (c) 2D surface concentration flux (mol m−3) for BA simulated with the parameters used in (b). | ||
In order to simulate the concentration profiles, diffusion coefficients determined in the previous section were used along with an additional chemical reaction engineering module. Here, an irreversible chemical reaction C1 + C2 → C3, based on the mass actional law, was defined. Considering the irreversible reaction shown in Scheme 1, the reaction rate for this well-known bimolecular reaction is:
| r = k2[BB][SA] | (5) |
Fig. 6b reveals how the SN2 chemical reaction proceeds overtime by mapping the reaction at positions p1, p2 and p3 at a flowrate of 2 μL min−1. The dashed lines represent the simulated concentration profiles while the solid circles represent the experimentally measured concentrations. In the graphs, BB is shown in blue, SA in yellow and BA in orange. It has been highlighted before that laminar flow in a microfluidic regime results in a low mixing efficiency of the reactants.31 This is supported by the results shown for p1 where the BB and SA concentrations have only decreased slightly (∼0.4 M) and very minimal BA formation has taken place in the centre of the channel. The same reaction if observed in a benchtop experiment would proceed at an accelerated rate, making it difficult to experimentally measure the different reactants and products. In the microreactor, as the reaction progresses, at positions p2 and p3, a further reduction in the concentrations for BB and SA can be seen. The concentration of each reactant is influenced by its own diffusion coefficient and the overall rate of the reaction, the impact of which will be discussed later in detail. It is also interesting to see that the increase in the formation of BA seems to plateau as the reaction progresses. This can be evidenced from the change in the bell-curve concentration profile of BA at position p1 to a flatter concentration profile at position p3. As the rate of the bimolecular reaction is directly proportional to the product of the local concentrations of the two reactants, product formation is confined, at early time times, to the interface between the co-flowing streams. Increasing residence time leads to greater extent of the diffusional overlap, hence increased relative reactivity at distances offset from the channel. This, combined with the fact that BA generated at the centre of the channel initially diffuses toward the channel extremities, leads to an overall flattening of the BA concentration profile.
The rate constant, k (m3 s−1 mol−1), of a chemical reaction influences the concentration of the product formed in the microfluidic device which can be evidenced from the concentration profiles obtained by simulating mass transport using various rate constants. For example, for a rate constant of k = 0.001 (m3s−1mol−1), the simulations revealed a lower concentration of BA formed as compared to the experimentally measured BA concentration (Fig. S8†). This would mean that the chosen rate constant makes the reaction progress slower than it actually does. This can also be observed from the individual simulated concentration profiles of BB and SA as they deviate further away from the experimental datasets as the reaction proceeds with time. Given that the SN2 reaction follows a second order reaction rate, the concentration of the species scales inversely with the rate constant. Therefore, reducing the rate constant would result in better fitting results. Similar to the approach used to determine the diffusion coefficients, different values of the rate constant were simulated and the simulated concentration profiles are compared to the experimentally measured datasets. The simulated rate constants include k = −0.001, 0.0075, 0.0005 and 0.00025 (m3s−1mol−1). Based on the error analysis (see section 3.2), the rate constant resulting in the lowest error was k = −0.0005 (m3s−1mol−1) is finalized for the given chemical reaction. The results can be found in Fig. 6b. It is worth mentioning that the concentration profile of the product formed is also influenced by the individual diffusion coefficients of the reactants. In the SN2 chemical reaction used in this work, SA has a higher diffusion coefficient than BB which means that it diffuses faster across a channel when compared to BB. This would naturally result in the concentration profile of BA to have a left shift (towards channel edge of inlet 1) which can also be observed in the 2D top view of the simulated concentration profile in Fig. 6c. Specifically focusing on the “U” turn connecting channel 2 and 3, the higher concentration of BA recorded at the right side of the channel confirms this observation. With the given set of simulation and experimental data fitting, we show the applicability of our microreactor to determine the rate constant of the chosen SN2 chemical reaction.
Conclusions
In this work, we demonstrate the use of an ATR-integrated microreactor for the in situ spatiotemporal characterization of a chemical reaction. Our in-house custom designed and fabricated microreactor combines the functionality of microfluidics with a single-bounce IR sensing mechanism to obtain individually addressable spatially resolved coordinates for reaction monitoring. To showcase the usability of the device as a proof of concept, a SN2 chemical reaction is monitored on the microreactor. Experimentally measured IR spectra with a high brilliance synchrotron radiation source are collected at three different locations on the microreactor from which concentration profiles of both reactants and products are determined. Keeping in mind the two goals of this work, we first showcase the ability to characterize a chemical reaction spatially by obtaining concentration profiles of the reactants and products at various coordinates along the direction of flow in the microreactor. Second, we demonstrate a remarkable combination of numerical simulations and experimental measurements to temporally resolve the chemical reaction by determining diffusion coefficients and reaction rate constants. With the aid of COMSOL simulations, we assess the performance of the microreactor by matching the simulated and experimental results to obtain the best fitted parameters for the chemical reaction. We successfully show the impressive capabilities of the device to not only monitor the progress of a chemical reaction but also potentially be applied to many other chemical engineering applications. A few examples could include observing structural changes in reactants and products during a chemical reaction and monitoring the presence of intermediate products to confirm proposed reaction mechanisms. We note that the versatility of this first iteration of this approach was somewhat limited by the fact that absorbing gases, CO2 and H2O were not removed from the measurement environment in these studies. Without a stable atmosphere surrounding the microreactor, gas-phase water and CO2 bands give rise to spectral interference over a broad portion of the mid-IR spectral range. Additionally, the focus of the light is highest at the centre of the channel position and translation of the beam spot transverse to the channel's long axis degrades the spectral quality at the channel edges. We have already added a purge environment and are currently developing new chip capabilities that provide rapid mixing of the reactants, thus eliminating the need to measure at off-centred positions. These two accommodations are expected to greatly improve the S/N and will enhance the versatility of the approach.Author contributions
K. Srivastava: conceptualization, data curation, formal analysis, investigation, methodology, software, validation, visualization, project administration, writing – original draft, writing – review and editing. N. D. Boyle: conceptualization, data curation, formal analysis, investigation, methodology, software, validation, visualization, project administration, writing – original draft, writing – review and editing. G. T. Flaman: conceptualization, data curation, formal analysis, investigation, methodology, validation, visualization, project administration, writing – review and editing. B. Ramaswami: data curation, formal analysis, investigation, methodology, validation, visualization. A. van den Berg: resources, funding acquisition, validation, visualization, supervision, project administration. W. van der Stam: conceptualization, resources, validation, visualization, supervision, project administration, writing – review and editing. I. J. Burgess: conceptualization, funding acquisition, resources, validation, visualization, supervision, project administration, writing – review and editing. M. Odijk: conceptualization, resources, validation, visualization, supervision, project administration, writing – review and editing.Conflicts of interest
There are no conflicts to declare.Acknowledgements
K. S. and N. D. B would like to thank the Netherlands Center for Multiscale Catalytic Energy Conversion (MCEC) for funding this project (Grant No. 801359). This work was also funded by Discovery Grants from the Natural Science and Engineering Research Council (NSERC) of Canada. G. T. F. acknowledges a Fellowship from the NSERC CREATE to INSPIRE. N. D. B and G. T. F. acknowledge funding from the NSERC CGS-M program. Research described in this paper was performed at the Canadian Light Source (CLS). The CLS is supported by the Canada Foundation for Innovation, Natural Sciences and Engineering Research Council of Canada, the University of Saskatchewan, the Government of Saskatchewan, the Western Economic Diversification Canada, the National Research Council Canada, and the Canadian Institutes of Health Research. K. S. and N. D. B would like to thank J. G. Bomer for his help in the cleanroom at Mesa+ Institute of Nanotechnology, University of Twente.References
- A. Perro, G. Lebourdon, S. Henry, S. Lecomte, L. Servant and S. Marre, Combining microfluidics and FT-IR spectroscopy: Towards spatially resolved information on chemical processes, React. Chem. Eng., 2016, 1(6), 577–594 RSC.
- A. Aguirre, P. A. Kler, C. L. A. Berli and S. E. Collins, Design and operational limits of an ATR-FTIR spectroscopic microreactor for investigating reactions at liquid-solid interface, Chem. Eng. J., 2014, 243, 197–206 CrossRef CAS.
- J. Fagaschewski, D. Sellin, C. Wiedenhöfer, S. Bohne, H. K. Trieu and L. Hilterhaus, Spatially resolved in situ determination of reaction progress using microfluidic systems and FT-IR spectroscopy as a tool for biocatalytic process development, Bioprocess Biosyst. Eng., 2015, 38(7), 1399–1405 CrossRef CAS PubMed.
- A. J. DeMello, Control and detection of chemical reactions in microfluidic systems, Nature, 2006, 442, 394–402 CrossRef CAS PubMed.
- K. S. Elvira, X. C. I Solvas, R. C. R. Wootton and A. J. Demello, The past, present and potential for microfluidic reactor technology in chemical synthesis, Nat. Chem., 2013, 5, 905–915 CrossRef CAS PubMed.
- J. P. McMullen and K. F. Jensen, Rapid determination of reaction kinetics with an automated microfluidic system, Org. Process Res. Dev., 2011, 15(2), 398–407 CrossRef CAS.
- M. Nagasaka, H. Yuzawa, N. Takada, M. Aoyama, E. Rühl and N. Kosugi, Laminar flow in microfluidics investigated by spatially-resolved soft X-ray absorption and infrared spectroscopy, J. Chem. Phys., 2019, 151, 114201 CrossRef PubMed.
- E. Gross, X. Z. Shu, S. Alayoglu, H. A. Bechtel, M. C. Martin and F. D. Toste, et al., In situ IR and X-ray high spatial-resolution microspectroscopy measurements of multistep organic transformation in flow microreactor catalyzed by Au nanoclusters, J. Am. Chem. Soc., 2014, 136(9), 3624–3629 CrossRef CAS PubMed.
- P. D. I. Fletcher, S. J. Haswell and X. Zhang, Monitoring of chemical reactions within microreactors using an inverted Raman microscopic spectrometer, Electrophoresis, 2003, 24(18), 3239–3245 CrossRef CAS PubMed.
- J. B. Salmon, A. Ajdań, P. Tabeling, L. Servant, D. Talaga and M. Joanicot, In situ Raman imaging of interdiffusion in a microchannel, Appl. Phys. Lett., 2005, 86(9), 1–3 CrossRef.
- J. Li, H. Šimek, D. Ilioae, N. Jung, S. Bräse and H. Zappe, et al., In situ sensors for flow reactors-A review, React. Chem. Eng., 2021, 6(9), 1497–1507 RSC.
- G. Rinke, A. Ewinger, S. Kerschbaum and M. Rinke, In situ Raman spectroscopy to monitor the hydrolysis of acetal in microreactors, Microfluid. Nanofluid., 2011, 10(1), 145–153 CrossRef CAS.
- J. Greener, B. Abbasi and E. Kumacheva, Attenuated total reflection Fourier transform infrared spectroscopy for on-chip monitoring of solute concentrations, Lab Chip, 2010, 10(12), 1561–1566 RSC.
- J. J. A. Lozeman, T. Elsbecker, S. Bohnenn, H. L. De Boer, M. Krakers and G. Mul, et al., Modular microreactor with integrated reflection element for online reaction monitoring using infrared spectroscopy, Lab Chip, 2020, 20(22), 4166–4174 RSC.
- N. Hassler, D. Baurecht, G. Reiter and U. P. Fringeli, In situ FTIR ATR spectroscopic study of the interaction of immobilized human serum albumin with cholate in aqueous environment, J. Phys. Chem. C, 2011, 115(4), 1064–1072 CrossRef CAS.
- J. Haas, E. V. Catalán, P. Piron, M. Karlsson and B. Mizaikoff, Infrared spectroscopy based on broadly tunable quantum cascade lasers and polycrystalline diamond waveguides, Analyst, 2018, 143(21), 5112–5119 RSC.
- A. J. Sommer and M. Hardgrové, Attenuated total internal reflection infrared microspectroscopy for the analysis of trace solutes in aqueous solutions, Vib. Spectrosc., 2000, 24, 93–100 CrossRef CAS.
- C. Marcott, A. E. Dowrey, J. Van Poppel and I. Noda, Infrared spectroscopic analysis of a series of blends of poly(lactic acid) and poly(3-hydroxybutyrate-co-3-hydroxyhexanoate), a bacterial copolyester, Vib. Spectrosc., 2004, 36, 221–225 CrossRef CAS.
- T. A. Morhart, S. Read, G. Wells, M. Jacobs, S. M. Rosendahl and S. Achenbach, et al., Attenuated Total Reflection Fourier Transform Infrared (ATR FT-IR) Spectromicroscopy Using Synchrotron Radiation and Micromachined Silicon Wafers for Microfluidic Applications, Appl. Spectrosc., 2018, 72(12), 1781–1789 CrossRef CAS PubMed.
- K. Srivastava, N. D. Boyle, K. F. A. Jorissen, I. J. Burgess, W. van der Stam and A. van den Berg, et al., ATR microreactor: A tool for in-situ and spatial reaction monitoring, in Proceedings of IEEE Sensors, Institute of Electrical and Electronics Engineers Inc., 2022 Search PubMed.
- Q. Zhong and J. C. Owrutsky, Vibrational energy relaxation and reorientation of azide ion pairs in DMSO, Chem. Phys. Lett., 2004, 383(1–2), 176–180 CrossRef CAS.
- A. E. Kamholz, B. H. Weigl, B. A. Finlayson and P. Yager, Quantitative analysis of molecular interaction in a microfluidic channel: The T-sensor, Anal. Chem., 1999, 71(23), 5340–5347 CrossRef CAS PubMed.
- A. E. Kamholz and P. Yager, Theoretical analysis of molecular diffusion in pressure-driven laminar flow in microfluidic channels, Biophys. J., 2001, 80(1), 155–160 CrossRef CAS PubMed.
- G. T. Flaman, N. D. Boyle, C. Vermelle, T. A. Morhart, B. Ramaswami and S. Read, et al., Chemical Imaging of Mass Transport Near the No-Slip Interface of a Microfluidic Device using Attenuated Total Reflection-Fourier Transform Infrared Spectroscopy, Anal. Chem., 2022, 4940–4949 Search PubMed.
- A. R. W. McKellar, High-resolution infrared spectroscopy with synchrotron sources, J. Mol. Spectrosc., 2010, 262(1), 1–10 CrossRef CAS.
- S. T. H. Sherazi, M. Y. Talpur, S. A. Mahesar, A. A. Kandhro and S. Arain, Main fatty acid classes in vegetable oils by SB-ATR-Fourier transform infrared (FTIR) spectroscopy, Talanta, 2009, 80(2), 600–606 CrossRef CAS PubMed.
- K. T. Sørensen and A. Kristensen, Label-free monitoring of diffusion in microfluidics, Micromachines, 2017, 8(11), 329 CrossRef PubMed.
- E. Hecht, Optics, Addison-Wesley Publishing, Reading, Mass, USA, 5th edn, 1987, pp. 491–492 Search PubMed.
- K. Makuch, R. Hołyst, T. Kalwarczyk, P. Garstecki and J. F. Brady, Diffusion and flow in complex liquids, Soft Matter, 2020, 16(1), 114–124 RSC.
- M. S. Williams, K. J. Longmuir and P. Yager, A practical guide to the staggered herringbone mixer, Lab Chip, 2008, 8(7), 1121–1129 RSC.
- A. D. Stroock, S. K. W. Dertinger, A. Ajdari, I. Mezić, H. A. Stone and G. M. Whitesides, Chaotic mixer for microchannels, Science, 2002, 295(5555), 647–651 CrossRef CAS PubMed.
- M. Bayareh, M. N. Ashani and A. Usefian, Active and passive micromixers: A comprehensive review, Chem. Eng. Process., 2020, 147, 107771 CrossRef CAS.
- N. Sasaki, T. Kitamori and H. B. Kim, AC electroosmotic micromixer for chemical processing in a microchannel, Lab Chip, 2006, 6(4), 550–554 RSC.
- A. Kandalkar, N. Pathak, A. Kulkarni and A. Morarka, Active micromixer platform based on Lorentz force for lab-on-a-chip application, Rev. Sci. Instrum., 2022, 93(5), 055005 CrossRef CAS PubMed.
- D. L. Zhou, H. Carrero and J. F. Rusling, Radical vs Anionic Pathway in Mediated Electrochemical Reduction of Benzyl Bromide in a Bicontinuous Microemulsion, Langmuir, 1996, 12(12), 3067–3074 CrossRef CAS.
- R. G. Lebel and D. A. I. Goring, Density, Viscosity, Refractive Index, and Hygroscopicity of Mixtures of Water and Dimethyl Sulfoxide, J. Chem. Eng. Data, 1962, 1(7), 100–101 CrossRef.
- H. A. Schwarz and P. S. Gill, Diffusion-Limited Solvated Electron Reactions in Ethanol and Water, J. Phys. Chem., 1957, 116(11), 261 Search PubMed.
- R. A. McClelland, V. M. Kanagasabapathy, N. S. Banait and S. Steenken, Reactivities of Triarylmethyl and Diarylmethyl Cations with Azide Ion Investigatedby Laser Flash Photolysis. Diffusion-Controlled Reactions, J. Chem. Soc., Chem. Commun., 1991,(7), 7888–7900 Search PubMed.
- C. J. Cattanach, The infrared spectra of benzyl and substituted benzyltin compunds, Spectrochim. Acta, 1968, 24A, 407–415 CrossRef.
- S. Sun and P. Wu, Mechanistic insights into Cu(I)-catalyzed azide-alkyne ‘click’ cycloaddition monitored by real time infrared spectroscopy, J. Phys. Chem. A, 2010, 114(32), 8331–8336 CrossRef CAS PubMed.
- H. Son, Y. Kwon, J. Kim and S. Park, Rotational dynamics of metal azide ion pairs in dimethylsulfoxide solutions, J. Phys. Chem. B, 2013, 117(9), 2748–2756 CrossRef CAS PubMed.
- E. Lieber, C. N. Ramachandra Rao, T. S. Chao and W. W. Hoffman, Infrared Spectra of Organic Azides, Anal. Chem., 1957, 29(6), 916–918 CrossRef CAS.
- P. Kumar, C. Joshi, A. K. Srivastava, P. Gupta, R. Boukherroub and S. L. Jain, Visible Light Assisted Photocatalytic [3 + 2] Azide-Alkyne ‘Click’ Reaction for the Synthesis of 1,4-Substituted 1,2,3-Triazoles Using a Novel Bimetallic Ru-Mn Complex, ACS Sustainable Chem. Eng., 2016, 4(1), 69–75 CrossRef.
Footnotes |
| † Electronic supplementary information (ESI) available. See DOI: https://doi.org/10.1039/d3lc00521f |
| ‡ Authors contributed equally. |
| This journal is © The Royal Society of Chemistry 2023 |