 Open Access Article
Polypentenamer thermoplastic elastomers via copolymerization of cyclopentene and dicyclopentadiene†
Daniel W.
Weller
a,
Robert
Halbach
b,
Alexander V.
Zabula
 b,
Sarah J.
Mattler
b,
Xiaodan
Gu
b,
Sarah J.
Mattler
b,
Xiaodan
Gu
 *a and
Carlos R.
López-Barrón
 *b
*b
aSchool of Polymer Science and Engineering, The University of Southern Mississippi, Hattiesburg, Mississippi 39406, USA. E-mail: xiaodangu@usm.edu
bExxonMobil Technology and Engineering Company, 5200 Bayway Drive, Baytown, Texas 77520, USA. E-mail: carlos.r.lopez-barron@exxonmobil.com
First published on 9th August 2023
Abstract
Dicyclopentadiene (DCPD) monomer was incorporated at various levels into statistical copolymerizations with cyclopentene (CP) to determine its influence on the resulting copolymers. We characterized the thermal, viscoelastic, mechanical, and morphological changes upon adding DCPD and determined its strengthening mechanism. DCPD units formed branching points along the polymer that phase separated into glassy domains. These glassy nanodomains acted as physical crosslinks providing strength to the uncured network. Increases in copolymer elastic modulus and viscosity were proportional to DCPD content, and thermoplastic elastomer (TPE) mechanical behavior was observed with high levels of DCPD incorporation. This work demonstrates that DCPD copolymerization can be used to predictably increase the uncured strength of polypentenamers and at higher loading levels could find use as a TPE.
Introduction
Elastomers are a class of soft, highly deformable materials. Elastomeric properties derive from an entropic effect that occurs when a network of long, flexible, chains become deformed.1 Typically, low glass transition temperature (Tg) elastomers are used well above their melting temperature (Tm) where large-scale chain rearrangement is possible, allowing extreme deformability before rupture. Elastomers typically employ a crosslinking strategy which lock a few segments along each chain in place. Such crosslinking can be of physical or chemical nature (or a combination of both). When stretched, crosslinks prevent chains from relaxing into a coiled structure, preserving the network structure and allowing the material to be stretched repeatedly without much permanent deformation.2 It has been shown that the mechanical response of an elastomer is largely dictated by its network topology including molecular weight between crosslinks, crosslink functionality, entanglement density, and number of dangling ends.3Polypentenamers, formed by the ring opening metathesis polymerization (ROMP) of cyclopentene (CP), are a versatile class of elastomer that first gained attention for their potential as a natural rubber replacement. Originally discovered by Eleuterio,4 and further developed by Natta et al.,5 polypentenamers can be synthesized to a primarily trans configuration using tungsten based catalysts or a primarily cis configuration using molybdenum based catalysts. Tucker et al. later showed that the thermal properties, and therefore strain-induced crystallization properties, could be vastly tuned by altering cis–trans ratios.6 High trans polypentenamer (>70% trans) has been most widely studied because its thermal properties are similar to that of natural rubber (Tm ≈ 18 °C), and it also has better abrasion resistance, processability, and can withstand high loading levels of filler.7cis-Polypentenamer has much lower melting temperature and therefore remains soft and flexible even in extreme environments, however its mechanical properties, including its ability to undergo strain-induced crystallization, are diminished.8
Dicyclopentadiene (DPCD) also undergoes ROMP with tungsten-based catalysts. DCPD differs from CP monomer in that it can ring open twice forming two branches at every linkage. When polymerized alone, DCPD forms a rigid crosslinked network. DCPD has been used industrially for reaction injection molding applications for its high modulus, impact strength, and creep resistance.9 As we have shown previously, copolymerizing CP and DCPD monomer created a branched polypentenamer rubber with increased tensile strength and modulus, but it was suspected that phase separation, not branching, caused the improved properties.10 While the previous study primarily examined the morphological differences between linear polypentenamer and branched copolymer polypentenamer with a DCPD content of 1.7%, the present work delves into a comprehensive investigation of the impact of DCPD volume fraction. Specifically, our focus lies in exploring the effects of varying DCPD content on the overall properties of the newly developed polymer as a copolymer. We synthesized and examined five different DCPD concentrations to gain insights into their influence on the rubber properties.
Branching is commonly used to tune material properties and its effects have been studied for many different chain architectures.11,12 In polyolefins, branching is known to reduce crystallinity, resulting in lower modulus and tensile strength.13,14 These effects are most obvious when short, densely packed, chains are employed.15 As the chains become longer, the branches themselves may participate in crystallization/entanglement and the properties approach those of linear polymers. We therefore concluded that the increase in mechanical performance observed in DCPD containing samples was not due to branching. Rather, nanophase separation of hard DCPD-rich domains strengthened the polypentenamer by physical crosslinking, as well as acting as a nanofiller.
Fillers such as carbon black or silica are extensively used as reinforcement in elastomers and have been thoroughly studied.16,17 Fillers are primarily used in tire formulations to increase strength, modulus, abrasion resistance and to decrease cost. The strengthening mechanism is believed to come from restricted rubber movement due to a combination of hydrodynamic effects, filler-rubber interactions, and filler–filler interactions.18
Physical crosslinking, like chemical crosslinking, connects discreet polymer chains to form an interconnected network providing improved strength, modulus, and elastic recovery. Physical crosslinks differ from chemical crosslinks in that they do not involve covalent bonds and can therefore be reprocessed at temperatures where the physical crosslinks dissociate. These types of elastomers are known as thermoplastic elastomers (TPE). TPE's are composed of polymer chains containing both hard and soft segments. The soft segments provide the elastomeric behavior while the hard segments undergo intermolecular association creating physical crosslinks. Commonly ABA triblock copolymers are used, however other types of TPE's are made with a statistical incorporation of hard copolymer. These “segmented” TPEs can contain more than 50 blocks.19
Up until now it was unclear whether the stiffening effect of DCPD was due to a nanofiller effect, or whether it was due to physical crosslinks. Herein we systematically explored the impact DCPD content has in uncured, trans-polypentenamers. We were able to observe clear trends relating DCPD content to changes in mechanical performance, thermal transitions, crystallization behavior, and morphology. This study suggests that the major strengthening mechanism is physical crosslinking. This research offers valuable insights for the development of high-strength thermoplastic elastomers using crude oil distillery by-products. These novel elastomers have immense potential for a wide range of applications, including the automotive industry (such as interior components and rubber tires) and consumer goods sector (such as appliances and toys), where specialized elastomers are in high demand.
Experimental
Materials
CP monomer, DCPD monomer, and anhydrous toluene (Sigma-Aldrich) were further purified by degassing and passing through an activated alumina column. DCPD was first dissolved in an equal volume of toluene before purification. Tungsten(VI) hexachloride, triethylaluminum, and 2,6-di-tert-butyl-4-methylphenol (Sigma-Aldrich) were used as received. All polymerizations, as well as catalyst generation, were carried out under nitrogen atmosphere using glove-box or Schlenk techniques. Neat triethylaluminum (CAUTION: extremely pyrophoric) was diluted with toluene to at least 1/10 its weight in a glovebox before transferring into the polymerization reactor.Polymerizations
Polymer samples were generated as described recently.10,20–22 The pre-catalyst was formed by adding solid {4-(PhCH2)C6H4O}2AlCl (0.312 g, 0.735 mmol) to a solution of WCl6 (0.145 g, 0.367 mmol) in toluene (20 mL). After stirring for one hour at ambient conditions, the resulting mixture was added to a solution containing CP (major comonomer, 100 g, 1.467 mol), triethylaluminum (activator, 83 mg, 0.735 mmol), and toluene (1200 mL) at 0 °C. Various concentrations of DCPD [minor comonomer, 0.193 g (1.46 mmol), 0.98 g (7.45 mmol), 2.91 g (22.0 mmol) or 19.3 g (147.0 mmol)] dissolved in toluene were slowly added dropwise throughout the first 60 min of polymerization while maintaining the reaction temperature at 0 °C. After an additional 2 h of stirring at this temperature, a solution of 2,6-di-tert-butyl-4-methylphenol (antioxidant, 1.00 g, 4.48 mmol) in 100 mL of ethanol/toluene mixture (1![[thin space (1/6-em)]](https://www.rsc.org/images/entities/char_2009.gif) :
:![[thin space (1/6-em)]](https://www.rsc.org/images/entities/char_2009.gif) 4, v
4, v![[thin space (1/6-em)]](https://www.rsc.org/images/entities/char_2009.gif) :
:![[thin space (1/6-em)]](https://www.rsc.org/images/entities/char_2009.gif) v) was added. The obtained mixture was then precipitated in methanol and further washed with methanol three times before being dried under vacuum at 50 °C for 4 h. Yields 23–41%.
v) was added. The obtained mixture was then precipitated in methanol and further washed with methanol three times before being dried under vacuum at 50 °C for 4 h. Yields 23–41%.
Characterization
13C and 1H NMR spectroscopy were used to determine the cis/trans content of the CP units as well as DCPD content of the copolymers based on previous reports.23 Samples were prepared by dissolving the polymer in CDCl3 and filtering this solution into a 10 mm NMR tube. NMR spectroscopic data of polymers were recorded at 25 °C using a 600 MHz Bruker Avance IIIHD NMR spectrometer. The cis/trans ratio in the polymer samples was estimated according to the previous report by integrating the intensities of 13C NMR resonances of cis- and trans-carbon atoms at 129.8 ppm and 130.3 ppm, respectively (Fig. S13 in the ESI†).Gel permeation chromatography (GPC) was used to determine weight average molecular weight (Mw), polydispersity (Đ) and branching index (g′). A triple-detector GPC equipped with a differential refractive index detector, an 18-angle light scattering (LS) detector, and a 4-capillary viscometer was used. Three Agilent PLgel 10 μm Mixed-B LS columns were used to provide polymer separation. The polymer solutions were passed through a syringe filter prior to injection into the columns. HPLC-grade THF solvent was used as the mobile phase. The nominal flow rate and injection volume were 0.5 ml min−1 and 200 μL, respectively. The whole system including transfer lines, columns, and viscometer detector were contained in ovens maintained at 40 °C. The polymer was dissolved at 40 °C with continuous shaking for about 2 h. The dn/dc is determined with the DRI detector by assuming 100% mass recovery and the averaged value 0.1154 is used for all the PHA samples. The Mark–Houwink parameters for each sample are obtained by linearly fitting the curve log![[thin space (1/6-em)]](https://www.rsc.org/images/entities/char_2009.gif) M vs. log
M vs. log![[thin space (1/6-em)]](https://www.rsc.org/images/entities/char_2009.gif) IV in which the “M” is the light scattering molecular weight while the “IV” is the intrinsic viscosity corresponding to each elution volume slice. The Mw and polydispersity values reported in Table 1 are those determined by MALLS.
IV in which the “M” is the light scattering molecular weight while the “IV” is the intrinsic viscosity corresponding to each elution volume slice. The Mw and polydispersity values reported in Table 1 are those determined by MALLS.
| DCPD (mol%) | cis/trans ratio | M w (kg mol−1) | Đ (Mw/Mn) | g′ (vis avg) | GPC mass recovery (%) |
|---|---|---|---|---|---|
| 0.0 | 18/82 | 285 | 1.85 | 1.00 | 100 |
| 0.6 | 18/82 | 346 | 2.18 | 0.96 | 100 |
| 3.3 | 19/81 | 776 | 2.15 | 0.91 | 91 |
| 6.6 | 19/81 | 1072 | 2.27 | 0.87 | 92 |
| 21.3 | 19/81 | 541 | 1.81 | 0.87 | 52 |
A dynamic mechanical analyzer RSA-G2 (TA Instruments) was used for tensile tests of dog-bone specimens (of dimensions 15 mm × 3 mm × 0.5 mm). The specimens for tensile and rheological measurements were prepared at 80 °C to avoid any crosslinking or degradation. The dog-bone specimens were stretched at a linear deformation rate of 100 μm s−1, which corresponds to a strain rate of 6.7 × 10⁻³ s−1. These tensile tests were carried out at room temperature and by triplicates to ensure reproducibility. The RSA-G2 is equipped with a force transducer that allows measurements of axial force as a function of strain during uniaxial deformation. The engineering stress is computed as F(t)/A0, where F(t) is the instantaneous force, and A0 is the initial cross section area of the dogbone specimen.
Differential scanning calorimetry (DSC) was used to determine glass transition temperature, melting temperature, and crystallization temperature (Tg, Tm, Tc, respectively). DSC scans were performed using a DSC2500™ (TA Instruments). Various heating/cooling rates were used to reveal different transitions. The details of each scan can be found where the data is presented below.
Rheological measurements were performed using 1 mm thick plaques of polypentenamer. Plaques were molded using a hot press equilibrated at 80 °C and subsequently cut into 8 mm discs. Dynamic frequency sweep (DFS) measurements were performed at 80 °C under nitrogen atmosphere using a strain-controlled ARES-G2 rheometer (TA Instruments™) with 25 mm parallel plate geometry. The frequency range used for the DFS measurements was 10−3 to 628 rad s−1 and the strain amplitude was 1%. Dynamic temperature ramps were performed at a constant frequency of 1 Hz with a heating/cooling temperature of 2 °C min−1, using a strain amplitude of 0.1%.
Small-angle and wide-angle X-ray scattering (SAXS and WAXS) were performed using a Xeuss 2.0 laboratory beamline (Xenocs Inc.) with an X-ray wavelength of 1.54 Å and sample-to-detector distances of 137 mm and 2.5 m, respectively. Diffraction images were recorded on a Pilatus 1M Detector (Dectris Inc.) during an exposure time of 5 min. 2D images were then loaded into IgorPro™ and analyzed using the Nika software package.24,25 Percent crystallinity was calculated using the multipeak fitting function in IgorPro™ to deconvolute the amorphous and crystalline contributions to the 1D WAXS scattering intensity according to eqn (1).
 | (1) |
The long period (Lp), in this case representing the lamellar thickness (amorphous + crystalline), was found from Kratky plots (I × q2vs. q). By plotting the data in this fashion, qmax is easily determined and used to calculate the long period from the equation Lp = 2π/qmax.26
Morphologies of the polypentenamer rubber samples were examined using a bimodal AFM (Cypher, Asylum Research). The specimens for AFM analysis were prepared by cryo-facing at −120 °C using a cryo-microtome (Leica). Bimodal AFM, where the cantilever-tip ensemble is simultaneously excited at two eigenmodes, was used to deliver enhanced contrast.27,28
Results
To investigate the impact of DCPD content on polypentenamer properties, we copolymerized CP with varying amounts of DCPD. Each DCPD monomer unit that is incorporated into the polypentenamer backbone can ring open to create 2 branches as shown in Fig. 1. In addition to branching these units can phase separate forming hard nanodomains that act as both physical crosslinks and nanofiller.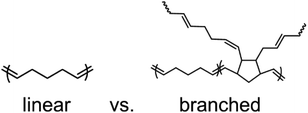 | ||
| Fig. 1 Chemical structures of polypentenamers made only with CP monomer (linear) and those made with a copolymerization of CP and DCPD monomer (branched). | ||
Polymer characterizations
Four copolymers were synthesized for this study with DCPD content ranging from 0.6 mol% to 21.3 mol% as well as a linear polypentenamer control (Table 1). Care was taken to ensure that the cis/trans contents were all equivalent as this greatly effects the thermal properties of the polymer. 1H and 13C NMR spectra for the copolymers are included in the ESI.† The peak corresponding to the methylene carbon directly bonded to the residual unsaturation in the DCPD (35.5–39 ppm) incorporated into the polymer is being used to calculate DCPD content. These results indicate that the CP and DCPD monomers copolymerized to certain level, such that nor all-DCPD blocks or DCPD homopolymers form. If either of these two species were present, a larger number of signals would be present due to tacticity. We also tried to keep molecular weight (MW) and dispersity (Đ) constant but unfortunately there was significant variation in the MW. Despite this, the trends in the properties with DCPD content remained clear as shown below. The branching index (g′) is a measure of the degree of branching where a value of 1 represents a linear polymer, and this value is reduced as branching increases. The g′ value is calculated from the GPC data by the relation g′ = [η]avg/KMvα, where [η] is the intrinsic viscosity, Mv is the viscosity-average molecular weight, and K and α are constants determined by the reference polymer.30 The values in Table 1 were acquired by NMR23,29 and GPC analysis (Fig. S1†). It should be noted that the mass recovery of the 21.3% sample is only 52% (Table 1), indicating that this sample may have some amount of gels.DCPD impact on mechanical properties
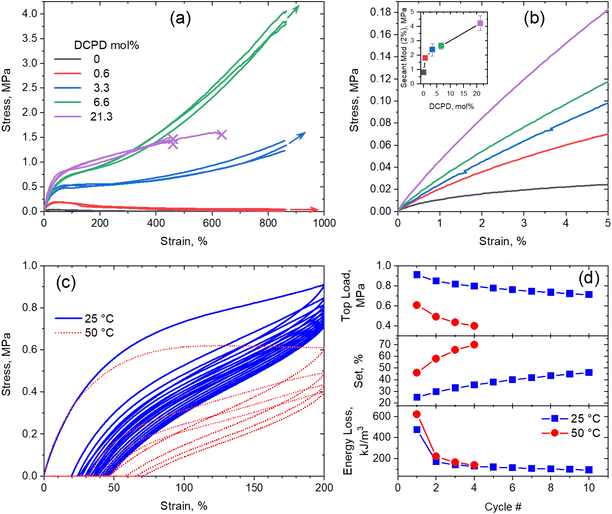
Previous work done by our group showed that DCPD incorporation increased the strength and modulus of vulcanized polypentenamer rubbers (PPR).10 Phase separated DCPD-rich domains acting as nanofiller were believed to be the main contributor to the increased mechanical properties. We expand on this work here by evaluating uncrosslinked (green) polypentenamers containing a wide range of DCPD content. We chose not to crosslink the rubbers for two reasons. Firstly, to isolate the impact of DCPD content on strength and modulus from the effect of vulcanization (chemical crosslinking). Secondly, to evaluate DCPD's ability to increase green strength, an important characteristic for the manufacturability of certain rubber products (e.g., tires).Fig. 2a shows the remarkable effect of DCPD on the green strength of the PPR copolymers. The linear sample with no DCPD showed typical tensile behavior of an uncured rubber, namely, a drop in tensile stress at small strains and no strain hardening. But with increasing amounts of DCPD we observed increases in strength and modulus. At 6.6% DCPD tensile strength was greatly improved while remaining highly stretchable. Note that the maximum strain achievable in the AR-G2 instrument is ∼865% and, therefore, the arrows in Fig. 2a indicate that the maximum stretch before break was not reached and further deformation was possible. For the sample with 21.3% DCPD rupture occurred earlier in the stretch (≈450%) indicating that at such large DCPD content, the rubber samples become brittle.
Fig. 2b shows a detail of representative stress–strain curves up to 5% of strain. In this region, the modulus of each polymer can be seen more easily and demonstrates the stiffening effect of DCPD. The modulus of each polymer (taken at 2% strain) is plotted in the inset. A sharp increase in modulus was observed going from 0% to 0.6% DCPD, after which modulus increased with DCPD content in a near linear fashion. Note that at such low strain, differences in MW should not influence the modulus.31
Further testing of the 6.6% DCPD polymer revealed good cyclic tensile response. Fig. 2c shows a strain cycling experiment used to evaluate the elastic properties of the sample at 25 °C. After the first stretch to 200% strain the sample achieved 87% recovery. After the second stretch the sample showed a 97% recovery. Compared to general purpose elastomers, the hysteresis loss is large, but significant recovery after strain shows that the polymers must be physically crosslinked.
Three mechanical parameters, namely, top load (stress at 200% strain), set (residual strain after unloading step of a cycle) and the energy loss (computed as the area between the load and unload stress–strain curves in a cycle), were computed for each cycle and plotted as a function of cycle number in Fig. 2(d). It is clear that, although the typical fatigue effect (decrease in top load and increase in set) is observed after multiple cycles, the strain recovery is maintained at high levels. Moreover, the drop in hysteretic energy loss after the first cycle indicates that most of the structural damage (e.g., network breakage) occurs during the first cycle, whereas subsequent loading-unloading cycles produce minimum damage.
Note that the melting temperature of this sample (−7 °C) is much lower than the temperature at which the tensile measurements were carried out, whereas the melting temperature of the homopolymer (0% DCPD) is much higher (9 °C). The fact that the uncured homopolymer did not show any sign of strain-induced crystallization (SIC) gives us confidence that the elastic response in the copolymers is not due to SIC, as all the copolymers have lower melting temperature than he homopolymer. To further confirm this fact, we carried out cyclic tensile test of the 6.6% DCPD polymer at 50 °C (67 °C above its melting temperature). At this temperature, SIC is unattainable; however, the sample showed softer but still elastic response under cyclic loading.
Morphology
Room temperature AFM images of the samples revealed nano phase separated hard nanodomains within the soft matrix that increased in density with DCPD content (Fig. 3). As discussed in our previous work,10 these nanodomains are aggregates of the DCPD-rich branching units. These aggregates act as physical crosslinks, which explains the elastomeric behavior discussed above in these uncrosslinked copolymers. It is worth noting that, due to the slow comonomer addition process, the DCPD-rich domains are randomly distributed along the chains. Phase separation can occur between branched (DCPD-rich sequences) and unbranched domains (DCPD-free sequences along the chain),32 or from differences in Tg.33 Typically random copolymers do not phase separate as the minor component is sufficiently solubilized by its covalently bound neighbors. Notice that, as mentioned above, all-DCPD blocks or DCPD homopolymer are not detected by NMR. However, we believe that the more reactive DCPD monomer may form blocky segments, composed of DCPD-rich and DCPD-poor sequences, increasing the propensity to phase separate. | ||
| Fig. 3 AFM images of hard nanodomains in polypentenamer matrix at (a) 0.6% DCPD, (b) 3.3% DCPD, (c) 6.6% DCPD, and (d) 21.7% DCPD. | ||
DCPD impact on thermal properties
DSC scans on the polypentenamers show a strong correlation between DCPD content and their thermal transition temperatures. Under typical heating/cooling scans rates of 10 °C min−1, polymers with low DCPD content show strong melting and crystallization peaks. However, at high levels of DCPD incorporation, crystallization and melting was effectively suppressed (Fig. 4a). We found that Tg, Tc, and Tm scaled linearly with DCPD content (Fig. 4b). As DCPD content increases, both Tc and Tm decreases. We hypothesize that physical crosslinks reduce chain mobility therefore frustrating the crystalline packing and shifting Tc and Tm to lower and lower values. Reduced chain mobility can also explain the increases in Tg with DCPD content, as less mobile chains require more energy before transitioning into the rubbery region. Alternatively, the Tg increase observed in Fig. 4(b) can also be due to partial incorporation of DCPD units in the CP-rich sequences. To asses this, we plotted the Tg prediction from the Fox equation (Tg = 1/(wDCPD/Tg,DCPD + (1 − wDCPD)/Tg,CP),34 where wDCPD is the weight fraction of DCPD in the polymer. The fact that the Fox equation overestimate the measured Tg values indicates that the amount of DCPD units incorporated to the CP-rich sequences are less than the overall DCPD content in the polymer. This observation supports the argument that the DCPD units are not uniformly distributed along the chain as individual entities. Note that neither DSC nor DMTA measurements detected a glass transition of the DCPD-rich sequences. This could be due to the fact that these sequences may contain significant amount of CP monomer, which would have the effect of reducing the Tg (with respect to a DCPD homopolymer with reported Tg = 158 °C (ref. 35) and/or the DMTA signal would be weaken and/or broaden.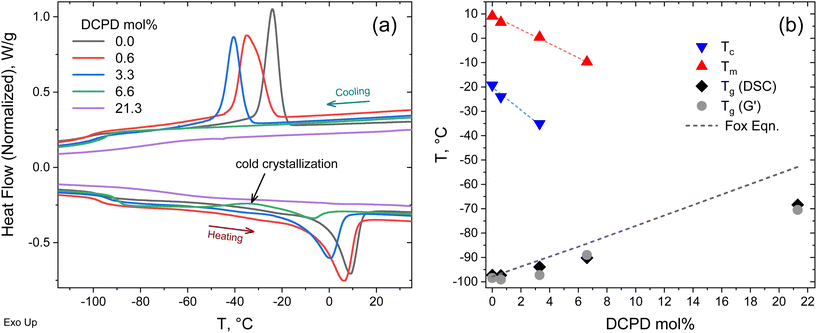 | ||
| Fig. 4 Thermal properties of copolymers (a) DSC heating and cooling curves at 10 °C min−1. (b) Thermal transitions as a function of DCPD content. | ||
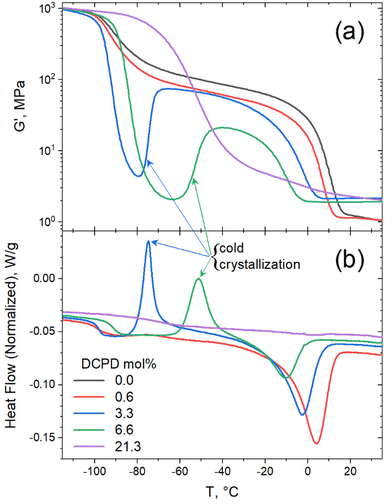
Evidence of cold crystallization in the heating scan of the 6.6 mol% sample (as indicated in Fig. 4a) prompted further thermal analysis using dynamic mechanical thermal analysis (DMTA). For this test the samples were loaded in the rheometer in the melt state (at 50 °C) and rapidly cooled down (at a cooling rate of 60 °C min−1) to −120 °C, before starting the dynamic temperature ramp to 150 °C at 2 °C min−1. Cold crystallization was evident in the DMTA data for the 3.3 and 6.6 mol% samples, as seen in Fig. 5a. The substantial decrease in storage modulus (G′) marks the glass transition of the polymer. The subsequent increase in G′, observed in the 3.3 and 6.6 mol% samples, was a result of polymer crystallization occurring after the polymer chains gain mobility. Further temperature increase led to melting of the crystals, manifested as the second drop in G′. A full description of the DMTA including G′′ values are provided in Fig. S2.† The cold-crystallization phenomena was verified by DSC measurements using a rapid cooling rate (60 °C min−1) and a slower heating rate (2 °C min−1) as shown in Fig. 5b. Cold crystallization in high DCPD content samples confirms that DCPD slows the kinetics of crystallization, reinforcing the correlation between DCPD content and decrease in chain mobility.
DCPD impact on rheological behavior
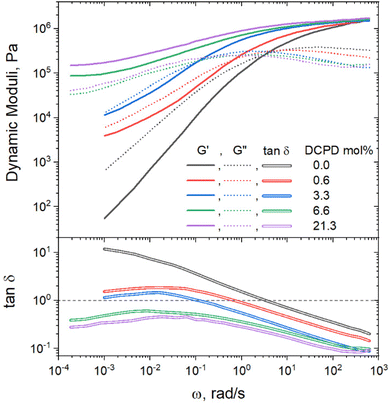
Rheology was used to get a better understanding of how DCPD incorporation impacted the mechanical response at different time scales. Frequency sweep measurements, as shown in Fig. 6, demonstrate that branching increased the elastic behavior of the polymers. This is especially apparent when comparing the elastic modulus (G′) at low frequencies where the relaxation of the whole chains is proved. Only the linear sample reached the terminal regime, indicated by a slope of loss modulus (G′′) approaching a value of 2. In this regime the linear polymer can be considered a viscoelastic liquid. None of the copolymers reach this regime, indicating more elastic behavior. For samples with 6.6 and 21.3% DCDP, a low frequency plateau can be observed, evidencing solid-like behavior. The same conclusion can be made by examining the tan![[thin space (1/6-em)]](https://www.rsc.org/images/entities/char_2009.gif) δ curves, calculated as tan
δ curves, calculated as tan![[thin space (1/6-em)]](https://www.rsc.org/images/entities/char_2009.gif) δ = G′′/G′. Higher DCPD content polymers had lower tan
δ = G′′/G′. Higher DCPD content polymers had lower tan![[thin space (1/6-em)]](https://www.rsc.org/images/entities/char_2009.gif) δ values because they could store energy more effectively as the chain relaxation processes are hindered. The crossover frequency (tan
δ values because they could store energy more effectively as the chain relaxation processes are hindered. The crossover frequency (tan![[thin space (1/6-em)]](https://www.rsc.org/images/entities/char_2009.gif) δ = 1) is the point where the viscus and elastic components of a material viscoelastic response are equivalent. The two polymers with the highest DCPD content never reach the crossover frequency, demonstrating primarily elastic behavior across all measurable time scales.
δ = 1) is the point where the viscus and elastic components of a material viscoelastic response are equivalent. The two polymers with the highest DCPD content never reach the crossover frequency, demonstrating primarily elastic behavior across all measurable time scales.
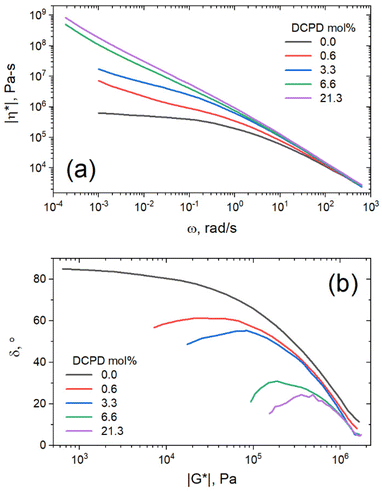
The same data can be plotted as complex viscosity as defined as |η*| = |G*|/ω. Complex viscosity gives a good description of the material's overall resistance to flow, assuming that the Cox-Merz rule is obeyed.26 As can be seen in Fig. 7a, the low frequency viscosity increases with DCPD content, indicating improved melt strength. All samples showed shear thinning behavior with viscosities that converge at high shear rates. In this region the test primarily probes local chain dynamics, and the influence of overall chain topology disappears. At slower shear rates we begin to probe the dynamics of larger chain segments. In this region only the linear sample approaches a zero-shear-rate viscosity plateau, whereas all branched samples exhibited an apparent yield stress (ever increasing viscosity at low shear rate).
The DFS data was reorganized in a van Gurp–Palmen (vGP) plot (Fig. 7b), a plot commonly used to determine topological differences in polymer architectures.36 In this plot, phase angle (δ) is plotted as a function of the complex modulus (|G*|). A monotonic decrease of δ with |G*| typically indicates linear polymer architecture, whereas inflection points or peaks suggest branched architectures. Phase angle refers to the phase shift between max stress and max strain in an oscillatory experiment. Purely elastic materials have a phase shift of 0°, as max stress occurs at maximum strain. Alternatively, purely viscous materials have a phase shift of 90°, as max stress occurs at 0 strain where velocity is highest. From this plot it is again apparent that DCPD content increases both the branching and the elastic behavior of the material.
DCPD impact on crystallinity
DSC and SAXS/WAXS were used to determine the effect that DCPD had on the crystallization behavior of the polypentenamers. DSC was performed with heating ramps of 10 °C min−1 after annealing at −50 °C for 1 h to compare relative degrees of crystallinity (Fig. 8). Annealing for 1 h allowed plenty of time for crystallization to occur, allowing their enthalpy of fusion to be more fairly compared. As expected, the energy required to melt the crystalline domains decreases with higher DCPD content showing a reduced crystallinity in branched samples. Note that the endothermic peak at ∼−40 °C, that occurs in three of the copolymers, is most likely due to the common phenomena of thermal fractionation, which is observed during isothermal crystallization of semicrystalline polymers.37 However further analysis would be required to confirm this postulate.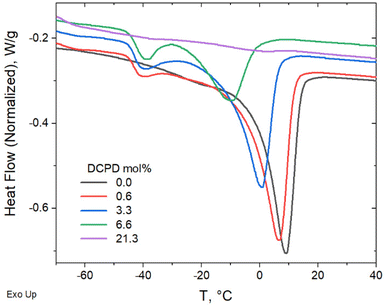 | ||
| Fig. 8 Fusion of enthalpy comparison after 1 hour annealing at −50 °C to allow full crystallization. | ||
To gain further understanding on the crystallization behavior, WAXS was used to measure crystalline content as a function of temperature. In agreement with the DSC data, we observed that at high levels of DCPD, crystallinity is essentially arrested even at very low temperatures. This can be seen from the comparison of 1D scattering plots taken at −60 °C as shown in Fig. 9a. At this temperature, a sharp decrease in crystallinity occurs between 3.3% and 6.6% DCPD content. This indicates a critical DCPD content may exist, above which a drastic reduction in chain mobility occurs that prevents crystallization. Prior to this critical concentration crystallinity appears largely unchanged, exhibiting almost identical crystalline peak positions with only a slight reduction in intensity.
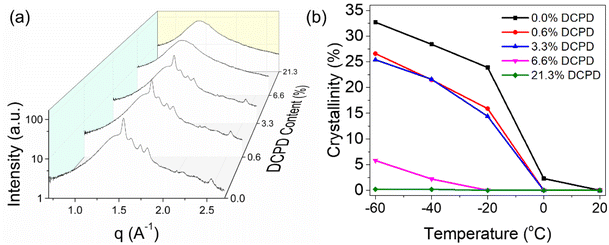 | ||
| Fig. 9 (a) 1D WAXS plot comparison of polymers with varying DCPD content. All scans taken at −60 °C. (b) Effect of DCPD incorporation on crystalline content with respect to temperature. | ||
A quantitative description of % crystallinity is possible using the above data by deconvoluting the peaks and comparing the scattering intensity from crystalline and amorphous source (Fig. 9b). At T > Tm, specifically at 20 °C, all polypentenamers were fully amorphous. At lower temperatures, greater crystallization occurs in samples with less branching. The three samples with the lowest DCPD content underwent rapid crystallization (with respect to temperature) between 0 and −20 °C. As temperature was further decreased, crystallization continued but at a slower rate. Interestingly, nearly all of the differences in crystalline content occurred at the onset of crystallization, between 0 and −20 °C, below this temperature all samples crystallized quite similarly. This suggests that crystallization occurs in two distinct phases. Phase 1, where chain mobility aids in greater crystallization by enabling large scale rearrangement. And phase 2, where chain mobility is restricted due to newly crystalized regions and crystalline growth comes from local rearrangements. A more thorough description of how we calculated degree of crystallinity as well as the 2D raw scattering data for all measurements are included in Fig. S3–S5.†
Using SAXS, we were also able to see changes in crystalline structure. We observed that DCPD content increases the long period (Lp) which represents the total thickness of both amorphous and crystalline domains (Fig. 10). Increases in Lp are likely due to a thickening of the amorphous domain, because DCPD reduced crystallinity. Decreases in Lp at lower temperatures are a result of thermal contraction as well as increased crystallinity. Lp was calculated from Kratky plots and converting the q value at peak intensity to real space. These calculations can be found in Fig. S6–S10.†
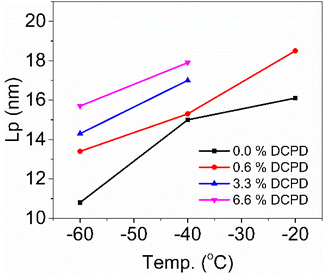 | ||
| Fig. 10 SAXS analysis of long period (Lp), in this case representing the sum of amorphous and crystalline thicknesses. | ||
Discussion
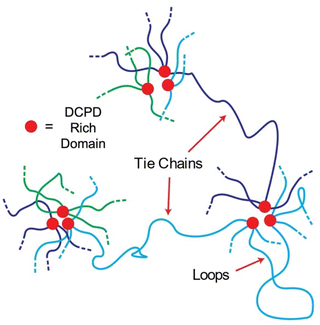
The impact of adding DCPD units is to reduce chain mobility which in turn increases elastic behavior and hinders crystallization. The mechanism by way this happens is less clear as branching density, physical crosslinking, and nanofiller content all increase with DCPD content. Branching may be responsible for the viscosity increase observed in the rheological behavior as similar effects have been reported in polybutadiene38 and polyisoprene.39 But the increase in tensile strength/modulus suggest a different mechanism. Phase separated domains acting as nanofiller is an attractive theory as it is well known that hard domains within a soft matrix stiffen the material. But nanofillers cannot explain the reversible elastic behavior seen at 6.6% DCPD content. To explain this behavior, we propose that phase separation of DCPD-rich sequences forms hard domains that act as anchor points along the backbone (Fig. 11). Even at low DCPD levels (0.6%) a single chain contains ≈50 DCPD units that could aggregate at multiple sites. Following the blue chain of Fig. 11 we can see that polymers could be interconnected through tie chains between multiple phase separated domains. Loops may also form, providing strong entanglements. The ROMP reactivity of the DCPD monomer is higher than the CP monomer so it is likely there are runs of DCPD-rich sequences in the chain (represented in red in Fig. 11). Slow addition of the DCPD monomer was performed to promote random copolymerization, but the DCPD was still added in discrete drops. The semi-blocky structure of the copolymer, its mechanical performance, and melt processability, are strong indications that we created a segmented thermoplastic elastomer.19Conclusion
Copolymerization of CP and DCPD was shown to be a simple way increase the green strength of polypentenamers, as well as be a potential route to creating a new polypentenamer TPE. DCPD incorporation showed a significant influence on the strength, modulus, elasticity, crystallization, and thermal properties. All measurements pointed to the conclusion that DCPD content decreased chain mobility. In DSC measurements this manifested as increased Tg, decreased Tm and Tc, and reduced crystallization kinetics. In rheology measurements DCPD content correlated to higher elasticity, viscosity, and slower relaxation times. In tensile tests DCPD content increased modulus and ultimate stress. And finally, SAXS/WAXS measurements showed that DCPD content decreased crystallinity and increased crystalline spacing.The change in properties with DCPD cannot be explained by branching, nor by a filler effect. This study suggests that physical crosslinking in the phase segregated DCPD-rich domains is responsible for the changes. The first piece of evidence for this claim comes from AFM, which showed increasing hard nanodomains with DCPD content. The second came from tensile testing which showed high elastic recovery in an uncrosslinked system. Neither branching nor fillers could accomplish this.
Author contributions
The manuscript was written through contributions of all authors. All authors have given approval to the final version of the manuscript.Conflicts of interest
The authors declare no competing financial interest.Acknowledgements
This work is supported by ExxonMobil Technology and Engineering Company. X. G. thanks USM for providing start-up funding. D. W. acknowledges NSF through NRT Interface traineeship award #1449999. We also thanks Sarah Morgan and Robson Storey group for their support in material synthesis and characterization. We thank Shuhui Kang for GPC measurements (ExxonMobil Chemical Company).References
- L. R. G. Treloar and D. J. Montgomery, The Physics of Rubber Elasticity, Phys. Today, 1959, 12(2), 32–34, DOI:10.1063/1.3060678
.
-
J. E. Mark and B. Erman, Rubberlike Elasticity: A Molecular Primer, Cambridge University Press, 2nd edn, 2007, vol. 9780521814. DOI:10.1017/CBO9780511541322
.
- K. Urayama, T. Kawamura and S. Kohjiya, Structure-Mechanical Property Correlations of Model Siloxane Elastomers with Controlled Network Topology, Polymer, 2009, 50(2), 347–356, DOI:10.1016/j.polymer.2008.10.027
.
-
H. S. Eleuterio, Polymerization of Cyclic Olefins, U.S. Patent3074918, 1963 Search PubMed
.
- G. Natta, G. Dall'Asta and G. Mazzanti, Stereospecific Homopolymerization of Cyclopentene, Angew. Chem., Int. Ed. Engl., 1964, 3(11), 723–729, DOI:10.1002/anie.196407231
.
- H. Tucker, R. J. Minchak and J. H. Macey, Structure and Properties of Polypentenamer, Polym. Eng. Sci., 1975, 15(5), 360–366, DOI:10.1002/pen.760150508
.
-
M. Mackley, Handbook of Polyolefins, 1995, vol. 60. DOI:10.1016/0923-0467(95)85009-0
.
-
G. Dall'Asta, Preparation and Properties of Polyalkenamers, in Rubber Chemistry and Technology, 1974, pp. 511–596 Search PubMed
.
- B. L. Goodall, W. J. Kroenke, R. J. Minchak and L. F. Rhodes, Novel Catalysts for the Ring–opening Metathesis Polymerization of Norbornene–type Monomers, J. Appl. Polym. Sci., 1993, 47(4), 607–617, DOI:10.1002/app.1993.070470405
.
- D. W. Weller, R. Halbach, B. Rohde, S. Kang, S. Dwivedi, K. D. Mehringer, R. Shankar, R. F. Storey, S. E. Morgan and A. V. Zabula,
et al., Long-Chain Branched Polypentenamer Rubber: Topological Impact on Tensile Properties, Chain Dynamics, and Strain-Induced Crystallization, ACS Appl. Polym. Mater., 2021, 3(5), 2498–2506, DOI:10.1021/acsapm.1c00083
.
-
J. Roovers, Progress in the Branched Architectural State, in Dendrimers and Other Dendritic Polymers, 2002, vol. 1, pp. 67–90. DOI:10.1002/0470845821.ch3
.
-
R. Edam, Comprehensive Characterization of Branched Polymers, 2013 Search PubMed
.
- R. Popli and L. Mandelkern, Influence of Structural and Morphological Factors on the Mechanical Properties of the Polyethylenes, J. Polym. Sci., Part B: Polym. Phys., 1987, 25(3), 441–483, DOI:10.1002/polb.1987.090250301
.
- B. Crist, C. J. Fisher and P. R. Howard, Mechanical Properties of Model Polyethylenes: Tensile Elastic Modulus and Yield Stress, Macromolecules, 1989, 22(4), 1709–1718, DOI:10.1021/ma00194a035
.
- A. A. Askadskii and O. V. Kovriga, Effect of Branching on the Physical Characteristics of Polymers, Polym. Sci. U.S.S.R., 1991, 33(9), 1821–1831, DOI:10.1016/0032-3950(91)90019-M
.
- B. E. Guth, Theory of Filler Reinforcement, J. Appl. Phys., 2011, 16(20), 1945 Search PubMed
.
- J. Fröhlich, W. Niedermeier and H. D. Luginsland, The Effect of Filler-Filler and Filler-Elastomer Interaction on Rubber Reinforcement, Composites, Part A, 2005, 36(4), 449–460, DOI:10.1016/j.compositesa.2004.10.004
.
-
C. M. Roland, Reinforcement of Elastomers, in Ref. Modul. Mater. Sci. Mater. Eng, 2016, pp. 1–9 Search PubMed
.
- R. J. Spontak and N. P. Patel, Thermoplastic Elastomers: Fundamentals and Applications, Curr. Opin. Colloid Interface Sci., 2000, 5(5–6), 333–340, DOI:10.1016/s1359-0294(00)00070-4
.
-
A. V. Zabula, C. R. Lopez-Barron, A. A. Galuska, X.-D. Pan, M. L. Shiramizu, Y. Yang, M. K. Davis, L. Luo, S. J. Mattler and S. Kang, Polymers prepared by Ring Opening Metathesis Polymerization, WO2021/113503, 2021 Search PubMed
.
- R. L. Halbach, T. Dupper, C. R. López-Barrón, S. Kang, S. J. Mattler, L. Luo and A. V. Zabula, Synthesis, Structural Studies, and Application of Aluminum Aryloxides for Ring-Opening Metathesis Polymerization, Organometallics, 2022, 41(17), 2425–2431, DOI:10.1021/acs.organomet.2c00221
.
-
L. Luo, E. J. Blok, A. A. Galuska, A. Jain, A. V. Zabula and Y.-H. Lin, Metathesis catalyst system for polymerizing cycloolefins, WO2020/061277, 2020 Search PubMed
.
-
V. Dragutan, A. Demonceau, I. Dragutan and E. S. Finkelshtein, Green Metathesis Chemistry: Great Challenges in Synthesis, Catalysis and Nanotechnology, Springer, 2010 Search PubMed
.
- J. Ilavsky, Nika: Software for Two-Dimensional Data Reduction, J. Appl. Crystallogr., 2012, 45(2), 324–328, DOI:10.1107/S0021889812004037
.
- F. Zhang, J. Ilavsky, G. G. Long, J. P. G. Quintana, A. J. Allen and P. R. Jemian, Glassy Carbon as an Absolute Intensity Calibration Standard for Small-Angle Scattering, Metall. Mater. Trans. A, 2010, 41(5), 1151–1158, DOI:10.1007/s11661-009-9950-x
.
- G. Matsuba, C. Ito, Y. Zhao, R. Inoue, K. Nishida and T. Kanaya, In Situ Small-Angle X-Ray and Neutron Scattering Measurements on a Blend of Deuterated and Hydrogenated Polyethylenes during Uniaxial Drawing, Polym. J., 2013, 45(3), 293–299, DOI:10.1038/pj.2012.143
.
- N. F. Martinez, S. Patil, J. R. Lozano and R. Garcia, Enhanced Compositional Sensitivity in Atomic Force Microscopy by the Excitation of the First Two Flexural Modes, Appl. Phys. Lett., 2006, 89(15), 1–4, DOI:10.1063/1.2360894
.
- R. Garcia and R. Proksch, Nanomechanical Mapping of Soft Matter by Bimodal Force Microscopy, Eur. Polym. J., 2013, 49(8), 1897–1906, DOI:10.1016/j.eurpolymj.2013.03.037
.
- Y. Yang, E. Lafontaine and B. Mortaigne, NMR Characterisation of Dicyclopentadiene Resins and Polydicyclopentadienes, J. Appl. Polym. Sci., 1996, 60(13), 2419–2435, DOI:10.1002/(SICI)1097-4628(19960627)60:13<2419::AID-APP14>3.3.CO;2-M
.
- P. Brant, C. J. Ruff and T. Sun, Effect of Tacticity on the Dilute Solution Coil Dimensions of Poly(α-Olefin)S, Macromolecules, 2005, 38(16), 7181–7183, DOI:10.1021/ma050496a
.
- W. G. Perkins, N. J. Capiati and R. S. Porter, The Effect of Molecular Weight on the Physical and Mechanical Properties of Ultra–drawn High Density Polyethylene, Polym. Eng. Sci., 1976, 16(3), 200–203, DOI:10.1002/pen.760160313
.
- Y. Y. Chen, T. P. Lodge and F. S. Bates, Entropically Driven Phase Separation of Highly Branched/Linear Polyolefin Blends, J. Polym. Sci., Part B: Polym. Phys., 2000, 38(22), 2965–2975, DOI:10.1002/1099-0488(20001115)38:22<2965::AID-POLB120>3.0.CO;2-A
.
- H. Tanaka, Viscoelastic Phase Separation, J. Phys.: Condens. Matter, 2000, 12, 15, DOI:10.1088/0953-8984/12/15/201
.
- T. G. Fox, Influence of Diluent and of Copolymer Composition on the Glass Temperature of a Polymer System, Bull. Am. Phys. Soc., 1956, 1, 123 CAS
.
- Q. Beuguel, E. Kirillov, J.-F. Carpentier and S. M. Guillaume, Upgrading Toughness and the Glass Transition Temperature of Polydicyclopentadiene upon Addition of Styrene–Ethylene–Butylene–Styrene Thermoplastic Elastomer, ACS Appl. Polym. Mater., 2022, 4(4), 2251–2255, DOI:10.1021/acsapm.1c01803
.
- S. Trinkle, P. Walter and C. Friedrich, Van Gurp-Palmen Plot II - Classification of Long Chain Branched Polymers by Their Topology, Rheol. Acta, 2002, 41(1), 103–113, DOI:10.1007/s003970200010
.
- A. J. Müller and M. L. Arnal, Thermal Fractionation of Polymers, Prog. Polym. Sci., 2005, 30(5), 559–603, DOI:10.1016/j.progpolymsci.2005.03.001
.
- L. J. Kasehagen, C. W. Macosko, D. Trowbridge and F. Magnus, Rheology of Long–chain Randomly Branched Polybutadiene, J. Rheol., 1996, 40(4), 689–709, DOI:10.1122/1.550732
.
- W. W. Graessley, T. Masuda, E. L. Hoovers and N. Hadjichristidis, Rheological Properties of Linear and Branched Polyisoprene, Macromolecules, 1976, 9(1), 127–141, DOI:10.1021/ma60049a025
.
Footnote |
| † Electronic supplementary information (ESI) available. See DOI: https://doi.org/10.1039/d3lp00076a |
| This journal is © The Royal Society of Chemistry 2023 |

