 Open Access Article
Macroporous hydrogels for soil water retention in arid and semi-arid regions†
Ryan
Zowada
a and
Reza
Foudazi
 *b
*b
aDepartment of Chemical and Materials Engineering, New Mexico State University, Las Cruces, New Mexico 88003, USA
bSchool of Sustainable Chemical, Biological, and Materials Engineering, University of Oklahoma, Norman, Oklahoma 73069, USA. E-mail: rfoudazi@ou.edu
First published on 4th September 2023
Abstract
High water loss in arid and semi-arid regions makes it difficult for plants and microorganisms to thrive, which then prohibits generating organic matter in the soil. We hypothesize that the implementation of macroporous hydrogels in soil can enhance water retention and irrigation efficiency through improved uptake and release kinetics compared to bulk hydrogels. Water is mainly held in the cavities of the macroporous morphology making it more accessible to plants. The improved water kinetics can lead to better crop yield and improved soil health when water scarcity is a significant issue. In this work, macroporous acrylate-based hydrogels are fabricated using the high internal phase emulsion (HIPE) templating method. The solid hydrogel is incorporated into the soil as a powder to measure its influence over soil-water kinetics. The resulting hydrogels have an average porosity of >85% and an average void size of <3 μm. The macroporous hydrogel shows a ∼700 wt% increase in water kinetics in less than 1 minute of water absorption and a water release rate 3.5 times higher than the bulk hydrogel. The addition of the porous hydrogel to sandy and sandy loam soil enhances water retention but lowers plant available water due to the higher water potentials.
1 Introduction
Globally, 70% of the consumed water supply is used for agricultural purposes.1 For the United States, this consumption is about 80%.2 In addition, future freshwater supplies are of concern due to the impending threat of climate change and an increase in food demand due to the growing world population, which is estimated to rise 60% by 2050.3 Therefore, crop yield must continue to increase despite the risk of water scarcity. In particular, water use efficiency (WUE) in agriculture should focus on irrigation techniques due to this widespread use in areas with high water loss.An ongoing problem is high water loss due to typical environment (e.g., high temperatures and low humidity) and soil conditions (e.g., high drainage loss and low organic matter content) in arid and semi-arid climates. With high water loss, it is difficult for plants and microorganisms to thrive, which then prohibits generating organic matter in the soil. There are many practical solutions to improve sandy soil water holding content, such as composting,4,5 biochar,6,7 mulching,8,9 cover crops,10 and no-till practices;8 however, many of these have an economic burden for agricultural practices or require extended periods to improve soil health.
Superabsorbent polymers (SAPs) are a class of hydrogels that can act as an immediate source of water retention in soil. Hydrogels are crosslinked hydrophilic polymer chains that expand when absorbing water through osmotic potential. Typically, the hydrophilic polymer chains are soluble in water due to the presence of functional groups, such as SO3−, NH2−, OH− or COO−;11 however, when crosslinked, they can retain the shape and hold water (Fig. S1†).
Hydrogels hold water by three mechanisms: (1) free water, which is located in the polymer mesh and acts similar to bulk water; (2) primary bound water, which strongly interacts with the hydrogel's functional groups by hydrogen bonding; and (3) secondary bound water, which interacts with the bound water, but not the functional groups (Fig. S2†).12 Free water can be removed easily by small external forces such as pressure, temperature, or energy, whereas bound water requires much stronger external forces to break hydrogen bonds. In addition, crosslink density of hydrogels influences their swelling ability, i.e., a higher crosslinked polymer network results in lower absorption. The functional groups and crosslinking density can be used to fine-tune and tailor the properties of hydrogels for various applications.
Since SAPs have lightly crosslinked network (e.g., 100![[thin space (1/6-em)]](https://www.rsc.org/images/entities/char_2009.gif) :
:![[thin space (1/6-em)]](https://www.rsc.org/images/entities/char_2009.gif) 1 monomer-to-crosslinker ratio), they can potentially absorb over 100 times their mass in water, making them an attractive candidate for water storage applications.11,13 It has been suggested that SAPs act as a water reservoir near the root zone, absorbing water during irrigation and desorbing it to the plant during water-stressed times. They have shown significant improvements in terms of water retention and crop yield for inferior soil. Montesano et al. showed an increase in the water holding capacity of sandy soil and perlite substrate when implementing cellulose-derived SAPs, which increased the growth of cucumber and basil plants.14 Yang et al. showed polyacrylamide SAPs increase soil water holding stability under temperature fluctuations and crop yield of maize in saline impacted soil for semi-arid climates.15 Hu et al. also showed an increase in water use efficiency and maize crop yield when incorporating a polyacrylamide SAP and fertilizer amendment to the soil under water-stressed conditions.16 While there is evidence that SAPs can improve agricultural conditions, a commonly cited issue is the improvements required to make them safe and economical.
1 monomer-to-crosslinker ratio), they can potentially absorb over 100 times their mass in water, making them an attractive candidate for water storage applications.11,13 It has been suggested that SAPs act as a water reservoir near the root zone, absorbing water during irrigation and desorbing it to the plant during water-stressed times. They have shown significant improvements in terms of water retention and crop yield for inferior soil. Montesano et al. showed an increase in the water holding capacity of sandy soil and perlite substrate when implementing cellulose-derived SAPs, which increased the growth of cucumber and basil plants.14 Yang et al. showed polyacrylamide SAPs increase soil water holding stability under temperature fluctuations and crop yield of maize in saline impacted soil for semi-arid climates.15 Hu et al. also showed an increase in water use efficiency and maize crop yield when incorporating a polyacrylamide SAP and fertilizer amendment to the soil under water-stressed conditions.16 While there is evidence that SAPs can improve agricultural conditions, a commonly cited issue is the improvements required to make them safe and economical.
Despite their high-water absorption, there are several issues with current hydrogels designed for agricultural purposes. Salts in saline soils or irrigation water interact strongly with the functional groups on hydrogels, significantly hindering their water absorption. Another issue with current marketed SAPs is that they are not environmentally friendly. Typically, the SAPs are petroleum-derived acrylate or acrylamide polymers, meaning they do not decompose in the soil over time but have shown to lose functionality.17–19 Cost is also a significant drawback for current SAPs since the large amount required for agriculture applications can typically outweigh the cost of irrigation loss. Further innovations to hydrogels must be implemented to be an efficient and cost-effective water retention method.
We hypothesize that many of current issues for SAPs application in soil can be resolved by imbedding an interconnected macroporous structure in hydrogels. Increasing the porosity would reduce the cost of the material and increase the available water content by holding water in macropores (Fig. 1). The increase in porosity could also improve water uptake under saline conditions by changing the dominant water sorption mechanism from osmotic force to capillary force. Macroporous hydrogels can also provide an economical avenue for bioderived hydrogels with lower water absorbing capacity compared to synthetic SAPs. The cost-effectiveness of macroporous hydrogels would be dependent on the fabrication method.
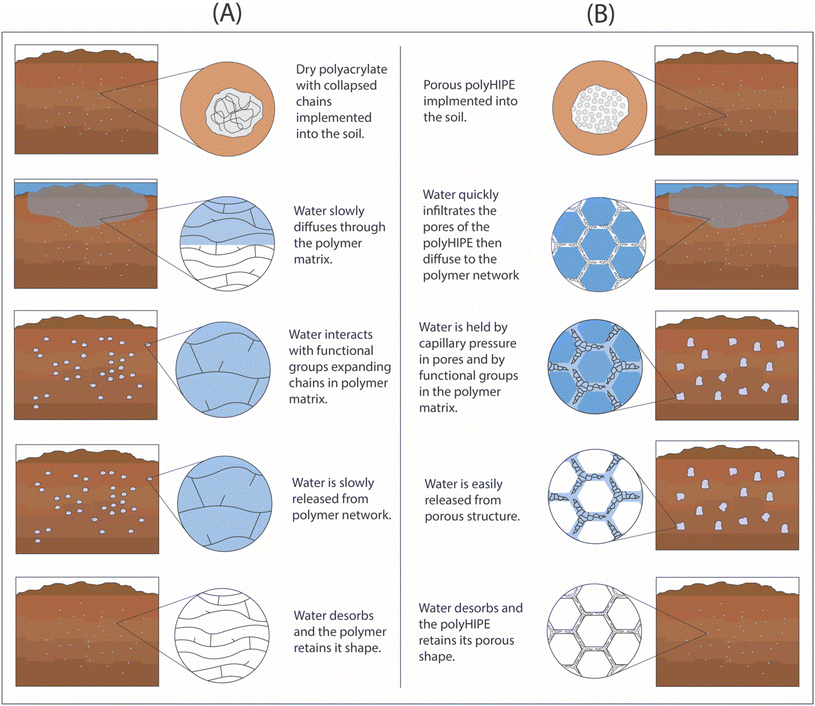 | ||
| Fig. 1 Schematic comparison of water uptake in soil in the presence of SAPs: (A) non-porous hydrogel, and (B) macroporous hydrogels. | ||
There are many methods for producing porous hydrogels, such as emulsion-templating,20 gas formation,21,22 cryogelation,12,23 and mechanical frothing.24 However, the fabrication can be costly (i.e., cryogelation has high energy costs) or difficult to control the resulting structure (e.g., gas formation foaming has low interconnectivity and no control over bubble size generation),25 so the chosen method needs to be a scalable and reproducible method for agricultural purposes.
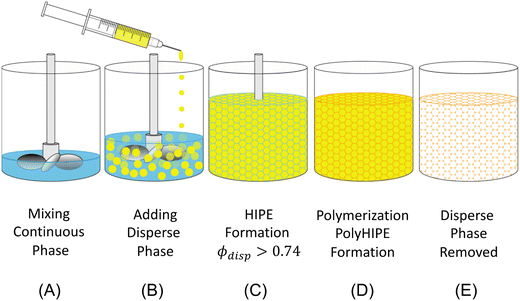
HIPE-templating is a reliable and scalable method for creating interconnected macroporous polymers. HIPE-templating is an emulsion-templating method where the dispersed phase is >74% of the total emulsion volume, resulting in the jamming of droplets.26 The jammed emulsions have a thin interdroplet layer, where interconnecting windows form when the continuous phase is polymerized and the droplet phase is removed (Fig. 2).27
Although HIPE-templating method requires a sacrificial template (the droplet phase), it can be cost-effective and tunable. The droplet phase can be recycled through an evaporation–condensation cycle during the removal, and the mixing process can alter the resulting void size and distribution. HIPE templating is an effective method for macroporous hydrogel templating for applications ranging in biomedical,28,29 membranes,30 heavy metal removal,31,32 energy storage,33,34 and dye removal.35 The resulting interconnected macroporous structure provides a superb morphology for high water uptake in the hydrogel.
Dense hydrogels have been shown to improve both water retention and crop yield in practice. This work aims to evaluate the benefits of applying a templating method to create a macroporous hydrogel as an improved hydrogel amendment for soil water retention. The porosity of a hydrogel would not only reduce the economic burden on its implementation but also hypothetically improve the irrigation efficiency of these hydrogels. This method could also be the solution for many biodegradable hydrogels that have both inferior water uptake capabilities and higher economic cost of production than synthetic ones. Furthermore, macroporous hydrogels can potentially solve many other possible challenges common for sandy soils (e.g., nutrient and pesticide loading, water uptake inhibition due to salt concentration, and reducing high hydraulic conductivity). In this article, the improvements made by the increased porosity of the hydrogels are discussed in terms of water uptake, water release kinetics, and effect of soil-water retention.
2 Materials and methods
2.1 Materials
The continuous phase contained deionized water (50 wt%), 2-hydroxyethyl methacrylate (HEMA, purchased from Sigma-Aldrich, 99%) as the monomer (24 wt%), N′,N-methylene-bis-acrylamide (MBA, purchased from Sigma-Aldrich, >99.5%) as crosslinker (5 wt%), Pluronic F68 (PF68, provided by BASF) as the surfactant (20 wt%), and ammonium persulfate (APS, purchased from Sigma-Aldrich, 98%) as the free radical initiator (1 wt%). Redox polymerization was used, in which the initiation catalyst was N,N,N′,N′-tetramethylethylenediamine (TEMED, purchased from Sigma-Aldrich, >99.5%) (1 wt% excess). Cyclohexane (purchased from Parmco-Aaper, 99.8%) was used for the dispersed phase. Two types of soils (SEM images of soil are provided in Fig. S3†) were used in this study, a sandy soil (sand% = 97%, silt = 1%, clay = 2%, pH = 7.6, EC = 544 μs cm−1, ρb,soil = 1.454 g cm−3) and a sandy loam soil (sand% = 67%, silt = 29%, clay = 4%, pH = 7.5, EC = 668 μs cm−1, ρb,soil = 1.305 g cm−3), where EC stand for electrical conductivity. The type of soil is denoted either “SL” for sandy loam or “SS” for sandy soil. Whereas the type of amendment is denoted either as “B” for bulk non-porous hydrogel or “H” for HIPE-templated porous hydrogel. They are combined to indicate which amendment and soil is used, i.e., sandy soil with HIPE-templated hydrogel is “SS_H”. When needed, the amount of amendment in the soil is denoted by the value of its weight percent in parentheses, e.g., 1 wt% bulk hydrogel added to sandy loam is denoted as SL_B(1.0).2.2 PolyHIPE templating
PolyHEMA was chosen as the material since it is biocompatible36 and was found to have a highly reproducible polyHIPE morphology through analyzing multiple batches. In addition, the monomer-to-crosslinker mass ratio was kept at 5![[thin space (1/6-em)]](https://www.rsc.org/images/entities/char_2009.gif) :
:![[thin space (1/6-em)]](https://www.rsc.org/images/entities/char_2009.gif) 1 to reach swelling ratios of biomass-derived hydrogels rather than typical SAP hydrogels. This comparison further determines the applicability of biodegradable hydrogel foams, which have a low swelling ratio for agricultural purposes. This ratio also reduces the potential influences of other factors that can inhibit swelling, such as pH and saline concentration of water.
1 to reach swelling ratios of biomass-derived hydrogels rather than typical SAP hydrogels. This comparison further determines the applicability of biodegradable hydrogel foams, which have a low swelling ratio for agricultural purposes. This ratio also reduces the potential influences of other factors that can inhibit swelling, such as pH and saline concentration of water.
The sample size of the HIPE was 500 ml, and the oil phase (cyclohexane) was added by hand at 20 ml increments until 75% of the total emulsion volume was cyclohexane. The HIPE was mixed at 500 RPM to ensure proper emulsification. A mixer with three blades was employed to ensure good mixing throughout the large volume. Due to the cyclohexane volatility, the total weight of emulsion was measured after dispersion to ensure a significant amount of cyclohexane had not evaporated. The TEMED was added by directly injecting the solution into the emulsion to prevent any contact with air, then dispersed by hand using a microspatula. The emulsion surface was covered (to prevent oxygen inhibition at the surface) and left at room temperature to polymerize for 24 h. The sample was sectioned and dried under a fume hood until there was no change in mass. In an actual application, cyclohexane can be recovered and reused for HIPE preparation.
2.3 Soil sample preparation
The soil was sieved so the soil particle diameters were <2 mm and dried at 105 °C to remove residual water. The HIPE and bulk hydrogels were immersed in liquid nitrogen and ground into a powder, and sieved to reach particle diameters <2 mm. The hydrogel powder was added to the soil in a container that was continuously shaken for 10 min to ensure homogeneously dispersed. The packing density of the soil and hydrogel was measured respectively so that the hydrogel and soil could be added by mass rather than inconsistent volume ratios. In previous reports, hydrogel addition was kept below 5 wt%.13,14,37–40 Due to potential cost of implementation on an agricultural scale, however, the hydrogel addition in this work was kept to 0, 1 and 2 wt%.2.4 Porosity
The porosity of polyHIPE was measured by weighing the initial mass of a sample and then immersing it in melted soy wax to create a thin hydrophobic barrier preventing water sorption. The sealed sample was then immersed in a graduated cylinder to measure the displacement volume using image analysis through AM Scope software. Finally, the density ratio of the foam to the non-porous bulk material was used to calculate the porosity of the samples.2.5 Morphology analysis
PolyHIPE samples were frozen in liquid nitrogen and crushed. The surfaces of broken pieces were then sputter coated using a gold filament in a Denton Desk IV Sputter Coater and analyzed with a Hitachi S-3400N Type II scanning electron microscope (SEM). The images were analyzed using AM Scope software to measure void and window diameters (N = 300 per image).2.6 Water uptake analysis of hydrogels
A buffer solution was used to adjust the pH level at pH = 4, 7, and 10. To study the effect of salt, we used two different saline solutions containing NaCl or CaCl2 at 0.9 wt% concentration. DI water was also compared to the saline and neutral buffer to compare the absence of competing ions. The pH and EC of the solutions were measured using a Hach HQ40d portable pH and ion conductivity meter. A second-order rate kinetics model was applied to quantify the rapid water uptake of the porous hydrogels under various conditions: | (1) |
2.7 Drying kinetics of hydrogels
Hydrogel powders were placed in aluminum tins where water was added to reach their respected saturated water content. Two sets of samples were allowed to dry for over 20 h under different temperatures in a convective oven at 25 °C and 40 °C. The samples were weighed at various times until there was no longer a change in mass.2.8 Capillary rise testing
The capillary rise of the soil samples was conducted using a 50-N load cell attachment to a Shimadzu Autograph AGS-X tensile tester. Soil samples were poured into glass tubes with similar packing densities. The glass tubes had filter paper adhered to one end and were attached to the load cell arm of the tester. The tubes were lowered into a liquid reservoir until the surface of the sample holder touched the liquid surface (Fig. S4†). The change in force is recorded as the liquid rises in the soil sample and is then converted to mass.The resulting data was modeled using the Lucas–Washburn (LW):41–43
 | (2) |
2.9 Water retention of amended soil
Soil water retention was measured using a soil moisture pressure plate apparatus recording the retained water under pressures from 0.3–15 bar. The soil cores were initially saturated for 24 h in DI water and then measured for saturated water content. The soil water content was measured gravimetrically (θg), and volumetric water content (θv) was calculated. After the final reading (15 bar), the soil cores were placed in a drying oven at 105 °C for 24 hours, and their dry weight was measured. The soil water characteristic curve was determined by the van Genuchten model defined as follows:44 | (3) |
3 Results and discussion
3.1 Hydrogel morphological characterization
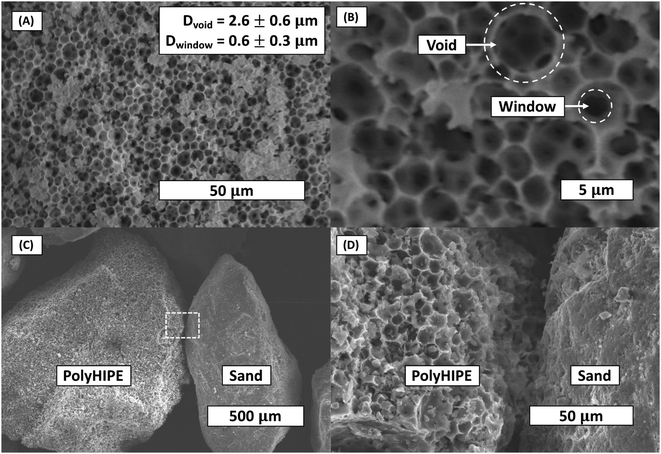
The density of the bulk polyHEMA hydrogel (B) and polyHEMA polyHIPE (H) was found to be 1.107 and 0.117 g cm−3, respectively. Thus, the polyHIPE porosity was calculated to be 87%. This porosity is higher than the emulsion volume fraction (75% oil-to-water) due to the evaporation of water in the continuous phase during drying. The scanning electron microscope images of polyHIPE showed the typical extremely porous and interconnected structure (Fig. 3). The average void and window diameters were measured at 2.6 μm and 0.6 μm, respectively. The imaging was applied to three separate batches of polyHIPE, showing little void and window size variation.3.2 Water uptake of hydrogels
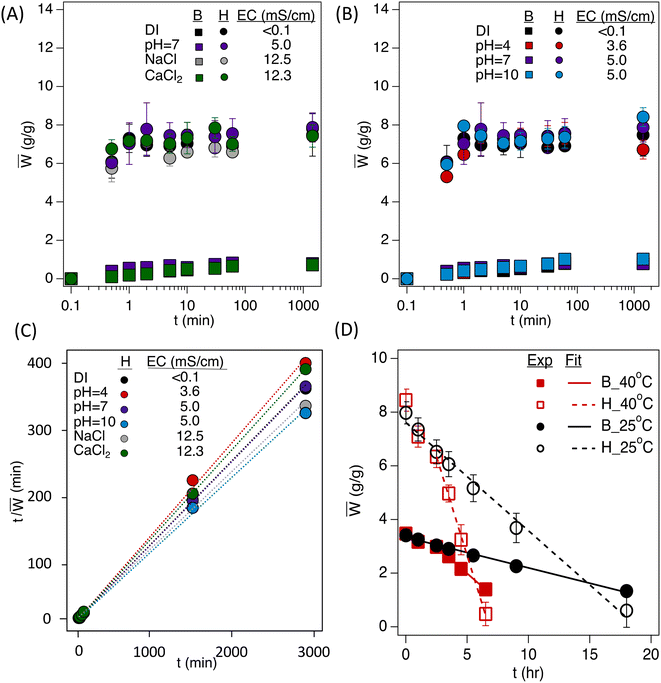
The water uptake of the hydrogels was conducted over 24 h to find equilibrium water uptake (Fig. 4A–C). The water uptake data for porous hydrogels were fit with the second-order kinetics model (eqn (1) and Table 1) to calculate the swelling ratio at equilibrium, W∞, and the kinetic rate constant, k.| W ∞ (g g−1) | k (s−1) | R 2 | |
|---|---|---|---|
| 7.96 | 2.87 × 10⁻⁴ | 0.99 | |
| pH = 4 | 7.15 | 4.73 × 10⁻⁴ | 0.99 |
| pH = 7 | 7.98 | 1.06 × 10⁻³ | 0.99 |
| pH = 10 | 8.91 | 2.40 × 10⁻⁴ | 0.99 |
| NaCl | 8.57 | 1.63 × 10⁻⁴ | 0.99 |
| CaCl2 | 7.43 | 7.63 × 10⁻³ | 0.99 |
The bulk polyHEMA hydrogels show a slow water uptake during the immersion until reaching equilibrium. In contrast, the polyHIPE shows a significant jump in water uptake within the first minute of immersion. The hydrogels were tested under various pH levels to determine their efficiency under multiple conditions. The pH buffer solutions did not significantly differ in the initial hour of water uptake. However, there is a slight difference when comparing ion levels for water uptake. Typically, when salts are introduced to water, hydrogel swelling significantly decreases due to the interaction of the salt ions with the hydrogel's functional groups that typically interact with water. The electrical conductivity and ion type did not significantly influence the water uptake of macroporous or non-porous hydrogels, likely due to the higher crosslinking of the hydrogels in this work (5![[thin space (1/6-em)]](https://www.rsc.org/images/entities/char_2009.gif) :
:![[thin space (1/6-em)]](https://www.rsc.org/images/entities/char_2009.gif) 1 monomer-to-crosslinker; in contrast to typical SAPs, which are lightly crosslinked). It should also be considered that most of the water uptake for the polyHIPE is due to capillary action, so the salt concentration influencing the osmotic potential of the hydrogel is minimized. In addition, the negligible influence over various conditions is evident from the second-order kinetics model fitting (Table 1), where the equilibrium swelling ratio under different conditions ranges ±10% compared to equilibrium in DI water.
1 monomer-to-crosslinker; in contrast to typical SAPs, which are lightly crosslinked). It should also be considered that most of the water uptake for the polyHIPE is due to capillary action, so the salt concentration influencing the osmotic potential of the hydrogel is minimized. In addition, the negligible influence over various conditions is evident from the second-order kinetics model fitting (Table 1), where the equilibrium swelling ratio under different conditions ranges ±10% compared to equilibrium in DI water.
3.3 Drying kinetics of hydrogels
The hydrogel powders were saturated to their respective saturated water content (∼3.5 g g−1 for bulk powder and ∼8 g g−1 for polyHIPE powder) for the drying experiments. There is a linear trend to the change in water content as the samples dry (Fig. 4D). The rate of change in water content (Ẇ) for the bulk powder was found to be −410.4 s−1 and −1440 s−1 at 25 °C and 40 °C, respectively, whereas the rate of change in water content for the polyHIPE powder was found to be −1450.8 s−1 and −5320.8 s−1 at 25 °C and 40 °C, respectively. The linear fitting of water loss shows an increase in the rate when increasing the temperature (3.5 times higher) and an increase in rate loss when increasing the porosity (3.5 times higher). The increase in mass loss for the polyHIPE is explained by its increased free water content in its macroporous structure. This high release of water from the polyHIPE indicates a higher amount of accessible water for plants if implemented in soil.3.5 Hydrogel influence on capillary rise in soil
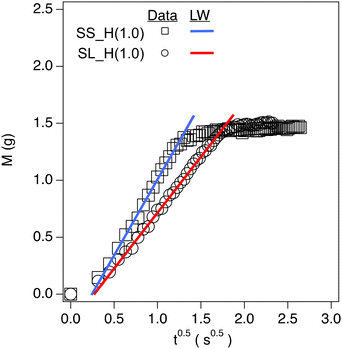
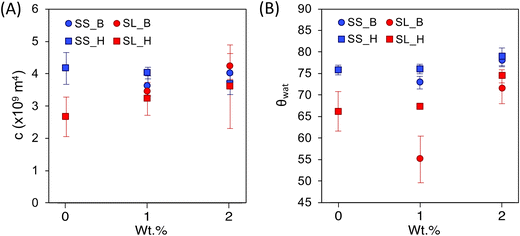
The capillary rise data for soil containing hydrogels shows three distinct regions: (1) an inertial action (between the first and second data points) due to the filter paper's capillary action, (2) the linear region of the data that is the capillary action of the soil matrix, and (3) a plateau region which is the saturation point of the soil. The linear region of the data is modeled using the Lucas Washburn equation (eqn (2) and Fig. 5).2-Way ANOVA tests show a significant difference in capillary rise parameters between sandy and sandy loam soil samples. There is an increase in c for SL as the hydrogel content increases (Fig. 6 and Table S1†), in terms of statistical significance. This value is directly proportional to the fluid uptake (of hexane), indicating an increase in porosity. For polyHIPE, the increase in porosity is likely due to macroporous structure. In contrast, the increase in porosity for bulk hydrogel is likely due to the addition of particles of different sizes and nature to the soil.
For the contact angle, there is an increase as the hydrogel content increases (excluding SL_H(1.0)), indicating a decrease in soil hydrophilicity. This change is likely due to the hydrogel having osmotic and capillary preferences, inhibiting the wetting front from advancing until the hydrogel is saturated (Fig. S5†). The similarities between the SS samples packing factor, c, are likely due to a larger void size in the soil that requires a higher addition to offset. However, there is a trend in the contact angles, showing an increase in contact angle compared to the control SS0 (excluding SS_B(1.0)). As previously explained, this observed reduction in hydrophilicity is due to osmotic and capillary preferences of hydrogels in soil. Due to the lack of significant difference between the macroporous and non-porous hydrogels, it can be assumed that the particle size distribution is a major determining factor in hydrogels influencing the capillary action of the soil.
3.4 Soil-water characterization of amended soil
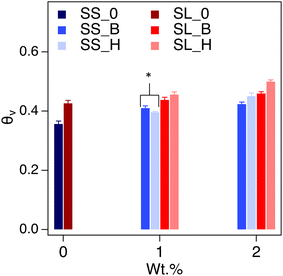
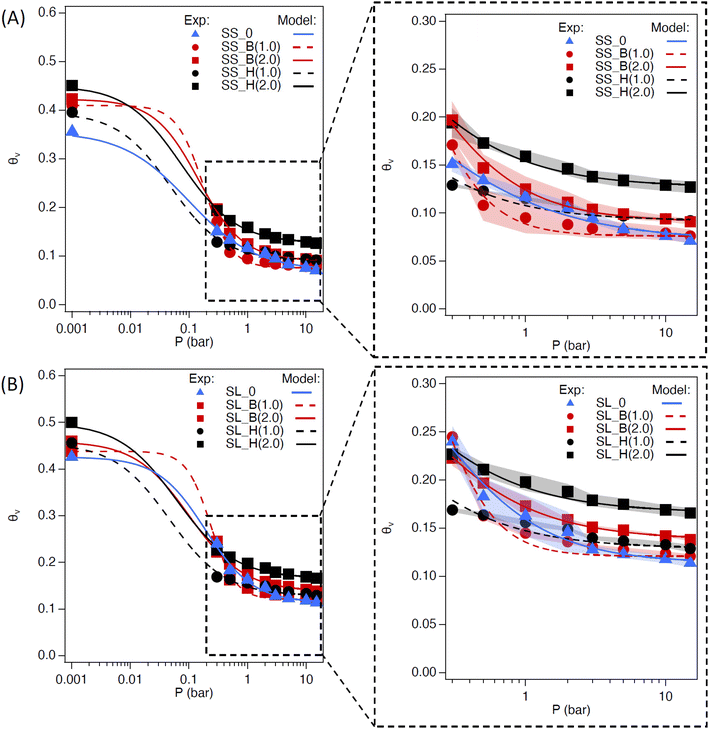
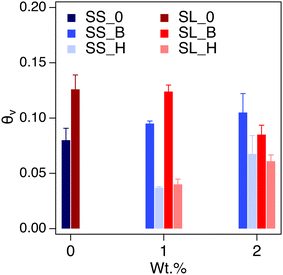
The saturated water content (SWC) of the amended soil slightly increased by 2–4 vol% (Fig. 7). The increase was more pronounced for the sandy soil than the sandy loam due to the lower porosity of the former. The impact of saturated water content increases as the concentration of the additive increases, as expected. The saturated water content of polyHIPE was slightly higher than the bulk hydrogel for most samples due to their higher water uptake capabilities.The complete modeling of the soil water characteristic curves (SWCC) shows different behavior of water release, between saturation and field capacity, depending on soil type (Fig. S6†). The SWCCs were fitted using the van Genuchten model (Table 2 and Fig. 8), where the fitting parameters α and n are solved. These values determine the shape of the curve, indicating water release and retention across the SWC and plant available water (PAW), as shown in Fig. 9.
| θ s | θ r | α | n | R 2 | |
|---|---|---|---|---|---|
| SL_0 | 0.425 | 0.117 | 5.238 | 2.068 | 0.996 |
| SL_B(1.0) | 0.438 | 0.121 | 4.248 | 3.092 | 0.994 |
| SL_B(2.0) | 0.456 | 0.141 | 9.765 | 1.937 | 1.000 |
| SL_H(1.0) | 0.447 | 0.131 | 21.478 | 1.917 | 0.995 |
| SL_H(2.0) | 0.491 | 0.169 | 16.102 | 1.882 | 0.998 |
| SS_0 | 0.348 | 0.077 | 10.089 | 1.762 | 0.996 |
| SS_B(1.0) | 0.410 | 0.076 | 5.619 | 2.874 | 0.997 |
| SS_B(2.0) | 0.422 | 0.093 | 6.868 | 2.143 | 0.998 |
| SS_H(1.0) | 0.389 | 0.093 | 21.010 | 1.955 | 0.997 |
| SS_H(2.0) | 0.445 | 0.129 | 13.587 | 1.919 | 0.999 |
Sandy soil showed higher water retention when hydrogels were present. In contrast, the control sandy loam soil had about the same water retention during the initial water release, regardless of amendment concentration. The water release is quantified by the difference in n values of the SWCC fitting (Table 2). The water content for the amended soil increases across the PAW range (0.3 to 15 bar) as the amount of hydrogel increases. The polyHIPE additive shows a higher water content, across all pressures (indicative of higher α values for polyHIPE amendments, Table 2), compared to the bulk hydrogel (indicative of higher n values for bulk amendments, Table 2) as expected. There is a higher water release at 0 to 0.3 bar from the 1 wt% hydrogel (macroporous and non-porous) amended soils compared to their respective control soils, but higher water content near the permanent wilting point (PWP, 15 bar). The higher water release at low pressure is likely due to increased free water available in bulk and polyHIPE hydrogels. The higher water content at high pressure is likely due to bound water interacting by hydrogen bonding, which is difficult to break. This higher water content is likely the reason for the 2 wt% amended soil's higher water retention at higher pressures. The PAW content shows an increase in available water for sandy loam soil compared to sandy soil due to the higher porosity of the sandy loam soil (Fig. 9).
The PAW increases with bulk polyHEMA hydrogel addition for sandy soil but decreases for sandy loam. PAW increase is likely due to the competition between the capillary action of SL soil and the osmotic pressure of hydrogel. The bulk and polyHIPE hydrogel addition minimally impact the field capacity of the SL soil. However, as the bulk hydrogel content in soil increases, its hygroscopicity near permanent wilting point reduces the PAW. There is a significant reduction in PAW when polyHIPE hydrogels are introduced but increases as their wt% increases. This is despite the higher water content of the polyHIPE amended soil across the PAW pressure range and higher saturation water content. The reduction in PAW by polyHIPE amendment could be due to the mechanism of water release by pores. PolyHIPEs have a higher free water content in their macropores, so there is a large initial water release when the pressure is increased from 0 to 0.3 bar. Due to their higher surface area (in comparison to the bulk hydrogel), there is a potentially higher amount of bound and intermediate water being held hygroscopically by the polyHIPE hydrogel, resulting in high water content outside the PAW range. While the increase in porosity can reduce drainage loss through high capillary action, it may not completely increase the PAW in the soil due to high initial water release and osmotic potential. However, this potentially can be overcome by altering the formulation for vairous resulting properties, such as changing the monomer to a more hydrophilic nature or decreasing crosslink density to increase water uptake and increase hydrogel elasticity.
4 Conclusion
This work aimed to understand the influence that hydrogel porosity can have on water retention for plants and microorganisms in sandy-type soils. The hypothesis was that the porosity of the hydrogel would increase the amount of free water, thus, making the water more accessible to plants and less susceptible to drainage loss. We compared a porous and non-porous polyHEMA-based hydrogel. HIPE-templating was used to create a highly reproducible interconnected macroporous hydrogel, which showed a high-water uptake rate (reaching equilibrium ∼2 min). Furthermore, the water uptake did not highly vary under pH or saline level differences, likely due to its higher crosslink density and macroporous structure.The polyHIPE hydrogel showed an increased rate of water loss due to increased free water being held in macropores. When implemented into the soil, the saturated water content increased 2–4 vol% with a 2 wt% polyHIPE additive (2-way ANOVA shows significance, p < 0.05). The SWCC showed a higher water content overall in the PAW region (0.3–15 bar) when the macropores were present in hydrogel. However, the PAW was lower for polyHIPE than the bulk hydrogel due to a combination of high initial water release (<0.3 bar) and an increase in hygroscopic water content (>15 bar). While the polyHIPE increases total water holding capacity of the soil, it appears to hinder the water content available for plants in the soil (i.e., within the 0.3–15 bar range). In other words, it increases saturated water content, but releases it too easily during the transition between 0 to 0.3 bar, then holds onto water that otherwise would have been released at 15 bar pressure. Further work would be required to determine if this excess water held at pressures below 0.3 bar would also drain gravimetrically or would remain in the root zone of the soil due to an increase in hydrophilic surfaces.
As future work, one can study the position (e.g., near the soil surface or close to the root) or packing of the polyHIPE to improve this application in terms of reducing drainage loss or entrapping moisture at the surface. Changing the polyHIPE composition can also enhance the water holding capacity, such as decreasing the crosslinking density for higher swelling or increasing the void size to reduce capillary action that hygroscopically holds the water. Bearing in mind that there is a considerable influence on the water content of the soil, polyHIPEs with the correct formulation could be a potential solution to water-stressed areas.
While the main focus is water retention, a number of additional hydrogel applications can be further improved using the HIPE templating. For example, templated macroporous hydrogels can act as a seed coating material for agriculture applications to ensure good hydration and increase germination.45 The seed can be coated by the template and then crosslinked, or the powdered foam can be planted with the seeds to ensure moisture capture. The use of HIPE templating improves water absorption and reduction in cost. Erosion prevention is another application that can be explored with this material.46 Clay soils with a low infiltration rate suffer from erosion due to water runoff that can be reduced using a macroporous hydrogel with high capillary action. This surface water capture can also potentially reduce wind erosion by trapping moisture in the topsoil. These macroporous hydrogels can also be expanded from agriculture to landscaping, turf grass, soil reclamation, and cash crops that demand high quality. These industries, similar to agriculture, would benefit from a material that can improve soil-water interactions.
Conflicts of interest
There are no conflicts to declare.Acknowledgements
The authors thank Dr Manoj Shukla of NMSU for using his lab's pressure plate equipment. R. Z.'s support was partially funded by a USDA NIFA National Needs Fellowship no. 2015-38420-23706.References
- A. Boretti and L. Rosa, npj Clean Water, 2019, 2, 1–6 CrossRef.
- Irrigation and Water Use, https://www.ers.usda.gov/topics/farm-practices-management/irrigation-water-use/, (accessed 1 May 2018).
- The United Nations world water development report 2018: nature-based solutions for water - UNESCO Digital Library, https://unesdoc.unesco.org/ark:/48223/pf0000261424, (accessed 22 June 2021).
- M. C. Ramos, Agric. Water Manag., 2017, 191, 67–76 CrossRef.
- H. M. Chalwe, O. I. Lungu, A. M. Mweetwa, E. Phiri, S. M. C. Njoroge, R. L. Brandenburg and D. L. Jordan, Peanut Sci., 2019, 46, 42–49 CrossRef.
- F. Razzaghi, P. B. Obour and E. Arthur, Geoderma, 2020, 361, 114055 CrossRef CAS.
- D. Wang, C. Li, S. J. Parikh and K. M. Scow, Geoderma, 2019, 340, 185–191 CrossRef CAS.
- G. Bodner, A. Nakhforoosh and H. P. Kaul, Agron. Sustainable Dev., 2015, 35, 401–442 CrossRef.
- A. Jordán, L. M. Zavala and J. Gil, Catena, 2010, 81, 77–85 CrossRef.
- A. D. Basche, T. C. Kaspar, S. V. Archontoulis, D. B. Jaynes, T. J. Sauer, T. B. Parkin and F. E. Miguez, Agric. Water Manag., 2016, 172, 40–50 CrossRef.
- X. Ma and G. Wen, J. Polym. Res., 2020, 27, 136 CrossRef CAS.
- V. M. Gun'ko, I. N. Savina and S. V. Mikhalovsky, Adv. Colloid Interface Sci., 2013, 187–188, 1–46 CrossRef PubMed.
- M. Al-Jabari, R. A. Ghyadah and R. Alokely, J. Environ. Manage., 2019, 239, 255–261 CrossRef CAS PubMed.
- F. F. Montesano, A. Parente, P. Santamaria, A. Sannino and F. Serio, Agric. Agric. Sci. Procedia, 2015, 4, 451–458 Search PubMed.
- F. Yang, R. Cen, W. Feng, J. Liu, Z. Qu and Q. Miao, Sustainability, 2020, 12, 7825 CrossRef CAS.
- Y. Hu, N. Guo, R. L. Hill, S. Wu, Q. Dong and P. Ma, Can. J. Soil Sci., 2019, 99, 182–194 CrossRef CAS.
- M. Wolter, C. Wiesche, F. Zadrazil, S. Hey and J. Haselbach, Landbauforschung Volkenrode, 2002, 52, 43–52 CAS.
- M. D. Cameron, Z. D. Post, J. D. Stahl, J. Haselbach and S. D. Aust, Environ. Sci. Pollut. Res., 2000, 7, 130–134 CrossRef CAS PubMed.
- B. Wilske, M. Bai, B. Lindenstruth, M. Bach, Z. Rezaie, H. G. Frede and L. Breuer, Environ. Sci. Pollut. Res., 2014, 21, 9453–9460 CrossRef CAS PubMed.
- Q. Jiang, A. Menner and A. Bismarck, React. Funct. Polym., 2017, 114, 104–109 CrossRef CAS.
- A. Barbetta, G. Rizzitelli, R. Bedini, R. Pecci and M. Dentini, Soft Matter, 2010, 6, 1785 RSC.
- A. Barbetta, A. Gumiero, R. Pecci, R. Bedini and M. Dentini, Biomacromolecules, 2009, 10, 3188–3192 CrossRef CAS PubMed.
- A. Freytag, S. Sánchez-Paradinas, S. Naskar, N. Wendt, M. Colombo, G. Pugliese, J. Poppe, C. Demirci, I. Kretschmer, D. W. Bahnemann, P. Behrens and N. C. Bigall, Angew. Chem., Int. Ed., 2016, 55, 1200–1203 CrossRef CAS PubMed.
- R. Zowada and R. Foudazi, Langmuir, 2020, 36, 7868–7878 CrossRef CAS PubMed.
- R. Foudazi, R. Zowada, I. Manas-Zloczower and D. L. Feke, Langmuir, 2023, 39, 2092–2111 CrossRef CAS PubMed.
- T. Zhang, R. A. Sanguramath, S. Israel and M. S. Silverstein, Macromolecules, 2019, 52, 5445–5479 CrossRef CAS.
- R. Foudazi, React. Funct. Polym., 2021, 164, 104917 CrossRef CAS.
- M. Whitely, G. Rodriguez-Rivera, C. Waldron, S. Mohiuddin, S. Cereceres, N. Sears, N. Ray and E. Cosgriff-Hernandez, Acta Biomater., 2019, 93, 169–179 CrossRef CAS PubMed.
- J. L. Robinson, M. A. P. McEnery, H. Pearce, M. E. Whitely, D. J. Munoz-Pinto, M. S. Hahn, H. Li, N. A. Sears and E. Cosgriff-Hernandez, Tissue Eng., Part A, 2016, 22, 403–414 CrossRef CAS PubMed.
- A. Malakian, M. Zhou, R. T. Zowada and R. Foudazi, Polym. Int., 2019, 68, 1378–1386 CrossRef CAS.
- Z. A. Chaleshtari and R. Foudazi, ACS Appl. Polym. Mater., 2020, 2, 3196–3204 CrossRef CAS.
- R. Zowada and R. Foudazi, ACS Appl. Polym. Mater., 2019, 1, 1006–1014 CrossRef CAS.
- A. B. Deshmukh, A. C. Nalawade, I. Karbhal, M. S. Qureshi and M. V. Shelke, Carbon, 2018, 128, 287–295 CrossRef CAS.
- M. Maleki, P. T. Ahmadi, H. Mohamdi, H. Karimian, R. Ahmadi and H. B. M. Emrooz, Sol. Energy Mater. Sol. Cells, 2019, 191, 266–274 CrossRef CAS.
- Y. Huang, G. Ruan, Y. Ruan, W. Zhang, X. Li, F. Du, C. Hu and J. Li, RSC Adv., 2018, 8, 13417–13422 RSC.
- S. Kim, B. H. Shin, C. Yang, S. Jeong, J. H. Shim, M. H. Park, Y. B. Choy, C. Y. Heo and K. Lee, Polymer, 2018, 10, 772 Search PubMed.
- B. Wilske, M. Bai, B. Lindenstruth, M. Bach, Z. Rezaie, H. G. Frede and L. Breuer, Environ. Sci. Pollut. Res., 2014, 21, 9453–9460 CrossRef CAS PubMed.
- W. Zhao, T. Cao, P. Dou, J. Sheng and M. Luo, Sci. Rep., 2019, 9, 1–9 CrossRef PubMed.
- L. Yang, Y. Yang, Z. Chen, C. Guo and S. Li, Ecol. Eng., 2014, 62, 27–32 CrossRef.
- A. M. Abdallah, Int. Soil Water Conserv. Res., 2019, 7, 275–285 CrossRef.
- B. V. Zhmud, F. Tiberg and K. Hallstensson, J. Colloid Interface Sci., 2000, 228, 263–269 CrossRef CAS PubMed.
- Z. Liu, X. Yu and L. Wan, Transp. Res. Rec. J. Transp. Res. Board, 2013, 2349, 32–40 CrossRef.
- A. Hamraoui and T. Nylander, J. Colloid Interface Sci., 2002, 250, 415–421 CrossRef CAS PubMed.
- M. T. van Genuchten, Soil Sci. Soc. Am. J., 1980, 44, 892–898 CrossRef.
- J. M. Kovačič, T. Ciringer, J. Ambrožič-Dolinšek and S. Kovačič, Biomacromolecules, 2022, 23, 3452–3457 CrossRef PubMed.
- E. Wade, R. Zowada and R. Foudazi, Carbohydr. Polym. Technol. Appl., 2021, 2, 100114 CAS.
Footnote |
| † Electronic supplementary information (ESI) available. See DOI: https://doi.org/10.1039/d3lp00117b |
| This journal is © The Royal Society of Chemistry 2023 |

![[W with combining macron]](https://www.rsc.org/images/entities/i_char_0057_0304.gif)
