 Open Access Article
Surface engineered Fe3O4 nanomagnets for pH-responsive delivery of gemcitabine hydrochloride and in vivo tracking by radiolabeling†
Bijaideep
Dutta
ab,
Sandeep B.
Shelar
a,
K. C.
Barick
 *ab,
Priyalata
Shetty
c,
Rubel
Chakravarty
bc,
Sudipta
Chakraborty
bc,
Swati
Checker
ad,
H. D.
Sarma
e and
P. A.
Hassan
 *ab
*ab
aChemistry Division, Bhabha Atomic Research Centre, Trombay, Mumbai 400085, India. E-mail: kcbarick@barc.gov.in; hassan@barc.gov.in; Fax: +91 22 2550 5151; Tel: +91 22 2559 0284
bHomi Bhabha National Institute, Anushaktinagar, Mumbai 400094, India
cRadiopharmaceuticals Division, Bhabha Atomic Research Centre, Trombay, Mumbai 400085, India
dPGDM (Pharmaceuticals & Biotechnology), SIESSBS, Nerul, Navi Mumbai 400706, India
eRadiation Biology and Health Sciences Division, Bhabha Atomic Research Centre, Trombay, Mumbai 400085, India
First published on 15th October 2022
Abstract
Gemcitabine, a well-known nucleoside analogue, has shown tremendous potential against solid tumors. However, its clinical use is limited due to its poor biological half-life and low target to non-target ratio. In this regard, we have developed polyphosphate grafted Fe3O4 nanomagnets (PPNMs) for efficient delivery of gemcitabine hydrochloride (GEM). These nanocarriers are highly dispersible in physiological medium and possess sufficient surface charge (−25 mV) for electrostatic binding of positively charged GEM. The successful loading of GEM on PPNMs was evident from UV-visible absorption, FTIR spectroscopy and light scattering studies. The GEM loaded PPNMs (GEM-PPNMs) exhibited pH triggered release of the loaded drug, substantial cellular internalization, and higher toxicity towards human lung cancer (A549) and breast cancer (MCF-7) cell lines over pure drug. Further, the biodistribution of these nanocarriers was assessed by their tracking in a mouse model through radiolabeling with 64Cu and 177Lu. It has been observed that a radiolabeling yield of >90% can be achieved with PPNMs concentrations of 1 mg mL−1 and 0.5 mg mL−1 in 60 min for 64Cu and 177Lu, respectively, at room temperature. The radiolabeled PPNMs (64Cu-PPNMs and 177Lu-PPNMs) were highly stable during the study period in saline solution. Though the radiolabeled system exhibited higher uptake in the liver and spleen upon intravenous injection, a substantial uptake of the same was also found in the tumor. Specifically, the present study demonstrated the efficacy of PPNMs for delivery of GEM as well as their in vivo tracking by radiolabeling.
Introduction
The advancement of innovative materials for further improvement of their existing biological applications is the main focus of researchers now-a-days worldwide. The design of nanomaterials with certain specific functional properties to achieve desired diagnostic and therapeutic efficacy is of prime importance.1,2 This will refine the prevailing treatment procedure and help in eradicating the disease with ease. Starting from metal nanoparticles, metal oxide nanoparticles to metal and metal oxide hybrid nanoparticles are the choice of the decade for their simplicity in preparation and multifaceted applications. These nanoparticles provide a large surface area to play with and alter their overall activity as required time to time. Amid all this, Fe3O4 magnetic nanoparticles (MNPs) are typically significant for their exquisite magnetic properties which can change the course of the contemporary biomedical field. Because of their inimitable physicochemical properties and high biocompatibility nature, they can be used at cellular as well as subcellular level for numerous biological applications. Fe3O4 MNPs have been assessed for various biomedical applications such as cargo carriers for bioactive molecules (drugs, genes), next generation contrast agents for magnetic resonance imaging and localized heat mediated cancer cell killing via application of an external AC magnetic field.3–7 Of all uses, MNPs are exhaustively used as carriers for delivery of different chemotherapeutic drugs via active and passive targeting routes.8–10Amongst chemotherapeutic agents, gemcitabine (2′,2′-difluorodeoxycytidine), a nucleoside analogue, has been used against a variety of human tumors.11 It is a cytostatic drug which acts as an antimetabolite by inhibiting DNA replication. But the drawback of gemcitabine therapy lies in its rapid degradation which leads to low circulation time and the need for higher dosage. The use of higher dosage to achieve effective therapeutic efficacy leads to undesired side effects.12 Further, gemcitabine has poor cell membrane permeability, and thus, it generally internalizes into the cells via nucleoside transporters due to its hydrophilic characteristics.13 Therefore, the expression of higher levels of nucleoside transporters is required in patients to achieve a substantial survival rate, which restricts its use in patients having lower levels of nucleoside transporters. There are very few studies reported in the literature on the delivery of gemcitabine using MNPs as a carrier, which could enhance its retention time and reduce its side effects.14–16 Even though the use of MNPs as a drug carrier has many advantages, there are still some bottlenecks in their in vivo characteristics. Their efficacy was challenged many times due to recognition by our immune systems, mainly by the mononuclear phagocytic system (MPS) and reticuloendothelial system (RES) followed by clearance from the bloodstream as well as due to the presence of the blood–brain barrier. Thus, a strong competition exists between the distribution of MNPs in specific organs/tissues and their clearance mechanisms. The physicochemical property of MNPs affects the ultimate fate of the carriers upon administration in vivo.17 In order to increase the in vivo plasma half-life, different stealth coatings are used on the carriers.18,19 Therefore, the addition of a suitable surface passivating agent defines the mode of action of Fe3O4 MNPs. Further, most of the studies are concerned with only in vitro level toxicity and cellular internalization. In order to achieve the actual potential of the nanocarrier, in vivo biodistribution studies are essential. Therefore, the tracking of Fe3O4 MNPs movement in an animal model has paramount importance in their biomedical applications. Especially, the labelling of MNPs with suitable radionuclides is an advanced technique for biodistribution studies as well as their in vivo tracking using various multimodal imaging techniques.20,21
Herein, we have prepared negatively charged polyphosphate grafted Fe3O4 nanomagnets (PPNMs), and explored their efficacy for intracellular delivery of the anticancer drug, gemcitabine hydrochloride (GEM) through electrostatic interactions. These nanocarriers are highly dispersible in physiological medium, and GEM loaded PPNMs (GEM-PPNMs) exhibited pH dependent drug release characteristics, substantial cellular uptake and higher toxicity to human lung cancer (A549) and breast cancer (MCF-7) cell lines. Further, the biological activity of these nanocarriers was assessed by their tracking in a mouse model through radiolabeling with 64Cu and 177Lu. It is noteworthy to mention that the radiolabeled PPNMs were stable during the study period and substantial uptake of the same was also found in the tumor.
Experimental
Synthesis, structural characterization, drug interaction and cellular studies of PPNMs
PPNMs were synthesized through co-precipitation of ferrous and ferric ions (1![[thin space (1/6-em)]](https://www.rsc.org/images/entities/char_2009.gif) :
:![[thin space (1/6-em)]](https://www.rsc.org/images/entities/char_2009.gif) 2 molar ratio) in the presence of ammonium hydroxide (25%) followed by the introduction of sodium tripolyphosphate (STTP) as a surface passivating agent.22 The structural characterization (phase identification, determination of shape, size and surface properties) and magnetic properties of PPNMs were studied by X-ray diffraction (XRD), Fourier-transform infrared spectroscopy (FTIR), transmission electron microscopy (TEM), dynamic light scattering (DLS), zetasizer and physical property measurement system, etc.
2 molar ratio) in the presence of ammonium hydroxide (25%) followed by the introduction of sodium tripolyphosphate (STTP) as a surface passivating agent.22 The structural characterization (phase identification, determination of shape, size and surface properties) and magnetic properties of PPNMs were studied by X-ray diffraction (XRD), Fourier-transform infrared spectroscopy (FTIR), transmission electron microscopy (TEM), dynamic light scattering (DLS), zetasizer and physical property measurement system, etc.
The interaction of GEM with PPNMs was explored by monitoring the changes in surface charge and absorbance. The drug loading efficiency was determined from UV-visible absorption spectroscopic studies at pH 4, 6 and 8 with different drug to particle ratios. The pH mediated release of the drug from GEM-PPNMs was achieved under reservoir (r)-sink (s) conditions at 37 °C. The cytotoxicity of GEM and GEM-PPNMs was examined against MCF-7 cells at five different concentrations of the drug ranging from 0.001 to 10 μM. The details of synthesis, structural characterization, drug loading and release, cytotoxicity, cellular uptake and cell death studies are provided in the ESI.†
Production of radionuclides (64Cu and 177Lu) and radiolabeling of PPNMs
64Cu was produced via64Zn(n,p)64Cu by irradiation of the isotopically enriched (99.4% in 64Zn) ZnO target. No-carrier added 64Cu was extracted from the irradiated target in the form of [64Cu]CuCl2 solution in 0.01 M HCl following the procedure reported elsewhere.23177Lu was produced via the 176Lu(n,γ)177Lu route by direct neutron bombardment of the isotopically enriched (74.5% in 176Lu) Lu2O3 target. The irradiated target was converted to [177Lu]LuCl3 solution in 0.01 M HCl as per the reported procedure.24Radiolabeling of PPNMs with 64Cu and 177Lu was performed using [64Cu]CuCl2 and [177Lu]LuCl3 radiochemical precursors, respectively. Briefly, 0.1 mL solution of [64Cu]CuCl2 (4 MBq of 64Cu) or [177Lu]LuCl3 (20 MBq of 177Lu) (both in 0.01 mL of HCl) was first added to the aqueous dispersion of PPNMs (0.2, 0.5, 1.0 and 2.0 mg in 1.0 mL of Milli Q water). The pH of the mixture was adjusted to ∼5.5 by addition of a few drops of 0.1 M NaHCO3 solution. The total volume of the mixture was maintained at 2.0 mL using Milli Q water and the mixture was kept at room temperature under continuous stirring for adsorption of radionuclides onto the surface of PPNMs. Subsequently, the suspended radiolabeled PPNMs were magnetically separated by using a table-top magnet. For determination of percentage of radiolabeling, an aliquot (typically, 100 μL) of the clear supernatant was carefully withdrawn and its radioactivity was measured. The radioactivity of the same volume of ‘blank’ was also measured. The ‘blank’ solution was prepared by diluting 0.1 mL of [64Cu]CuCl2 (4 MBq of 64Cu) or [177Lu]LuCl3 (20 MBq of 177Lu) with 1.9 mL of Milli Q water, where no PPNMs were added. The percentage of radiolabeling yield was calculated using the following equation:
In vitro stability of radiolabeled PPNMs
The in vitro stability of 64Cu- and 177Lu-labeled PPNMs was investigated in normal saline and rat serum. In vitro stability in normal saline was explored by diluting 0.2 mL of [64Cu]Cu-PPNMs and [177Lu]Lu-PPNMs formulations with 1.8 mL of normal saline. The mixtures were kept at 37 °C for up to 2 days for the 64Cu-labeled formulation and for 15 days for the 177Lu-labeled formulation. The percentage of 64Cu or 177Lu activity leached out into the saline from radiolabeled formulations at different time intervals post-preparation was determined following the same procedure used for determination of radiolabeling yields. From this, the percentage radioactivity that remained associated with PPNMs as a function of time post-preparation was determined, which ascertains the in vitro stability of the formulations in saline.In vitro stability in rat serum was studied by thoroughly mixing 0.2 mL of formulations with 1.8 mL of freshly isolated rat serum. The mixtures were kept at 37 °C for up to 2 days. The percentage radioactivity that remained associated with PPNMs as a function of time post-preparation was determined as in the previous case.
In vivo biodistribution studies of radiolabeled PPNMs
Biodistribution studies of the radiolabeled PPNMs formulations were performed in C57BL/6 mice bearing melanoma tumor as per the protocol approved by the Institutional Animal Ethics Committee of the Bhabha Atomic Research Centre, Mumbai, India.Melanoma tumors were developed by injecting about 1 × 10⁶ melanoma cells suspended in 200 μL of PBS to the right thigh of C57BL/6 mice (weight: 20–25 g). The animals were monitored for development of tumors and the biodistribution studies were carried out once the tumor volume reached 150–200 mm3 (∼2 weeks after inoculation). An aliquot (0.1 mL) of the radiolabeled formulation (2–3 MBq) was injected intravenously into each tumor-bearing mouse. In the case of mice injected with 64Cu-PPNMs, a group of 4 mice were sacrificed by CO2 asphyxiation at 1, 4 and 24 h post injection (p.i.). Various organs/tissues were collected by thoroughly washing with saline (except blood) and dried. The radioactivity associated with them was determined using a flat-type NaI (Tl) scintillation counter. The percentage of injected radioactivity dose (% ID) in various organs/tissues was determined and provided as percentage injected radioactivity dose per gram (% ID g−1) of organ/tissue. In the case of 177Lu-PPNMs, biodistribution studies were performed at 1, 4, 24, 72 and 168 h p.i.
Results and discussion
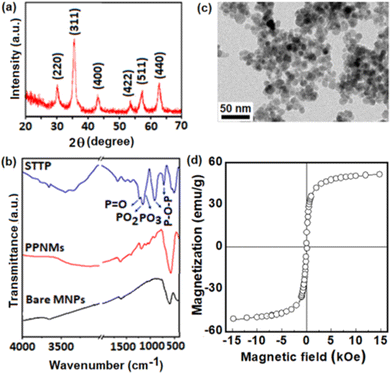
The primary objective of the present study was exploration of the capability of negatively charged Fe3O4 nanomagnets for delivery of GEM and investigation of their in vivo biodistribution by radiolabeling. STTP was employed as a surface passivating agent due to its biocompatible nature and higher binding affinity towards Fe3O4via bidentate and tridentate bridging geometry. PPNMs were prepared as reported earlier by our group and well-characterized by XRD, TEM, FTIR, TGA and magnetic measurements.22 Here, the typical XRD pattern, FTIR spectrum, TEM image and magnetization plot of PPNMs are provided (Fig. 1) to confirm their successful phase formation and organic modifications. Briefly, the appearance of sharp and intense characteristic diffraction peaks corresponding to (220), (311), (400), (422), (511) and (440) planes in the XRD pattern of PPNMs (Fig. 1a) confirmed the formation of the highly crystalline single phase Fe3O4 nanostructure (JCPDS Card No. 88-0315). The characteristic stretching vibrational bands associated to P![[double bond, length as m-dash]](https://www.rsc.org/images/entities/char_e001.gif) O, PO2 and PO3 groups, and the P–O–P bridge are found in the FTIR spectrum of pure STTP (Fig. 1b).22 These modes are observed in the FTIR spectrum of PPNMs with a slight shift in their band position in the range of 700–1250 cm−1, whereas they are absent in bare MNPs. Further, the intense band at ∼575 cm−1 in PPNMs can be ascribed to the Fe–O stretching vibration of Fe3O4. The TEM image of PPNMs (Fig. 1c) reveals the formation of mostly spherical particles of size ∼10 nm and they show superparamagnetic behavior without hysteresis and remanence at 300 K. The maximum magnetization of PPNMs was found to be 51 emu g−1 at 15 kOe.
O, PO2 and PO3 groups, and the P–O–P bridge are found in the FTIR spectrum of pure STTP (Fig. 1b).22 These modes are observed in the FTIR spectrum of PPNMs with a slight shift in their band position in the range of 700–1250 cm−1, whereas they are absent in bare MNPs. Further, the intense band at ∼575 cm−1 in PPNMs can be ascribed to the Fe–O stretching vibration of Fe3O4. The TEM image of PPNMs (Fig. 1c) reveals the formation of mostly spherical particles of size ∼10 nm and they show superparamagnetic behavior without hysteresis and remanence at 300 K. The maximum magnetization of PPNMs was found to be 51 emu g−1 at 15 kOe.
Colloidal stability of nanoparticles in physiological medium (PBS) is essential for their biological applications. Fig. 2 presents (a) DLS and (b) zeta-potential plots of PPNMs in physiological medium. The DLS plot (Fig. 2a) shows that PPNMs are highly dispersible in physiological medium (PBS, pH 7.4) and possess a mean intensity weighted hydrodynamic diameter of about 170 nm with a polydispersity index (PDI) of 0.25. The corresponding number weighted hydrodynamic diameter was found to be around 50 nm by using the DLS software. The zeta-potential analysis revealed that the surface charge of PPNMs in physiological medium was about −25 mV (Fig. 2b), whereas that of bare MNPs was −15 mV (Fig. S1, ESI†). The appearance of such a high negative surface charge on PPNPs is mainly due to the occurrence of phosphate moieties on their exterior, which is adequate for electrostatic stabilization of particles. Further, the hydrogen bonds between oxygen molecules of phosphate moieties and water provide additional colloidal stability to PPNMs. The good colloidal stability of PPNMs is also evident from the photograph of dispersion of PPNMs in physiological medium (inset of Fig. 2b) and the insignificant change in their hydrodynamic diameter in physiological medium with respect to time (Fig. S2, ESI†). Moreover, they should have lesser binding affinity towards macrophages, plasma proteins or other cell membranes being negatively charged.
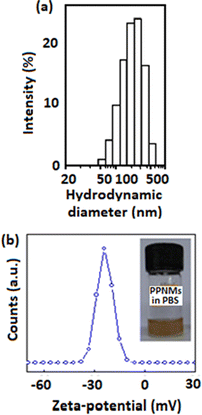 | ||
| Fig. 2 (a) DLS and (b) zeta-potential plots of PPNMs in physiological medium. The inset of part (b) shows the photograph of colloidal dispersion of PPNMs in physiological medium. | ||
These negatively charged PPNMs were used for electrostatic conjugation of positively charged GEM (due to the protonation of the NH2 group) as shown in Scheme 1. The loading efficiency of GEM was augmented by changing the ratio of drug to particles as well as pH of the medium, as shown in Table 1. A maximum loading efficiency of 23.7% was found at a drug to particle ratio of 1![[thin space (1/6-em)]](https://www.rsc.org/images/entities/char_2009.gif) :
:![[thin space (1/6-em)]](https://www.rsc.org/images/entities/char_2009.gif) 40 at pH 6 from UV-visible absorption studies. Parsian et al. found a maximum loading efficiency of about 39% by interacting chitosan coated MNPs (2.5 mg mL−1) with 22.5 μg mL−1 of GEM.25 Even though the maximum loading efficiency is quite low in the present study, the GEM loaded PPNMs exhibited higher cytotoxicity over pure GEM (discussed later). A typical UV-visible absorption spectrum of the supernatant solution (obtained after magnetic removal of GEM-PPNMs) along with standard curves are shown in Fig. S3 (ESI†). The surface charge of GEM-PPNMs in aqueous medium was −5 mV at pH 6, whereas that of PPNMs was −28 mV. This significant increase in surface charge from −28 mV to −5 mV could be described by neutralization of the negative charge through loading of GEM.14 The loading of GEM on PPNMs was further supported from FTIR and DLS analysis. Fig. 3 shows (a) the FTIR spectra of pure GEM and GEM-PPNMs and (b) the DLS plot of GEM-PPNMs showing the intensity weighted hydrodynamic diameter. The peak at 577 cm−1 in the FTIR spectrum of GEM-PPNMs can be ascribed to the Fe–O stretching vibrational mode of Fe3O4.22 The FTIR spectrum of GEM showed bands at approximately 1645 and 1065 cm−1 due to the bending modes of –NH/OH and stretching vibration of C–O, respectively.26,27 The broad band that appeared in the 3000–3700 cm−1 region can be ascribed to –NH/OH stretching vibrational modes.27 Interestingly, these characteristic bands of GEM are also observed in the FTIR spectrum of GEM-PPNMs suggesting the loading of the drug onto the surface of PPNMs (absent in the FTIR spectrum of PPNMs). In addition, the increase in mean intensity weighted hydrodynamic diameter from 170 to 195 nm upon conjugation of GEM onto the surface of PPNMs further supports the successful loading of the drug. Moreover, the interaction of GEM-PPNMs with protein was explored utilizing BSA as a model protein and the observed results are shown in Table S1 (ESI†). The insignificant change in the surface charge of GEM-PPNMs in BSA solution suggested their good resistance towards protein interaction. The maximum drug loaded PPNMs sample was used for further studies.
40 at pH 6 from UV-visible absorption studies. Parsian et al. found a maximum loading efficiency of about 39% by interacting chitosan coated MNPs (2.5 mg mL−1) with 22.5 μg mL−1 of GEM.25 Even though the maximum loading efficiency is quite low in the present study, the GEM loaded PPNMs exhibited higher cytotoxicity over pure GEM (discussed later). A typical UV-visible absorption spectrum of the supernatant solution (obtained after magnetic removal of GEM-PPNMs) along with standard curves are shown in Fig. S3 (ESI†). The surface charge of GEM-PPNMs in aqueous medium was −5 mV at pH 6, whereas that of PPNMs was −28 mV. This significant increase in surface charge from −28 mV to −5 mV could be described by neutralization of the negative charge through loading of GEM.14 The loading of GEM on PPNMs was further supported from FTIR and DLS analysis. Fig. 3 shows (a) the FTIR spectra of pure GEM and GEM-PPNMs and (b) the DLS plot of GEM-PPNMs showing the intensity weighted hydrodynamic diameter. The peak at 577 cm−1 in the FTIR spectrum of GEM-PPNMs can be ascribed to the Fe–O stretching vibrational mode of Fe3O4.22 The FTIR spectrum of GEM showed bands at approximately 1645 and 1065 cm−1 due to the bending modes of –NH/OH and stretching vibration of C–O, respectively.26,27 The broad band that appeared in the 3000–3700 cm−1 region can be ascribed to –NH/OH stretching vibrational modes.27 Interestingly, these characteristic bands of GEM are also observed in the FTIR spectrum of GEM-PPNMs suggesting the loading of the drug onto the surface of PPNMs (absent in the FTIR spectrum of PPNMs). In addition, the increase in mean intensity weighted hydrodynamic diameter from 170 to 195 nm upon conjugation of GEM onto the surface of PPNMs further supports the successful loading of the drug. Moreover, the interaction of GEM-PPNMs with protein was explored utilizing BSA as a model protein and the observed results are shown in Table S1 (ESI†). The insignificant change in the surface charge of GEM-PPNMs in BSA solution suggested their good resistance towards protein interaction. The maximum drug loaded PPNMs sample was used for further studies.
| pH of the reaction medium | Amount of GEM (μg) | Amount of PPNMs (μg) | Drug to particle ratio | Loading efficiency (%) |
|---|---|---|---|---|
| 6 | 10 | 50 | 1![[thin space (1/6-em)]](https://www.rsc.org/images/entities/char_2009.gif) : :![[thin space (1/6-em)]](https://www.rsc.org/images/entities/char_2009.gif) 5 5 |
2.3 |
| 10 | 100 | 1![[thin space (1/6-em)]](https://www.rsc.org/images/entities/char_2009.gif) : :![[thin space (1/6-em)]](https://www.rsc.org/images/entities/char_2009.gif) 10 10 |
5.6 | |
| 10 | 200 | 1![[thin space (1/6-em)]](https://www.rsc.org/images/entities/char_2009.gif) : :![[thin space (1/6-em)]](https://www.rsc.org/images/entities/char_2009.gif) 20 20 |
10.5 | |
| 10 | 400 | 1![[thin space (1/6-em)]](https://www.rsc.org/images/entities/char_2009.gif) : :![[thin space (1/6-em)]](https://www.rsc.org/images/entities/char_2009.gif) 40 40 |
23.7 | |
| 10 | 800 | 1![[thin space (1/6-em)]](https://www.rsc.org/images/entities/char_2009.gif) : :![[thin space (1/6-em)]](https://www.rsc.org/images/entities/char_2009.gif) 80 80 |
21.6 | |
| 4 | 10 | 400 | 1![[thin space (1/6-em)]](https://www.rsc.org/images/entities/char_2009.gif) : :![[thin space (1/6-em)]](https://www.rsc.org/images/entities/char_2009.gif) 40 40 |
19.0 |
| 6 | 10 | 400 | 1![[thin space (1/6-em)]](https://www.rsc.org/images/entities/char_2009.gif) : :![[thin space (1/6-em)]](https://www.rsc.org/images/entities/char_2009.gif) 40 40 |
23.7 |
| 8 | 10 | 400 | 1![[thin space (1/6-em)]](https://www.rsc.org/images/entities/char_2009.gif) : :![[thin space (1/6-em)]](https://www.rsc.org/images/entities/char_2009.gif) 40 40 |
21.9 |
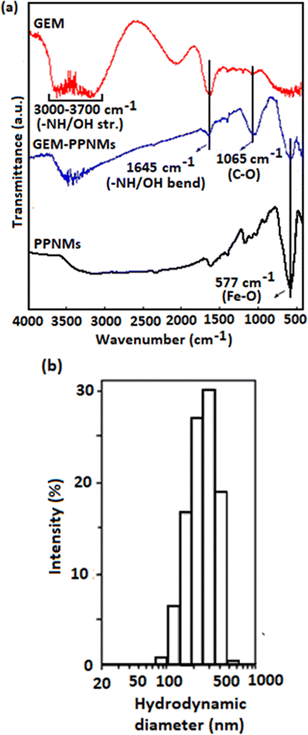 | ||
| Fig. 3 (a) FTIR spectra of pure GEM, PPNMs and GEM-PPNMs and (b) DLS plot of GEM-PPNMs showing the intensity weighted hydrodynamic diameter. | ||
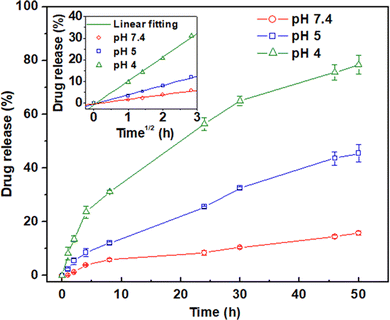
Fig. 4 shows the pH responsive release of the drug from GEM-PPNMs under reservoir sink conditions at 37 °C. The drug release study was performed in a mild acidic medium as the pH of subcellular organelles like lysosomes and endosomes (late stage) is in the range of pH 3–5.28 It was found that the loaded GEM was released in a pH dependent manner with higher release at lower pH. The amount of drug release over a period of 50 h was found to be 15, 45 and 80% at pH 7.4, 5 and 4, respectively. The short time release characteristic shows a linear relationship between GEM release and square root of time (t1/2) as anticipated from the Higuchi drug release model (inset of Fig. 4). This indicates that the release of GEM from nanocarriers occurs in a diffusion-controlled manner.29 It is worth mentioning that in a mild acidic medium (pH 5) the protonation of the phosphate group leads to a decrease in the electrostatic interaction between drug molecules and nanocarriers, thereby enhancing the release of the drug from the carrier. This was not observed in physiological medium (pH 7.4). At a still lower pH of 4, the drug release percentage was found to be further increased. Similar pH-responsive release of the drug from GEM loaded nanocarriers was observed by various research groups.25,30–32 For instance, Parsian et al. reported only 8% release of GEM from chitosan coated MNPs at pH 7.2, whereas the release was 65.4% at pH 4.2.25 Mottaghitalab et al. observed a faster release rate of GEM at pH 5 in comparison to pH 7.4 from the GEM loaded silk fibroin nanoparticles.30 The observed pH mediated slow and sustained drug release profile in the present study suggested that the developed carriers can be utilized for intracellular delivery of GEM. Further, the quite slow release of GEM from the developed nanocarriers at pH 7.4 is highly beneficial for its stability in blood as the half-life of free GEM is very short (8–17 min) under physiological conditions.33
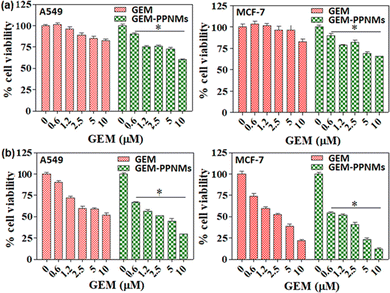
Fig. 5 shows the viability of A549 and MCF-7 cells incubated in the medium containing GEM and GEM-PPNMs for 24 h and 48 h. From MTT assay, it has been found that both GEM and GEM-PPNMs induced dose-dependent toxicity against both A549 and MCF-7 cells upon incubation for 24 h and 48 h. The cytotoxicity of GEM and GEM-PPNMs is more prominent with 48 h incubation in both the cell lines. It is noteworthy to mention that the developed formulation has higher toxicity over pure GEM (toxicity data of GEM-PPNMs are statistically significant against the respective GEM group, p < 0.05), which is advantageous for therapeutic applications. The observed higher toxicity could be associated with the increase in cellular uptake of the drug by endocytosis of GEM-PPNMs.25,32 In addition, the nanocarriers do not show toxicity to both A549 and MCF-7 cells up to a concentration of 200 μg mL−1, suggesting their safe in vivo use (Fig. S4, ESI†).
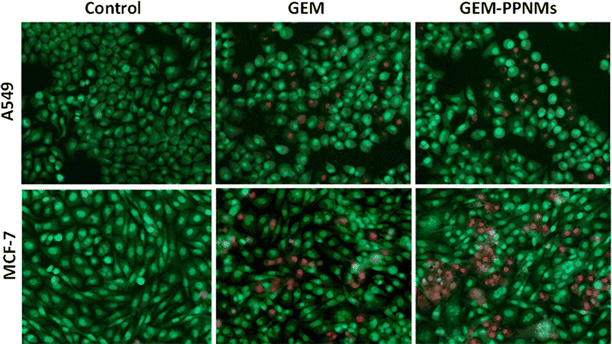
Different staining techniques are commonly used to visualize the cellular processes by optical or fluorescence imaging of cells.34–38 The cellular uptake of PPNMs was confirmed from the Prussian blue staining study in MCF-7 cells. From the vivid blue-coloured deposition (due to the formation of ferric ferrocyanide) in MCF-7 cells incubated with PPNMs (Fig. S5, ESI†), it can be deduced that a substantial amount of particles are successfully internalized into the cells as compared to their little cell surface attachment.34 Acridine orange/ethidium bromide (AO/EB) fluorescence staining was further performed with A549 and MCF-7 cells to understand the cell death process after treating with GEM and GEM-PPNMs at a drug concentration of 2.5 μM for 48 h. Fig. 6 shows the fluorescent microscopic images of A549 and MCF-7 cells providing morphological evidence of apoptosis by AO/EB dual staining. The nuclei of cells having uniform chromatin with intact cell membranes (control or viable cells) are stained in green colour by AO, whereas those with loss of membrane integrity and with different stages of cell death are stained differently with EB. In general, the early apoptosis cells displayed a bright green region with yellowish green nuclear fragmentation, and membrane bubbles and apoptotic bodies outside, whereas the late apoptosis cells showed orange-yellow or red nuclei with condensed or fragmented chromatin.39 The changes of colour from light orange to pale red in the present study suggested that most of the cells were dead via apoptosis mode due to the action of GEM and GEM-PPNMs on both the cancer cell lines. Thus, GEM-PPNMs may serve as a promising tool for intracellular delivery of drugs. Further, GEM resistance developed by some cancer cells due to the loss of certain human equilibrative nucleoside transporters (hENTs) can be overcome through its carrier mediated delivery as hENTs are not required for cellular uptake of the drug.40 Being magnetic in nature, these nanocarriers can also be used as an effective heating source for hyperthermia therapy as well as a contrast agent in magnetic resonance imaging.3,6 Moreover, these nanocarriers possess good magnetic field responsivity, and therefore, they can be accumulated at the site of interest by applying an external magnetic field.25
Radiolabeling of Fe3O4 MNPs is a common method for monitoring the distribution of the nanoparticles in vivo.20,21 We have carried out radiolabeling of PPNMs with 64Cu2+ and 177Lu3+ (Scheme 2) by exploiting the high coordinative affinity of polyphosphate moieties of PPNMs towards metal ions as a driving force for radiolabeling. It is noteworthy to mention that these polyphosphate moieties capture 64Cu2+ and 177Lu3+ ions from solution by forming chelate complexes like those of carboxylate ions and metal ions.41 The kinetics of radiolabeling with 64Cu and 177Lu using different concentrations of PPNMs is shown in Fig. 7(a) and (b), respectively. It has been observed that for 64Cu, a radiolabeling yield of >90% can be achieved when a PPNMs concentration of 1 mg mL−1 is used and the reactions are performed for 60 min at room temperature (Fig. 7a). On the other hand, the optimum condition for obtaining >90% radiolabeling with 177Lu was found to be incubation of PPNMs at 0.5 mg mL−1 concentration with 177LuCl3 for 60 min at room temperature (Fig. 7b). It has been found that the radiolabeling of PPNMs with 64Cu and 177Lu mostly follows a pseudo first order kinetic model. The typical plots showing radiolabeling of PPNMs with 64Cu and 177Lu (PPNMs concentration of 1 mg mL−1) are provided in Fig. S6 (ESI†).
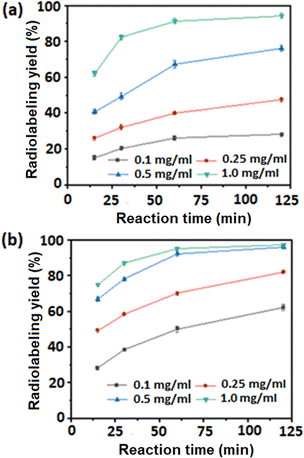 | ||
| Fig. 7 Kinetics of radiolabeling of PPNMs with (a) 64Cu and (b) 177Lu using different concentrations of nanoparticles. | ||
In vitro stability assessment of 64Cu- and 177Lu-labeled formulations showed that both the formulations retained their radiochemical stability in normal saline and rat serum up to the time of study mentioned in the experimental section. In all the cases, the percentage of radioactivity leached out from the radiolabeled formulations at the end of investigations was less than 5% (Fig. S7, ESI†). These results indicate the robustness of binding of 64Cu and 177Lu radioisotopes with PPNMs, which results in appreciably high radiochemical stability of the radiolabeled nanoformulations under physiological conditions.
After intravenous injection of 64Cu- and 177Lu-labeled PPNMs in C57BL/6 mice bearing melanoma tumor, in vivo biodistribution studies were performed by sacrificing the mice at different time points. The biodistribution patterns of 64Cu- and 177Lu-labeled PPNMs are shown in Fig. 8(a) and (b), respectively. It is observed that both 64Cu- and 177Lu-labelled PPNMs are primarily taken up by macrophages in different MPS organs, specifically liver and spleen, with immediate clearance from blood. The activity accumulated in the liver and spleen was found to decrease slowly with time. For example, the % ID g−1 decrease in the liver (from ∼52.62% at 1 h to 30.08% at 168 h) and spleen (from 15.29% to 11.72% at 168 h) in 177Lu-PPNMs treated mice indicates the clearance of PPNMs from the liver and spleen with time. However, a slower degradation rate was observed in spleen macrophages as compared to liver Kupffer cells possibly due to the presence of less iron storage proteins in spleen. The observed results match well with earlier reports on intravenously injected MNPs, which discussed their higher uptake in the liver and spleen.42,43 A small fraction of PPNMs was also observed in the lungs and GIT, which slowly cleared with time. The radioactivity in the kidney showed that a minor portion of the radiolabeled PPNMs was excreted via urine. It is noteworthy to mention that the tumor uptake of PPNMs increases with time and a maximum uptake having 3.16% ID g−1 was observed in 177Lu-PPNMs treated mice at 24 h p.i., and this slowly decreased. Further, the retention of a substantial amount of radiolabeled PPNMs at the tumor site even at 168 h p.i. suggests their good potential as a nanocarrier for in vivo drug delivery. This is also required for radiotherapeutic usage. Moreover, the higher uptake of PPNMs in the liver can be useful for identifying liver cancer through MRI as higher uptake of PPNMs by Kupffer cells of the normal liver produces a dark contrast in T2-weighted MRI, whereas the tumor sites lacking Kupffer cells and thereby phagocytized PPNMs appear as bright regions.44
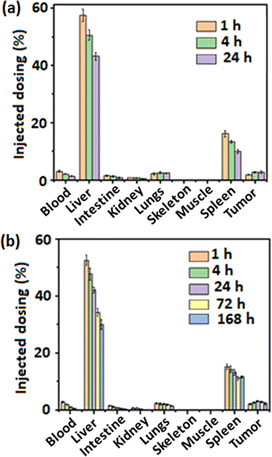 | ||
| Fig. 8 Biodistribution patterns of (a) 64Cu-PPNMs and (b) 177Lu-PPNMs in C57BL/6 mice bearing melanoma tumor (a group of 4 mice were used for each time frame). | ||
The ratios of target to nontarget uptake of the radiolabeled PPNMs were calculated and the results are shown in Table 2. In the case of 177Lu-PPNMs, the tumor to blood ratio was found to increase from 0.78 at 1 h p.i. to 10.39 at 168 h p.i., and the tumor to liver ratio was found to increase from 0.04 to 0.08 during the same time period. The accretion of PPNMs at the tumor site can be further increased by conjugation of suitable targeting agents with PPNMs.45 Specifically, the present study investigated the in vivo biodistribution of magnetic nanocarriers in a mouse model through radiolabeling and their efficacy for intracellular delivery of positively charged anticancer agents.
| Time p.i. | 1 (h) | 4 (h) | 24 (h) | 72 (h) | 168 (h) |
|---|---|---|---|---|---|
| 64Cu-PPNMs | |||||
| Tumor/blood | 0.62 ± 0.12 | 1.31 ± 0.16 | 1.96 ± 0.31 | — | — |
| Tumor/liver | 0.03 ± 0.01 | 0.06 ± 0.01 | 0.06 ± 0.12 | — | — |
| 177Lu-PPNMs | |||||
| Tumor/blood | 0.78 ± 0.18 | 1.37 ± 0.17 | 2.86 ± 0.29 | 5.12 ± 0.48 | 10.39 ± 0.76 |
| Tumor/liver | 0.04 ± 0.01 | 0.06 ± 0.02 | 0.07 ± 0.02 | 0.08 ± 0.03 | 0.08 ± 0.10 |
Conclusion
Anticancer drug, GEM was successfully loaded onto the negatively charged PPNMs through electrostatic interactions. GEM loaded PPNMs showed pH dependent release characteristics and exhibited higher toxicity towards MCF-7 and A549 cell lines over the pure drug. Further, the biodistribution of these nanocarriers was investigated in a mouse model by radiolabeling. The polyphosphate moieties on PPNMs capture 64Cu2+ and 177Lu3+ ions from solution by forming chelate complexes and this radiolabeling process follows a pseudo first order kinetic model. From in vivo studies, a substantial amount of radiolabeled PPNMs was found in the tumor. Therefore, the developed PPNMs can be used for delivery of GEM as well as in vivo tracking by radiolabeling.Author contributions
Bijaideep Dutta: investigation, methodology, data curation, and writing – original draft. Sandeep B. Shelar: investigation, methodology, and data curation. K. C. Barick: project administration, writing – review & editing, supervision, conceptualization, and visualization. Priyalata Shetty: investigation, methodology, and validation. Rubel Chakravarty: investigation, validation, formal analysis, and writing – review & editing. Sudipta Chakraborty: formal analysis, visualization, and writing – review & editing. Swati Checker: investigation, methodology, and data curation. H. D. Sarma: investigation, methodology, and data curation. P. A. Hassan: project administration, writing – review & editing, supervision, and resources.Conflicts of interest
There are no conflicts to declare.Acknowledgements
The authors acknowledge Dr A. K. Tyagi, Director, Chemistry Group, and Dr S. Kannan, Director, Radiochemistry & Isotope Group, BARC for their constant support and encouragement. Thanks are due to Mr K. C. Jagadeesan and Dr S. V. Thakare, Radiopharmaceuticals Division, BARC for arranging irradiation of the targets in Dhruva and APSARA-U reactor facilities at BARC. The staff members of the Radiochemical Section, Radiopharmaceuticals Division, BARC are acknowledged for radiochemical processing of the irradiated targets. The authors are also thankful to IIT Bombay and TPD, BARC for TEM imaging and magnetic measurements, respectively.References
- S. C. Baetke, T. Lammers and F. Kiessling, Applications of nanoparticles for diagnosis and therapy of cancer, Br. J. Radiol., 2015, 88, 1054 CrossRef PubMed.
- Z. Wenlong, F. Gu, J. M. Chan and A. Wang, Nanoparticles in medicine: therapeutic applications and developments, Clin. Pharm. Therap., 2008, 83, 761–769 CrossRef PubMed.
- K. C. Barick, S. Singh, N. V. Jadhav, D. Bahadur, B. N. Pandey and P. A. Hassan, pH-responsive peptide mimic shell cross-linked magnetic nanocarriers for combination therapy, Adv. Funct. Mater., 2012, 22, 4975–4984 CrossRef CAS.
- L. Wu, L. Zong, H. Ni, X. Liu, W. Wen, L. Feng, J. Cao, X. Qi, Y. Ge and S. Shen, Magnetic thermosensitive micelles with upper critical solution temperature for NIR triggered drug release, Biomater. Sci., 2019, 7, 2134–2143 RSC.
- Q. Xu, T. Zhang, Q. Wang, X. Jiang, A. Li, Y. Li, T. Huang, F. Li, Y. Hu, D. Ling and J. Gao, Uniformly sized iron oxide nanoparticles for efficient gene delivery to mesenchymal stem cells, Int. J. Pharm., 2018, 552, 443–452 CrossRef CAS PubMed.
- B. Dutta, A. Nema, N. G. Shetake, J. Gupta, K. C. Barick, M. A. Lawande, B. N. Pandey, I. K. Priyadarsini and P. A. Hassan, Glutamic acid-coated Fe3O4 nanoparticles for tumor-targeted imaging and therapeutics, Mater. Sci. Eng., C, 2020, 112, 110915 CrossRef CAS PubMed.
- M. Arruebo, R. Fernandez-Pacheco, M. Ricardo Ibarra and J. Santamarıa, Magnetic nanoparticles for drug delivery, Nanotoday, 2007, 2, 22–32 CrossRef.
- B. Dutta, N. G. Shetake, B. K. Barick, K. C. Barick, B. N. Pandey, K. I. Priyadarsini and P. A. Hassan, pH sensitive surfactant-stabilized Fe3O4 magnetic nanocarriers for dual drug delivery, Colloids Surf., B, 2018, 162, 163–171 CrossRef CAS PubMed.
- T. Yang, D. Niu, J. Chen, J. He, S. Yang, X. Jia, J. Hao, W. Zhao and Y. Li, Biodegradable organosilica magnetic micelles for magnetically targeted MRI and GSH-triggered tumor chemotherapy, Biomater. Sci., 2019, 7, 2951–2960 RSC.
- N. Saxena, H. Agraval, K. C. Barick, D. Ray, V. K. Aswal, A. Singh, U. C. S. Yadav and C. L. Dube, Thermal and microwave synthesized SPIONs: Energy effects on the efficiency of nano drug carriers, Mater. Sci. Eng., C, 2020, 111, 110792 CrossRef CAS.
- L. H. Reddy and P. Couvreur, Novel Approaches to Deliver Gemcitabine to Cancers, Cur. Pharm. Des., 2008, 14, 1124–1137 CrossRef CAS PubMed.
- C. A. Dasanu, Gemcitabine: vascular toxicity and prothrombotic potential, Expert Opin. Drug Saf., 2008, 7, 703–716 CrossRef CAS PubMed.
- F. Joubert, L. Martin, S. Perrier and G. Pasparakis, Development of a gemcitabine-polymer conjugate with prolonged cytotoxicity against a pancreatic cancer cell line, ACS Macro Lett., 2017, 6, 535–540 CrossRef CAS.
- M. Parsian, G. Unsoy, P. Mutlu, S. Yalcin, A. Tezcaner and U. Gunduz, Loading of Gemcitabine on chitosan magnetic nanoparticles increases the anti-cancer efficacy of the drug, Eur. J. Pharm., 2016, 784, 121–128 CrossRef CAS PubMed.
- J. L. Viota, A. Carazo, J. A. Munoz-Gamez, K. Rudzka, R. Gómez-Sotomayor, A. Ruiz-Extremera, J. Salmerón and A. V. Delgado, Functionalized magnetic nanoparticles as vehicles for the delivery of the antitumor drug gemcitabine to tumor cells. Physicochemical in vitro evaluation, Mater. Sci. Eng., C, 2013, 33, 1183–1192 CrossRef CAS.
- G. García-García, F. Fernández-Álvarez, L. Cabeza, Á. V. Delgado, C. Melguizo, J. C. Prados and J. L. Arias, Gemcitabine-loaded magnetically responsive poly(ε-caprolactone) nanoparticles against breast cancer, Polymers, 2020, 12, 2790 CrossRef PubMed.
- A. A. Belanova, N. Gavalas, Y. M. Makarenko, M. M. Belousova, A. V. Soldatov and P. V. Zolotukhin, Physicochemical properties of magnetic nanoparticles: Implications for biomedical applications in vitro and in vivo, Oncol. Res. Treat., 2018, 41, 139–143 CrossRef CAS PubMed.
- H. Arami, A. Khandhar, D. Liggitt and K. M. Krishnan, In vivo delivery, pharmacokinetics, biodistribution and toxicity of iron oxide nanoparticles, Chem. Soc. Rev., 2015, 44, 8576–8607 RSC.
- J. S. Suk, Q. Xu, N. Kim, J. Hanes and L. M. Ensign, PEGylation as a strategy for improving nanoparticle-based drug and gene delivery, Adv. Drug Deliv. Rev., 2016, 99, 28–51 CrossRef CAS PubMed.
- M. Mirković, M. Radović, D. Stanković, Z. Milanović, D. Janković, M. Matović, M. Jeremić, B. Antić and S. Vranješ-Đurić, 99mTc-bisphosphonate-coated magnetic nanoparticles as potential theranostic nanoagent, Mater. Sci. Eng., C, 2019, 102, 124–133 CrossRef PubMed.
- M. B. Schütz, A. M. Renner, S. Ilyas, K. Lê, M. Guliyev, P. Krapf, B. Neumaier and S. Mathur, 18F-Labeled magnetic nanovectors for bimodal cellular imaging, Biomater. Sci., 2021, 9, 4717–4727 RSC.
- J. Majeed, K. C. Barick, N. G. Shetake, B. N. Pandey, P. A. Hassan and A. K. Tyagi, Water-dispersible polyphosphate grafted Fe3O4 nanomagnets for cancer therapy, RSC Adv., 2015, 5, 86754–86762 RSC.
- R. Chakravarty, A. Rajeswari, P. Shetty, K. C. Jagadeesan, R. Rama, S. Jadhav, H. D. Sarma, A. Dash and S. Chakraborty, A simple and robust method for radiochemical separation of no-carrier-added 64Cu produced in a research reactor for radiopharmaceutical preparation, Appl. Rad. Isot., 2020, 165, 109341 CrossRef CAS.
- S. Chakraborty, K. S. Sharma, A. Rajeswari, K. V. Vimalnath, H. D. Sarma, U. Pandey, J. Jagannath, R. S. Ningthoujam, R. K. Vatsa and A. Dash, Radiolanthanide-loaded agglomerated Fe3O4 nanoparticles for possible use in the treatment of arthritis: formulation, characterization and evaluation in rats, J. Mater. Chem. B, 2015, 3, 5455–5466 RSC.
- M. Parsian, G. Unsoy, P. Mutlu, S. Yalcin, A. Tezcaner and U. Gunduz, Loading of gemcitabine on chitosan magnetic nanoparticles increases the anti-cancer efficacy of the drug, Eur. J. Pharmacol., 2016, 784, 121–128 CrossRef CAS PubMed.
- K. Affram, O. Udofot, A. Cat and E. Agyare, In vitro and in vivo antitumor activity of gemcitabine loaded thermosensitive liposomal nanoparticles and mild hyperthermia in pancreatic cancer, Int. J. Adv. Res., 2015, 3, 859–874 CAS.
- K. O. Affram, T. Smith, E. Ofori, S. Krishnan, P. Underwood, J. G. Trevino and E. Agyare, Cytotoxic effects of gemcitabine-loaded solid lipid nanoparticles in pancreatic cancer cells, J. Drug Del. Sci. Technol., 2020, 55, 101374 CrossRef CAS PubMed.
- E. K. Lim, Y. M. Huh, J. Yang, K. Lee, J. S. Suh and S. Haam, pH-triggered drug releasing magnetic nanoparticles for cancer therapy guided by molecular imaging by MRI, Adv. Mater., 2011, 23, 2436–2442 CrossRef CAS PubMed.
- T. J. Higuchi, Mechanism of sustained-action medication. theoretical analysis of rate of release of solid drugs dispersed in solid matrices, J. Pharm. Sci., 1963, 52, 1145–1149 CrossRef CAS PubMed.
- F. Mottaghitalab, M. Kiani, M. Farokhi, S. C. Kundu, R. L. Reis, M. Gholami, H. Bardania, R. Dinarvand, P. Geramifar, D. Beiki and F. Atyabi, Targeted delivery system based on gemcitabine loaded silk fibroin nanoparticles for lung cancer therapy, ACS Appl. Mater. Interfaces, 2017, 9, 31600–31611 CrossRef CAS PubMed.
- A. Pourjavadi, Z. M. Tehrani and A. A. Moghanaki, Folate-conjugated pH-responsive nanocarrier designed for active tumor targeting and controlled release of gemcitabine, Pharm. Res., 2016, 33, 417–432 CrossRef CAS PubMed.
- J.-T. Dai, Y. Zhang, H.-C. Li, Y.-H. Deng, A. A. Elzatahry, A. Alghamdi, D.-L. Fu, Y.-J. Jiang and D.-Y. Zhao, Enhancement of gemcitabine against pancreatic cancer by loading in mesoporous silica vesicles, Chin. Chem. Lett., 2017, 28, 531–536 CrossRef CAS.
- C. A. Dasanu, Gemcitabine: vascular toxicity and prothrombotic potential, Expert Opin. Drug Saf., 2008, 7, 703–716 CrossRef CAS.
- N. V. Jadhav, A. I. Prasad, A. Kumar, R. Mishra, S. Dhara, K. R. Babu, C. L. Prajapat, N. L. Misra, R. S. Ningthoujam, B. N. Pandey and R. K. Vatsa, Synthesis of oleic acid functionalized Fe3O4 magnetic nanoparticles and studying their interaction with tumor cells for potential hyperthermia applications, Colloids Surf., B, 2013, 108, 158–168 CrossRef CAS PubMed.
- N. Saxena, H. Agraval, K. C. Barick, D. Ray, V. K. Aswal, A. Singh, U. C. S. Yadav and C. L. Dube, Thermal and microwave synthesized SPIONs: Energy effects on the efficiency of nano drug carriers, Mater. Sci. Eng., C, 2020, 111, 110792 CrossRef CAS PubMed.
- F. Qi, R. Liao, Y. Shuai, H. Pan, G. Qian, S. Peng and C. Shuai, A conductive network enhances nerve cell response, Addit. Manuf., 2022, 52, 102694 CAS.
- C. Shuai, G. Liu, Y. Yang, F. Qi, S. Peng, W. Yang, C. He, G. Wang and G. Qian, A strawberry-like Ag-decorated barium titanate enhances piezoelectric and antibacterial activities of polymer scaffold, Nano Energy, 2020, 74, 104825 CrossRef CAS.
- P. Feng, P. Wu, C. Gao, Y. Yang, W. Guo, W. Yang and C. Shuai, A multimaterial scaffold with tunable properties: toward bone tissue repair, Adv. Sci., 2018, 5, 1700817 CrossRef PubMed.
- N. Vasanth, G. Melchias and P. Kumaravel, Biogenic silver nanoparticles mediated by Broussonetia papyrifera: Anticancer and antimicrobial activity against pathogenic organisms, Asian J. Pharm. Clin. Res., 2017, 10, 93–98 CAS.
- J. J. Farrell, H. Elsaleh, M. Garcia, R. Lai, A. Ammar, W. F. Regine, R. Abrams, A. B. Benson, J. Macdonald, C. E. Cass, A. P. Dicker and J. R. Mackey, Human equilibrative nucleoside transporter 1 levels predict response to gemcitabine in patients with pancreatic cancer, Gastroenterology, 2009, 136, 187–195 CrossRef.
- S. Singh, K. C. Barick and D. Bahadur, Surface engineered magnetic nanoparticles for removal of toxic metal ions and bacterial pathogens, J. Hazad. Mater., 2011, 192, 1539–1547 CrossRef CAS.
- H. Xu, L. Cheng, C. Wang, X. Ma, Y. Li and Z. Liu, Polymer encapsulated upconversion nanoparticle/iron oxide nanocomposites for multimodal imaging and magnetic targeted drug delivery, Biomaterials, 2011, 32, 9364–9373 CrossRef CAS PubMed.
- F. M. Kievit, Z. R. Stephen, O. Veiseh, H. Arami, T. Wang, V. P. Lai, J. O. Park, R. G. Ellenbogen, M. L. Disis and M. Zhang, Targeting of primary breast cancers and metastases in a transgenic mouse model using rationally designed multifunctional SPIONs, ACS Nano, 2012, 6, 2591–2601 CrossRef CAS PubMed.
- J. Huang, L. Bu, J. Xie, K. Chen, Z. Cheng, X. Li and X. Chen, Effects of nanoparticle size on cellular uptake and liver MRI with polyvinylpyrrolidone-coated iron oxide nanoparticles, ACS Nano, 2010, 4, 7151–7160 CrossRef CAS PubMed.
- X. H. Peng, X. Qian, H. Mao, A. Y. Wang, Z. G. Chen, S. Nie and D. M. Shin, Targeted magnetic iron oxide nanoparticles for tumor imaging and therapy, Int. J. Nanomed., 2008, 3, 311–321 CAS.
Footnote |
| † Electronic supplementary information (ESI) available: Materials, synthesis and structural characterization, drug loading and release studies, cytotoxicity, cellular uptake and cell death studies, zeta-potential, time dependent variations of hydrodynamic diameter, UV-visible absorption spectra, cell viability, Prussian blue staining, pseudo first order kinetic model fitting and percentage of radioactivity leached plots, and protein–particle interaction data (Fig. S1–S7 and Table S1). See DOI: https://doi.org/10.1039/d2ma00647b |
| This journal is © The Royal Society of Chemistry 2023 |


