 Open Access Article
The effect of rare earth (RE3+) ionic radii on transparent lanthanide-tellurite glass-ceramics: correlation between ‘hole-formalism’ and crystallization†
Pritha
Patra
ab,
K.
Jayanthi
 c,
Fabian
Margit
d,
Shweta R.
Keshri
e,
Sandip
Bysakh
f,
Kaushik
Biswas
 ab,
Nitya Nand
Gosvami
e,
N. M. Anoop
Krishnan
 g,
Amarnath R.
Allu
 bh and
K.
Annapurna
 *ab
*ab
aSpecialty Glass Division, CSIR-Central Glass and Ceramic Research Institute, 196, Raja S. C. Mullick Road, Kolkata 700 032, India. E-mail: annapurnak@cgcri.res.in; Fax: +91-33-24730957; Tel: +91-33-24733496
bAcademy of Scientific and Innovative Research (AcSIR), CSIR-Human Resource Development Centre, (CSIR-HRDC) Campus, Postal Staff College Area, Sector 19, Kamla Nehru Nagar, Ghaziabad, Uttar Pradesh-201 002, India
cChemical Sciences Division, Oak Ridge National Laboratory, Oak Ridge, TN 37831, USA
dCentre for Energy Research, Konkoly-Thege st. 29-33 1121, Budapest, Hungary
eDepartment of Materials Science and Engineering, Indian Institute of Technology Delhi, Hauz Khas, New Delhi 10016, India
fAdvanced Material Characterization Unit, Material Characterization Division, CSIR-Central Glass and Ceramic Research Institute, 196 Raja S. C. Mullick Road, 700032, Kolkata, India
gDepartment of Civil Engineering, Indian Institute of Technology Delhi, Hauz Khas, New Delhi 10016, India
hEnergy Materials and Devices Division, CSIR-Central Glass and Ceramic Research Institute, 196 Raja S C Mullick Road, 700032, Kolkata, India
First published on 2nd June 2023
Abstract
Rare earth (RE) doped transparent tellurite glass-ceramics (GCs) are widely explored for their application as advanced photonic materials. Specifically, the growth of RE based “anti-glass” crystalline phases in transparent GCs enhances their effective functionality. Enormous studies on the properties of GCs revealed that optimization of glass composition and heat-treatment schedule are the foremost factors that affect the transparency of the GCs. Nevertheless, the direct effect of RE3+ ions on the crystallization mechanism of glass has hardly been reported. Therefore, a base glass of the composition La2O3–Gd2O3–TiO2–TeO2 (LGTT) is doped with RE3+ ions (Ce3+, Pr3+, Nd3+, Sm3+, Eu3+, Tb3+, and Dy3+) with varied ionic radii. Rietveld refinement from XRD of GCs confirms that (La/Gd)2Te6O15 phases are precipitated, where dopants Ce, Pr and Nd occupy La sites, while Sm, Eu, Tb, and Dy occupy Gd sites. The configurational heat-capacity (ΔCp) from DSC is found to be lower for larger ionic radii REs (Ce, Pr, Nd) than smaller ionic radii REs (Sm, Eu, Tb, Dy) thereby exhibiting higher chemical ordering followed by faster crystal growth rate in the former. However, the transparency retention profile of different RE-doped GCs follows the trend Eu:Tb > Sm:Dy > Nd > Pr > Ce, confirming the ionic radii effect. In addition to the ionic radii effect, in this work, we propose a ‘Hole-Formalism’ concept to explain the observed trend. It is further corroborated with an identical neutron diffraction pattern and ΔCp values for these ion pairs Sm3+![[thin space (1/6-em)]](https://www.rsc.org/images/entities/char_2009.gif) :
:![[thin space (1/6-em)]](https://www.rsc.org/images/entities/char_2009.gif) Dy3+ (4f5
Dy3+ (4f5![[thin space (1/6-em)]](https://www.rsc.org/images/entities/char_2009.gif) :
:![[thin space (1/6-em)]](https://www.rsc.org/images/entities/char_2009.gif) 4f9) and Eu3+
4f9) and Eu3+![[thin space (1/6-em)]](https://www.rsc.org/images/entities/char_2009.gif) :
:![[thin space (1/6-em)]](https://www.rsc.org/images/entities/char_2009.gif) Tb3+ (4f6
Tb3+ (4f6![[thin space (1/6-em)]](https://www.rsc.org/images/entities/char_2009.gif) :
:![[thin space (1/6-em)]](https://www.rsc.org/images/entities/char_2009.gif) 4f8) results in a similar crystallization mechanism, transmission profile and fine-scale microstructures of these RE-based tellurite GCs.
4f8) results in a similar crystallization mechanism, transmission profile and fine-scale microstructures of these RE-based tellurite GCs.
1. Introduction
Transparent GCs are the most promising low-cost alternative to single crystals to achieve a range of advanced photonic applications like high power lasers,1,2 light-emitting diodes (LEDs),3,4 up-conversion and down-conversion materials,5 amplifiers,6 telescope mirrors,7 solar concentrators,8 and optical security.9,10 Certainly, transparent GCs obtained from simple but controlled heat-treatment of glass offer better optical transparency compared to commercially available transparent ceramics (Nd:YAG, Yb:Sc2O3/Y2O3/Lu2O3) due to the possibility of tuneable micro structuring, low birefringent light scattering at grain boundaries and the absence of any porosity.11,12 On that ground, transparent tellurite GCs with an extended transparency window (up to ∼6 μm) and low phonon energy (∼780 cm−1) fabricated through controlled heat-treatment of TeO2-glass is a suitable host for NIR to mid-IR photonic applications. In fact, such a wide optical window is far beyond the ability of other conventional oxide glass matrixes (silicate, aluminate, borate, phosphate).13Another specialty of tellurite glass is that it allows the precipitation of “anti-glass” type (KNbO6, Bi0.8Nb0.8Te2.4O8, Bi2Te4O11, Te0.2Zr0.3F0.9O0.55, SrTe5O11, PbTe3O7, Ln2Te6O15, Ln2Te5O13, and Ln2Te4O11) intriguing structure crystallites.14–17 As there is no sharp contrast between the structure of glass and the precipitated “anti-glass” crystalline phase, the GCs containing “anti-glass” phases are advantageous for retention of transparency even with relatively larger crystallite sizes. The concept of an “anti-glass” phase has been described in our previous publications.13,18 Additionally, these lanthanide-based crystallites (Ln2Te6O15) can directly incorporate active RE-dopant ions thereby providing a sufficiently low phonon environment around them, which improves their emission cross-section and lifetime.15–20 Furthermore, the diffused phase boundary between the “anti-glass” and glassy phase helps in forbidding light scattering thus allowing the design of a large variety of GCs which has the potential for commercialization.21
As per the reported articles including our previous studies, lanthanide tellurite glasses containing higher content (∼10 mol%) of Ln2O3 (where Ln = La or Gd) which is further substituted by active RE3+ dopant ions have the ability to exhibit MIR emission.22,23 Fujimoto et al.24 have studied the effect of RE3+ ionic size on the crystallization of the 10La2O3-10BaO-80TeO2 glass matrix and reported that transparent GCs can be obtained if the ionic size of the dopant RE3+ is small. In contrast, another research group found that crystallization of relatively small ionic radii Eu3+ doped (80 − x)TeO2–10La2O3–10TiO2 (where x is mol% of dopant) glass leads to the formation of non-transparent GCs containing TeTi3O8 crystallites.25 As a consequence, there is discrepancy in understanding the influence of RE3+ ionic size on crystallite size and retention of transparency in lanthanide-tellurite GCs. Thus study in this direction gives insights into the influence of ionic radii of RE3+ ions on the microstructure and crystallization mechanism of lanthanide-tellurite GCs.
According to the molecular orbital theory, some of the electronic properties, which majorly include energy states and their micro-states under the influence of a crystal field, of a system with x-number of unpaired electrons are similar to the system with an equal (x) number of holes.26,27 This is generally called ‘Hole-Formalism’, which is an established concept in the case of transition metal ions. Upon extension of ‘Hole-Formalism’ theory for lanthanides, pairs of elements with 4fn and 4f14−n electronic configurations exhibit the same number of micro-states. This might suggest that the lanthanides/REs that are obeying the ‘Hole-Formalism’ occupy the same local field symmetry in glass or GCs. Therefore, it is expected that RE ‘Hole-Pairs’ may show a similar crystallization tendency. To the best of the authors knowledge there have been no studies carried out addressing this aspect. Understanding the influence of ‘Hole-Formalism’ on crystallization behaviour certainly helps to gain a comprehensive idea about the primary crystallization mechanism attained by a particular RE3+ ion pair. This assists in expediting the development of transparent tellurite GCs for various photonic applications through selecting the active ion and optimizing its concentration.
Here, we present two aspects: first, the effect of RE3+ (Ln = Ce3+, Pr3+, Nd3+, Sm3+, Eu3+, Tb3+, Dy3+) ionic radii on crystallization of lanthanide titanium tellurite glasses (Ln2O3–La2O3–Gd2O3–TiO2–TeO2) to yield transparent GCs, and second the correlation between the ‘Hole-Formalism’ and crystallization mechanism. The neutron diffraction measurements for Eu3+ and Tb3+ doped samples were performed to identify their effects in the glassy structure. Heat capacity and crystallization kinetics have been studied using differential scanning calorimetry (DSC). The fabricated glasses and GCs have been systematically characterized using X-ray diffraction (XRD), spectrometry (UV-Vis and FTIR), field emission scanning electron microscopy (FE-SEM) and analytical transmission electron microscopy (TEM).
2. Theory of ‘Hole-Formalism’
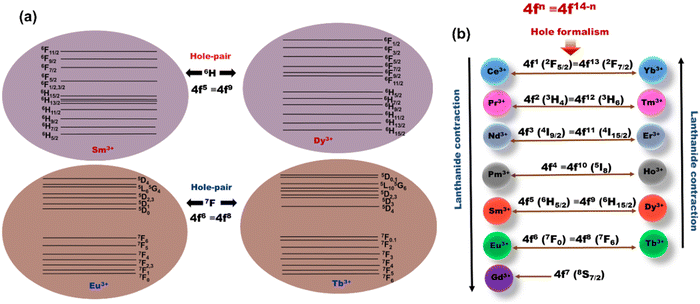
‘Hole-Formalism’ is a quantum mechanical concept which conveys that systems with equal number of electrons (e) or holes (h) exhibit identical 2S+1LJ atomic ground states (GS), where S and L are the spin and angular quantum number, respectively, and J = |L ± S|, and equal Russell–Saunders (RS) coupling term.28 Hence, systems obeying the ‘Hole-Formalism’ occupy the same crystal field symmetry and interact with the neighbouring atomic species in a similar fashion. For example, the number of unpaired electrons in Eu3+ (4f6) is equivalent to the number of holes in the Tb3+ (4f8) ions. Therefore, Eu3+ (4f6) and Tb3+ (4f8) ions possess the 7FJ energy level as the ground state, which in a crystal field degenerates into 7F|L−S|=0 to 7F|L+S|=6 levels (Fig. 1a). Accordingly, Eu3+ and Tb3+ are called the ‘Hole-Pair’ of each other, similarly, Sm3+ and Dy3+ (number e and h = 5) ions obey the ‘Hole-Formalism’ and display an identical GS term 6HJ and degenerate in 6H|L−S|=5/2 to 6H|L+S|=15/2 levels (Fig. 1a). A pictorial diagram depicting the ‘Hole-Pairs’(4fn ≡ 4f14−n) from lanthanide (4f elements) and their GS term symbols is given in Fig. 1b. In general, ‘Hole-Formalism’ exhibits a significant effect on the chemical complexing or spectroscopic properties of p- and d-block elements as these orbitals are more exposed to a ligand field. The concept of ‘Orgel diagram’ for the coordination geometry of d-elements is purely based on ‘Hole-Formalism’ theory. Since the f-electrons in the valence shell are shielded by the electrons in p and s orbitals, it is a well-known concept that the f-block elements are insensitive towards ligand field interaction. However, it has been observed that some of the energy transitions (5D0 → 7F0,2) in Eu3+ ions are sensitive to the ligand field and these transitions are found to split differently depending on crystal field symmetry.29 Furet et al.30 have also reported a significant effect of the ligand field and geometry on f-orbital electron density on the reactivity of f-block elements. Therefore, in this work we attempt to identify the influence of RE3+ ions ‘Hole-Formalism’ on the crystallization of lanthanide-tellurite glass.3. Experimental
3.1. Procedure of glass and glass-ceramics fabrication
A tellurite glass of composition 5La2O3–5Gd2O3–10TiO2–80TeO2 (LGTT) (in mol%) was prepared by using a conventional melt-quenching technique. Different lanthanide oxides (Ln2O3) where Ln = Ce, Pr, Nd, Sm, Eu, Tb, and Dy were doped with 2 mol% in this glass by replacing an equivalent amount of La2O3 and were named LGTT-Ce2, LGTT-Pr2, LGTT-Nd2, LGTT-Sm2, LGTT-Eu2, LGTT-Tb2, and LGTT-Dy2, respectively. The fine chemicals (powder): TeO2 (Alfa Aesar, 99.99%), TiO2 (Sigma-Aldrich, 99.999%), Gd2O3 (Sigma-Aldrich, 99.99%), La2O3 (Alfa Aesar, 99.99%), CeO2 (Alfa Aesar, 99.99%), Pr6O11 (Alfa Aesar, 99.99%), Nd2O3 (Sigma-Aldrich, 99.99%), Sm2O3 (Alfa Aesar, 99.99%), Eu2O3 (Alfa Aesar, 99.99%), Dy2O3 (Alfa Aesar, 99.99%) and Tb2O3 (Alfa Aesar, 99.99%) were taken as the raw materials. The required amounts of each chemical were weighed and melted in a pure platinum crucible at 950 °C with three intermittent stirring at a twenty-minute interval followed by quenching onto a preheated (380 °C) graphite mould so as to yield 10 g glass. These cast glasses were immediately transferred to an annealing furnace maintained at 380 °C for 2 hours and cooled down to room temperature. As confirmed from XRD (Fig. S1, ESI†), all the glasses synthesized for the present study are X-ray amorphous in nature. Glasses were cut and finely polished at 2 mm thickness plates, which have been ceramized using a two-step heat-treatment schedule with nucleation at 400 °C for 1 h followed by crystal growth at 450 °C for a 3-, 24-, and 36 hour time period for GCs synthesis.3.2. Description of thermal, optical, structural and microstructural characterization techniques
Differential Scanning Calorimetric (DSC) data were recorded from RT to 850 °C under a N2 atmosphere at heating rates of 10, 20, 30 and 40 K min−1 with glass powder (53–70 micron) of mass ∼30 mg using a Netzsch DSC thermal analyser (Model: 404 F3 Pegasus).Neutron diffraction (ND) experiments of LGTT-Eu2 and LGTT-Tb2 glasses were performed on a 2-axis ‘PSD’ monochromatic neutron diffractometer (λ0 = 1.068 Å) at the 10 MW Budapest research reactor in the momentum transfer range Q = 0.5–10 Å−1. The powder specimens of about 3–4 g/each were filled in a thin-walled cylindrical vanadium sample holder of 8 mm diameter for the neutron experiments. Data were corrected for detector efficiency, background scattering and absorption effects.
X-Ray diffraction was carried out on bulk glasses and GCs using an X-ray diffractometer (Model: Rigaku Ultima IV, Japan) with Cu Kα1 as the radiation source with λ = 1.5458 Å, at a continuous scan rate of 6° min−1. The precipitated crystalline phases in synthesized GCs have been identified using the PDF4+ database.
The absorption spectra (200–2500 nm spectral region) and transmission spectra (2.5–25 μm) of the respective glasses and GCs were recorded using a UV-Vis-NIR spectrophotometer (Model: 3101 from Shimadzu, Japan) and FTIR spectrophotometer (Model: Frontier FIR MIR from PerkinElmer, USA) respectively.
Field Emission Scanning Electron Microscopy (FE-SEM) (Zeiss Supra 35 VP model of Carl Zeiss Micro-imaging GmbH, Berlin, Germany) was used to perceive the micro-structural crystallite morphology of both the top and inner surface (both the surface of GCs was ground up to 0.5 mm) of bulk GCs, and for that the respective surfaces were suitably etched with 2 volume %HF solution for ∼2 minutes.
The nano/micro-structures of glass and GC samples were investigated using a transmission electron microscope (TEM; FEI Model Tecnai G2 30ST; Hillsboro, OR, USA) fitted with an EDS X-ray spectrometer composition analyser (EDAX Inc., USA). The electron transparent specimens suitable for TEM measurements were prepared adopting an ion-milling method by punching out 2.3 mm diameter disc samples from a 0.25 mm thin glass slice using an ultrasonic disc cutter. These punched out discs were mounted with Gatan G1 epoxy (Gatan Inc., USA), inside a brass or stainless steel tube section of similar thickness and with inner and outer diameters of 2.7 mm and 3 mm, respectively. Each sample was then ground down to about 90–100 microns using a Gatan disc grinder (Gatan Inc., USA) followed by dimple grinding and polishing, using a Gatan dimple grinder (Gatan Inc., USA), to further reduce the thickness at its center down to about 30 microns. Finally, the dimpled samples were argon ion-polished using a Gatan 691 Precision Ion-Polishing System (PIPS, Gatan Inc., USA) to obtain electron transparency around perforations at the centre of the dimpled specimens for TEM characterization.
4. Results and discussion
4.1 Neutron diffraction and reverse Monte Carlo simulations for LGTT-Eu2 and LGTT-Tb2 glasses
The neutron diffraction experiments were carried out for LGTT-Eu2 and LGTT-Tb2 glass samples to obtain short-range structural information including atomic distribution, coordination number and bond lengths. The total structure factor, SEXP(Q) obtained from the neutron diffraction (ND) experiment for LGTT-Eu2 and LGTT-Tb2 glasses are shown in Fig. 2 (blue dots). This figure also depicts the simulated total structure factor, SRMC(Q) derived from Reverse Monte Carlo (RMC) simulation for comparison (black coloured line).18,31 The details of RMC simulations along with the RMC algorithm are provided in the ESI.†Fig. 2 confirms that the structure factor S(Q) estimated through RMC simulations for both the glasses are in good agreement with the experimental data. Therefore, the RMC algorithm is utilized to calculate partial atomic pair correlation functions gij(r), and coordination number (CNij) distributions with fairly good certainties. Estimated gij(r) and CNij distribution plots of LGTT-Eu2 and LGTT-Tb2 glasses for Te–O, Ti–O, O–O, La–O and RE–O (RE = Eu, Tb) bonds are presented in Fig. 3 and Fig. S2 (ESI†) respectively.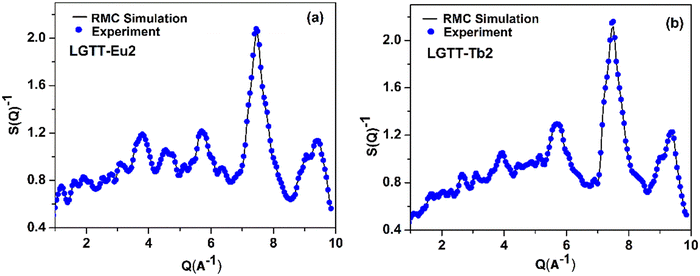 | ||
| Fig. 2 Neutron diffraction structure factor together with RMC fit of (a) LGTT-Eu2 and (b) LGTT-Tb2 glass. | ||
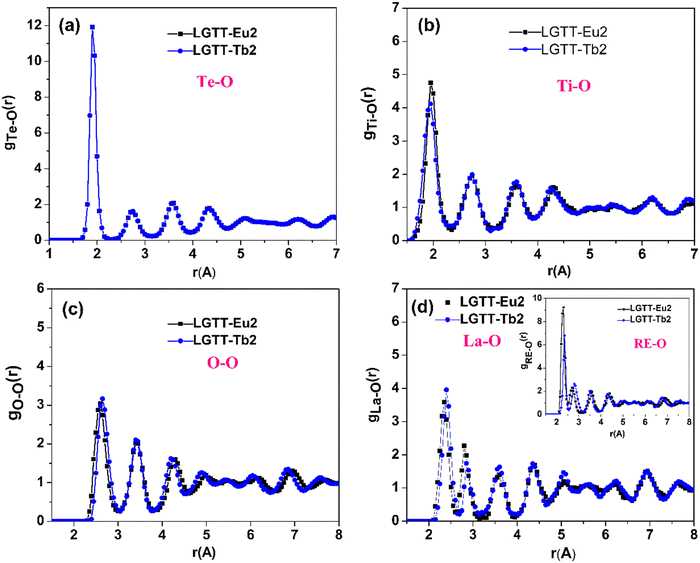 | ||
| Fig. 3 Atomic pair-correlation functions (gij(r)) for (a) Te–O, (b) Ti–O, (c) O–O, (d) La–O and RE–O (where RE = Eu, Tb) of LGTT-Eu2 and LGTT-Tb2 glass. | ||
Fig. 3 presents atomic pair-correlation function profiles for both LGTT-Eu2 and LGTT-Tb2 glasses. From the figure the diffraction pattern is found to be similar for Eu3+ and Tb3+ doped glasses. The obtained Te–O, Ti–O, La–O and RE–O (where RE = Eu and Tb) bond length, and oxygen co-ordination numbers for Te, Ti, and La from the RMC simulations are tabulated in Table 1. The data reveals that Te–O, Ti–O, La–O and RE–O bond lengths and coordination number distributions for the elements present in LGTT-Eu2 and LGTT-Tb2 glasses are almost similar considering the error limit. The estimated covalent bond length of 1.90 ± 0.02 Å for Te–O for both the glasses indicates a good agreement with the Te–O bond length values measured for other TeO2 based glasses.31–34 The average coordination number distribution analysis proves that Te and Ti atoms exist in 4-fold coordination, similar to the undoped glass (LGTT, CN = 4.11 ± 0.05).18 Coordination number estimated for La and other RE3+ ions Gd, Eu and Tb confirms that RE are in 6-fold octahedral coordination. Therefore, it could be assessed that the spatial distribution of structural units in LGTT glass is unaltered with the substitution of europium and terbium oxides for lanthanum oxide.
| Sample name | Te–O | Ti–O | O–O | La–O | RE–O | |
|---|---|---|---|---|---|---|
| LGTT-Eu2 | Bond length (Å) | 1.90 ± 0.02 | 1.90 ± 0.05 | 2.60 ± 0.03 | 2.35 ± 0.02 | 2.30 ± 0.02 |
| Coordination number (CN) | 4.08 ± 0.05 | 3.88 ± 0.05 | 5.07 ± 0.05 | 6.29 ± 0.05 | ||
| LGTT-Tb2 | Bond length (Å) | 1.90 ± 0.02 | 1.90 ± 0.05 | 2.60 ± 0.03 | 2.38 ± 0.02 | 2.35 ± 0.02 |
| CN | 4.00 ± 0.05 | 3.89 ± 0.05 | 5.27 ± 0.05 | 6.20 ± 0.05 | ||
4.2 Glass transition
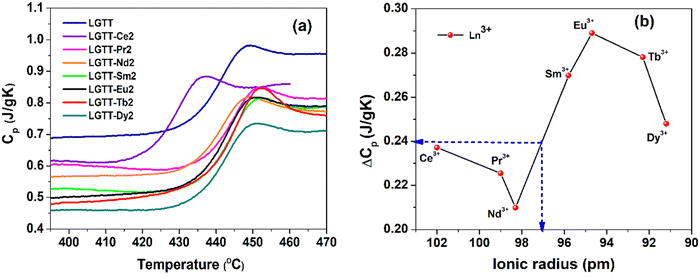
The glass transition temperature (Tg) of a glassy material depends on the network connectivity and the average bond strength. The variation in glass structure, depends on the chemical composition of the glass, and this reflects the variation in the Tg values. The Tg values for all the glasses were measured using isobaric calorimetric heat capacity measurements. Fig. 4a shows the variations in the heat capacity (Cp) as a function of temperature for all the respective glasses recorded during the DSC up-scans at 20 K min−1. From these Cp curves, we have calculated Tg, Tg,offset, glass transition width (ΔTg) and ΔCp (= Cpl − Cpg) values and they are tabulated in Table 2.35Tg and Tg,offset represents the standard calorimetric glass transition temperature and the offset temperature of the Cp overshoot in the glass transition zone, respectively, whereas, Cpl and Cpg are the offset values of the Cp overshoot and the Cp value at Tg, respectively.36,37 The ΔCp values represents the configurational heat capacity.36,37 The methodology used to identify and calculate these values are presented in Fig. S3 (ESI†), using the LGTT-Eu2 glass as an example. Within the experimental error, the measured Tg values for all the glasses lie at around 434 °C, except for LGTT-Ce2 glass that has a Tg value around 421 °C. This indicates that the RE3+ cation radius has negligible influence on the modifications in the network connectivity and average bond strength of LGTT glass. However, the ΔT values of doped glasses are smaller than undoped LGTT glass,18 defining an increase in crystallization tendency after doping.| Glass name | T g | T g,offset | ΔTg | ΔCp (J g−1 K−1) |
|---|---|---|---|---|
| LGTT18 | 434 | 475 | 41 | 0.2450 |
| LGTT-Ce2 | 421 | 447 | 25 | 0.2372 |
| LGTT-Pr2 | 436 | 467 | 31 | 0.2255 |
| LGTT-Nd2 | 432 | 465 | 33 | 0.2099 |
| LGTT-Sm2 | 437 | 463 | 26 | 0.2698 |
| LGTT-Eu2 | 434 | 463 | 29 | 0.2890 |
| LGTT-Tb2 | 436 | 464 | 28 | 0.2781 |
| LGTT-Dy2 | 434 | 463 | 29 | 0.2480 |
C p is the combination of vibrational (Cp,vib) and configurational (Cp,conf) degrees of freedom, i.e., Cp = (Cp,vib) + (Cp,conf). In general, a material in the condensed glassy state contains only a vibrational degree of freedom. Therefore, the heat capacity at Tg is nearly equivalent to the vibrational heat capacity, i.e., Cpg ≅ Cp,vib. With an increase in the temperature, the glass system turns into a liquid state, which contains both vibrational and configurational degrees of freedom. Thus, the heat capacity Cpl at liquidus temperature, Tg,offset turns into Cpl = Cp,vib + Cp,conf. For a glassy system, the Cp,vib is equivalent to Cpg. Therefore, the aforementioned relation can be expressed as Cp,conf = Cpl − Cpg.37 This validates that the configurational heat capacity Cp,conf is approximately equivalent to that of the ΔCp. The variations in ΔCp as a function of RE3+ cationic radius in LGTT glass is shown in Fig. 4b. The undoped LGTT glass exhibits a ΔCp value of 0.245 J g−1 K−1 (Fig. 4a). The lowest ΔCp value of 0.21 J g−1 K−1 is obtained for the LGTT-Nd2 glass and the highest value of 0.29 J g−1 K−1 is obtained for the LGTT-Eu2 glass. Fig. 4b shows that the ΔCp value of 0.245 J g−1 K−1 for LGTT glass represents an effective ionic radius of around 97 pm. Therefore, we have considered 97 pm as the boundary for comparison purposes. Fig. 4b reveals that the LGTT glass containing RE3+ cations (Sm3+, Eu3+, Tb3+, and, Dy3+) of less than 97 pm ionic radius exhibit high ΔCp values compared with the undoped LGTT glass, whereas the RE3+ (Ce3+, Pr3+ and Nd3+) cations of greater than 97 pm ionic radius doping exhibit low ΔCp values.
4.3 Crystallization mechanism
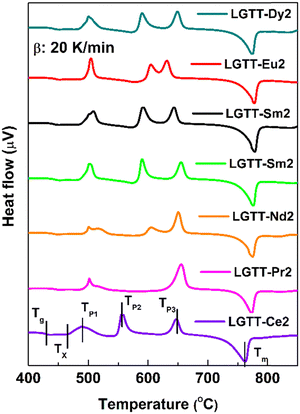
To understand the influence of RE3+ ion radius on the crystallization mechanism of the LGTT glass, the activation energy for the crystallization and Avrami parameter (n) were evaluated using a non-isothermal crystallization method upon executing different heating rates. These two parameters describe the nucleation and growth mechanism of crystals in materials. The DSC thermograms for all the glasses which were recorded at a heating rate (β) of 10, 20, 30 and 40 K min−1 are shown in Fig. S4 (ESI†). All the thermal characteristic temperatures like glass transition temperature (Tg), crystallization onset temperature (Tx1), first crystallization peak temperature (TP1), and melting point (Tm) have been tabulated in Table S1 (ESI†). Fig. 5 shows the DSC thermograms for all the glasses recorded at a heating rate of 20 K min−1.The procedure followed for the crystallization kinetics analysis of all the glasses is mentioned in previous articles,18,22 the details of which are also mentioned in the ESI.† The estimated crystallization kinetic parameters such as activation energy (Ea) for crystallization, Avrami parameter (n) and crystallization dimensionality parameter (m) for all the glasses are tabulated in Table 3. The activation energies for all the glasses were calculated using the slopes of least-square fitted lines to the ln(β/Tp2) vs. (1000/Tp) plots, where Tp is the crystallization peak temperature (Fig. 6a). Whilst, the n values for all the glasses were measured from the slope of ln(−ln(1 − x)) vs. ln(β) plot at a specific temperature, where x is the crystallization volume fraction (x = AT/A; A = overall crystallization peak area and AT = area of crystallization peak covering the temperature region of concern within the crystallization peak). It is to be noted that the n values measured for all the glasses are an average of slope values measured at three different temperatures. The crystallization dimensionality parameter, m, was measured from the slopes of ln(βn/Tp2) vs. ln(Ea/nRTp). The method of calculating n and m values is shown in Fig. 6b and c for LGTT-Pr2 glass. Table 3 portrays that systematic variation in activation energy (Ea) with decreasing the RE3+ ion cation radius from Ce3+ to Dy3+ is absent. The obtained m values for all the glasses are equivalent to the n values indicating that the crystal growth occurs on a fixed number of nuclei. The Avrami index n is approximately equivalent to 1 for Ce and Pr containing glasses and is equivalent to ∼1.7 for the rest of the glasses. These values indicate that the nucleation and crystal growth mechanism in Ce and Pr containing glasses represents diffusion-controlled crystal growth with zero nucleation rate whilst diffusion-controlled crystal growth with decreasing nucleation rate is prevalent in the case of Nd, Sm, Eu, Tb and Dy containing glasses.38 Based on the crystallization kinetics analysis for several glass systems existing in the literature, it is inferred that the diffusion-controlled crystal growth mechanism along with a decreasing nucleation rate limits the size of the crystallites and may eventually lead to transparent GCs.39–41 Therefore, on the implementation of a suitable heat treatment schedule, it could be anticipated that the transparent GCs could be obtained in the case of the LGTT glass containing Nd, Sm, Eu, Tb and Dy. Based on our previous report, the following two step heat treatment schedule was implemented for the production of transparent GCs: nucleation at 400 °C for 1 h followed by crystal growth at 450 °C for 3 h, 24 h and 36 h.18
| Glass | E a | n | m | Crystallization mechanism |
|---|---|---|---|---|
| LGTT-Ce2 | 442 ± 28 | 0.95 ± 0.07 | 0.91 | Diffusion controlled growth, zero nucleation rate |
| LGTT-Pr2 | 482 ± 2 | 0.97 ± 0.50 | 0.94 | Diffusion controlled growth, zero nucleation rate |
| LGTT-Nd2 | 394 ± 32 | 1.56 ± 0.04 | 1.52 | Diffusion controlled growth, decreasing nucleation rate |
| LGTT-Sm2 | 321 ± 7 | 1.7 ± 0.25 | 1.68 | Diffusion controlled growth, decreasing nucleation rate |
| LGTT-Eu2 | 338 ± 3 | 1.7 ± 0.08 | 1.73 | Diffusion controlled growth, decreasing nucleation rate |
| LGTT-Tb2 | 354 ± 10 | 1.8 ± 0.09 | 1.83 | Diffusion controlled growth, decreasing nucleation rate |
| LGTT-Dy2 | 295 ± 16 | 1.69 ± 0.42 | 1.69 | Diffusion controlled growth, decreasing nucleation rate |
4.4 X-Ray diffraction (XRD)
X-Ray diffraction (XRD) patterns of all the glasses and GCs heat-treated at 450 °C for 3 h, 24 h and 36 h durations are shown in Fig. 7. The qualitative analysis for the crystalline phases precipitated in the GCs confirms the precipitation of two different lanthanide based cubic structured “anti-glass” La2Te6O15 and Gd2Te6O15 phases with the JCPDS file number JCPDS43-551 and JCPDS 37-1400, respectively. The XRD pattern of all the GCs are dominated by mainly two diffraction peaks arising from (111) and (200) lattice planes of the crystalline phases. The formation of “anti-glass” phases in glasses were well explained by Fujimoto et al.24 It is clear from Fig. 7a that the XRD patterns of LGTT GCs containing larger cationic radii REs (Ce, Pr) exhibit sharp diffraction peaks upon 3 h heat-treatment, while for the dopant ions Sm, Eu, Tb, and Dy there is a hollow along with the discrete diffraction peaks. Furthermore, for Ce3+ and Pr3+ ions the intensity of (200) hkl reflection increases compared to that of (111) reflection with an increase in the ceramization time up to 36 h (Fig. 7b and c). In contrast, smaller ionic radii REs, viz., Sm, Eu, Tb and Dy, exhibits systematic increase in intensity of both (111) and (200) hkl reflections with an increase in the heat-treatment duration from 3 h to 36 h due to the controlled decreasing nucleation rate, as detected from crystallization kinetics. The average crystallite size (D) of the nano-crystallites grown in 36 h GCs for all the dopant ions are calculated using Debye–Scherrer equation.18 | (1) |
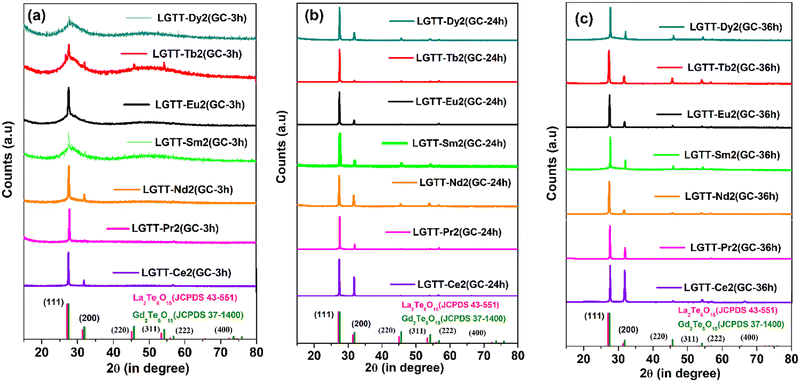 | ||
| Fig. 7 X-Ray diffraction (XRD) patterns of all the RE doped (a) 3 h, (b) 24 h, and (c) 36 h glass-ceramics. | ||
4.5 Rietveld analysis to confirm RE3+ inclusion within “anti-glass” crystallites
To extract the lattice parameters and space group of the precipitated “anti-glass” nano-crystalline phases, Rietveld refinement was employed for the XRD patterns collected for all the GCs. Least Squares refinement for two phases was done in sequence for the structure of LGTT GCs using the following JCPD files of La2Te6O15 (JCPDS 43-551) and Gd2Te6O15 (JCPDS 07-8472) phases. The constraint was added to restrict the sum of their phase fractions to be one. Later the lattice parameters and the phase fractions were refined, followed by the profile parameters (sample parameters and instrument parameters) including sample displacement, sample transparency, U, V, W, and X, Y for Gaussian and Lorentzian contributions. The atomic coordinates and site occupancy factors (SOF) were refined one atom at a time keeping the parameters of the other atoms fixed. This was done to obtain a stable refinement. The thermal parameters were constrained to be the same for atoms that occupied the same site (La/Te, Gd/Te, Gd/RE/Te, La/RE/Te) in all the compounds. Fit indicators, the R-values given in Table S2 (ESI†), were used to assess the quality of the refined structural models. The resultant fit is satisfactory with a featureless difference profile for all the dopant REs. Preliminary crystal structure information is provided in Table 4. Fig. 8 displays Rietveld fit of LGTT-Tb2(GC-36 h) GCs. The crystal structures are illustrated using CrystalMaker software and shown in Fig. S5 (ESI†).42,43| Sample | Chemical formula | Phase fraction | Unit cell dimensions | Volume (Å3) |
|---|---|---|---|---|
| LGTT-Ce2 | (La/Ce)2Te6O15 | 0.4342 | a = b = c = 5.8401(3) Å | 199.188(7) |
| α = β = γ = 90° | ||||
| Gd2Te6O15 | 0.5658 | a = b = c = 5.8066(2) Å | 195.782(5) | |
| α = β = γ = 90° | ||||
| LGTT-Pr2 | (La/Pr)2Te6O15 | 0.3718 | a = b = c = 5.6267(4) Å | 178.142(2) |
| α = β = γ = 90° | ||||
| Gd2Te6O15 | 0.5730 | a = b = c =5.4571(2) Å | 162.516(8) | |
| α = β = γ = 90° | ||||
| LGTT-Nd2 | (La/Nd)2Te6O15 | 0.4270 | a = b = c = 5.4623(2) Å | 162.975(3) |
| α = β = γ = 90° | ||||
| Gd2Te6O15 | 0.5730 | a = b = c = 5.4571(2) Å | 162.516(8) | |
| α = β = γ = 90° | ||||
| LGTT-Tb2 | La2Te6O15 | 0.3075 | a = b = c = 5.7250(2) Å | 187.630(5) |
| α = β = γ = 90 | ||||
| (Gd/Tb)2Te6O15 | 0.5714 | a = b = c =5.6150(3) Å | 177.031(2) | |
| α = β = γ = 90° | ||||
| LGTT-Sm2 | La2Te6O15 | 0.4286 | a = b = c = 5.6200(5) Å | 177.504(5) |
| α = β = γ = 90° | ||||
| (Gd/Sm)2Te6O15 | 0.5714 | a = b = c = 5.6150(3) Å | 177.031(2) | |
| α = β = γ = 90° | ||||
| LGTT-Dy2 | La2Te6O15 | 0.2994 | a = b = c = 5.5972(6) Å | 175.349(9) |
| α = β = γ = 90° | ||||
| (Gd/Dy)2Te6O15 | 0.7006 | a = b = c = 5.5963(3) Å | 175.267(2) | |
| α = β = γ = 90° |
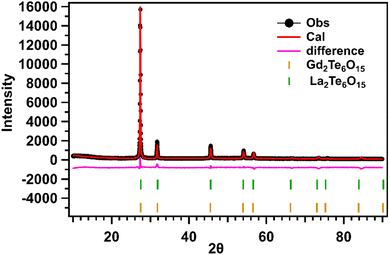 | ||
| Fig. 8 Rietveld fit of the XRD pattern of LGTT-Tb2(GC-36 h) glass-ceramics with Ln2Te6O15 (Ln = La/Gd) phases. | ||
Initially a single-phase refinement was attempted using the La2Te6O15 (JCPDS 43-551) file, by retaining all the rare earth elements (La, Gd, RE) in the same crystallographic site and varying the SOFs. Secondly a three-phase refinement was attempted using La2Te6O15, Gd2Te6O15, and RE2Te6O15 (RE = Pr, Nd, Sm, Tb, Dy). However, the overall fit and the R values were not good in both approaches. Later a two-phase refinement was attempted based on the previous results, however the challenge was to predict if the RE3+ (Ce3+, Pr3+, Nd3+, Sm3+, Eu3+, Tb3+, and Dy3+) ions preferred the La2Te6O15 or the Gd2Te6O15 phase. Although the RE was placed in either of the phases at a time and the refinement was attempted based on the goodness of fit and the difference profile, we conclude that the ionic radii of the RE places an important role in the preferring one phase over the other. REs (Sm, Tb, and, Dy) with an ionic radii less than 97 pm preferred the Gd2Te6O15 phase similar to Eu (95 pm) as reported in our previous work,18 and REs (Ce, Pr, and Nd) with higher than 97 pm preferred the La2Te6O15.
Refinement studies were also utilized to estimate the approximate fraction of each crystalline phase precipitated in the GCs. LGTT-Ce2 is comprised of 43.4% (La/Ce)2Te6O15 and 56.6% Gd2Te6O15, LGTT-Pr2 is comprised of 37.2% (La/Pr)2Te6O15 and 62.8% Gd2Te6O15. LGTT-Nd2 is comprised of 42.7% (La/Nd)2Te6O15 and 57.3% Gd2Te6O15. LGTT-Sm2 is comprised of 30.7% La2Te6O15 and 69.3% (Gd/Sm)2Te6O15. LGTT-Tb2 is comprised of 42.9% La2Te6O15 and 57.1% (Gd/Tb)2Te6O15. LGTT-Dy2 is comprised of 29.9% La2Te6O15 and 70.1% (Gd/Dy)2Te6O15. Incorporation of RE on either phase retains the transparency and increases the crystallinity.
4.6 Effect of RE3+ ionic radii on the transmission spectra of glass-ceramics
The transmission spectra from the visible to MIR region (0.43–6.5 μm) for all the glass and GCs are shown in Fig. 9. The respective images of the glass and GCs are also given in Fig. 9. The absorption peaks in Vis-NIR-MIR transmission spectra exhibit characteristic peaks of RE3+ dopant ions in the glass and GCs. GCs formed on implementation of 3 h heat treatment displays transmittance similar to their parent glasses irrespective of the doped RE3+ ion. Nevertheless, transmittance declines notably in GCs obtained after 24 h and 36 h heat-treatment. Hence, the effective influence of trivalent rare-earth (RE3+) ionic radii on the transmission of GCs is analysed considering only 24 h and 36 h heat-treated samples.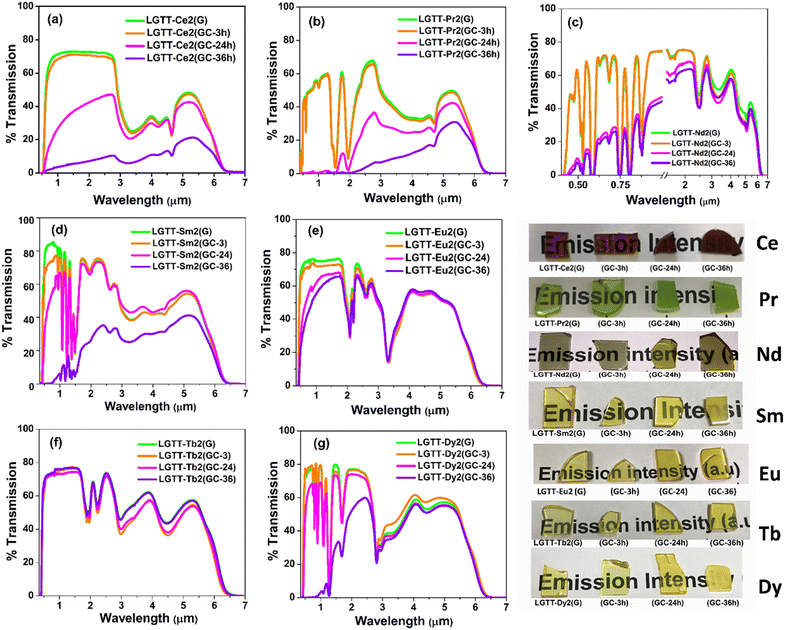 | ||
| Fig. 9 Optical window of all six glass and GCs series: (a) LGTT-Ce2, (b) LGTT-Pr2, (c) LGTT-Nd2, (d) LGTT-Sm2, (e) LGTT-Eu2, (f) LGTT-Tb2, and (g) LGTT-Dy2 along with their photographs. | ||
Fig. 9a and b reveals that the GCs containing cerium (Ce3+:4f2) and praseodymium (Pr3+:4f3) turned out to be opaque after implementation of heat treatment for 24 h and 36 h, whereas neodymium (Nd3+:4f4) doped GCs exhibit translucency (Fig. 9c). GCs containing samarium (‘Sm’:4f5) (Fig. 9d) show >70% retention of transparency after 24 h heat treatment but exhibit translucency (maximum 35%) after 36 h heat-treatment. In our earlier work, GCs containing 2 mol% europium (‘Eu’:4f6) exhibited complete transparency even after implementation of 36 h heat treatment.18 Therefore, considering the transmission characteristics of GCs doped with the different rare-earth ions, it can be inferred that a decrease in REs ionic radii from Ce to Eu renders the retention of transparency. In addition, it has been identified that the doping ‘Tb’ (4f8) to the LGTT glass leads to highly transparent GCs after 36 h heat-treatment, similar to LGTT glass containing ‘Eu’(4f6).18 However, the transmittance percentage of Dy3+ (4f9) doped GCs has decreased instead of showing an increasing trend with increasing heat-treatment duration as expected from a decrease in the ionic radius. Interestingly, the transmission characteristics of Dy3+ doped LGTT GCs is found to be similar to that of Sm3+ (4f5) doped LGTT GCs as shown in Fig. 9d and 9g, since Sm3+ and Dy3+ are ‘Hole-Pair’ ions (4f5 ≡ 4f9). Therefore, it can be presumed that, in addition to the ionic radii, electronic configuration of RE3+ ions also influence the optical behaviour of lanthanide-tellurite “anti-glass” embedded GCs.
4.7 Microstructural study of GCs
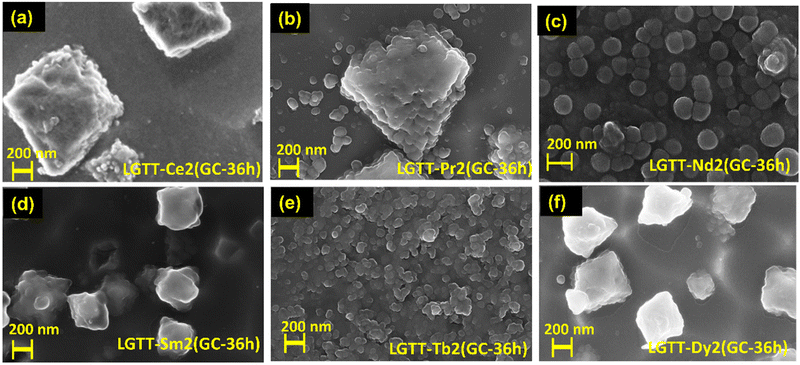
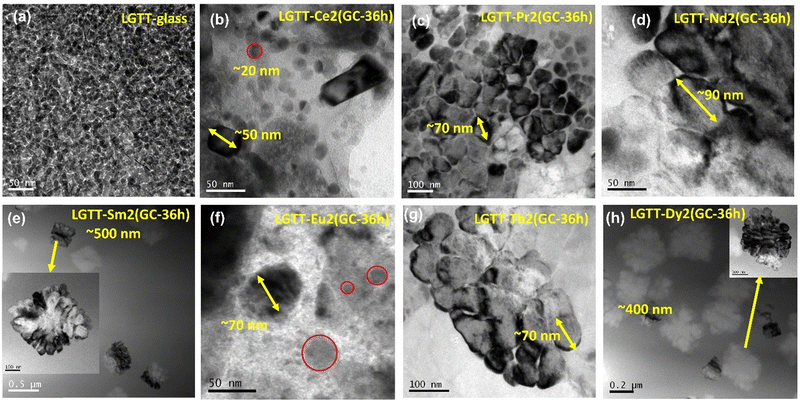
The FE-SEM images of LGTT-Ce2 GCs and LGTT-Pr2 GCs shown in Fig. 10a and b reveal the presence of rectangular agglomerations with crystallite sizes ∼1.2–1.7 μm, in addition to spherical particles nano-crystallites of ∼50 nm size. Whereas, LGTT-Nd2 GCs mostly contain large spherical nano-crystallites of ∼120–185 nm size along with small size spherical crystallites of ∼45–50 nm (Fig. 10c). XRD gives the average grain size of crystallites using the Debye–Scherrer equation. For all the GCs, obtained on the heat treatment at 450 °C for 36 h, the average crystallite size is estimated to be >100 nm. Whereas, FE-SEM images provide surface morphology of the GCs, which may contain individual crystallites as well as bigger size agglomerated crystallites. Therefore, FE-SEM images of LGTT-Ce2/Pr2/Nd2(GC-36 h) display both >100 nm crystallites as well as larger micron size agglomerated crystallites.
The microstructures of LGTT-Sm2 and LGTT-Dy2 GCs heat-treated for 36 h are shown in Fig. 10d and f, display a dense population of large size rectangular crystallites of ∼500–650 nm alone. But, for shorter duration (24 h) of heat-treatment LGTT-Sm2 and LGTT-Dy2 GCs exhibited spherical crystallites of ∼80–105 nm size (Fig. S7c and d, ESI†). Similar types of RE3+ ionic radii dependent microstructure were also observed in solvothermal precipitation of crystalline RE-fluorides.45 A change in crystallite shape in alumino-silicofluoride GCs during the prolonged heat treatment leads to a loss of transparency due to ‘Ostwald ripening’.46,47 Thus, LGTT-Sm2 and LGTT-Dy2 GCs also lose the transparency with increasing the heat treatment time from 24 h to 36 h and changes of crystallite shape from small spherical to large rectangular as a consequence of ‘Ostwald ripening’. This observation corroborates with the results of transmission characteristics (Fig. 9e and g). Fig. 10e shows the microstructure of LGTT-Tb2 GCs where spherical “anti-glass” crystallites have a crystallite size of ∼60 nm. However, similar spherical shape “anti-glass” crystallites precipitation was noticed for 2 mol% Eu3+ doped 36 h GCs [LGTT-Eu2(GC-36 h)] in our earlier work.18 This confirms that the spherical shape “anti-glass” crystallite phases play a significant role in the retention of transparency.
In order to examine the microstructures throughout the volume of the GCs heat-treated for 36 h, FE-SEM has been measured after the grinding of its top surface (∼0.5 mm), and the micrograms are given in Fig. S8a–f (ESI†). The following FE-SEM images confirm the volume crystallization throughout the matrix (3D crystal growth) for each of the dopant ions, which supports the diffusion-controlled crystal growth mechanism. From Fig. S8d–f (ESI†), it can been observed that both LGTT-Eu2(GC-36 h):18LGTT-Tb2(GC-36 h) and LGTT-Sm2(GC-36 h):LGTT-Dy2(GC-36 h) GC pairs exhibit precipitation of spherical and rectangular crystallites respectively, similar to their top surface. Overall, the RE3+ ionic radii as well as ‘hole-formalism’ dictate the crystalline morphology.
5. Discussion
5.1. Effect of RE3+ ionic radii on crystallization and transmission of GCs
Neutron diffraction analysis for LGTT-Eu2 and LGTT-Tb2 glasses reveal that the spatial distribution of structural units in LGTT glass is unaltered with the substitution of different rare-earth oxides for lanthanum oxide. Almost constant values of Tg, measured from calorimetric DSC, also confirm the absence of modifications in the rigidity of the network structure and the average bond strength in LGTT glass by the addition of RE3+ ions with various cationic size. The ΔCp values for undoped and RE3+ doped LGTT glasses vary in the following order: LGTT-Eu2 > LGTT-Tb2 > LGTT-Sm2 > LGTT-Dy2 > undoped LGTT > LGTT-Ce2 > LGTT-Pr2 > LGTT-Nd2. This concludes that the structural units that exist in the LGTT glass at intermediate range order (IRO) are of different configurations depending on the RE3+ ion. It has been evidenced that, in the case of silicate glasses an increase in the network connectivity decreases the configurational heat capacity (ΔCp) value.37 Nevertheless, for the borosilicate glass system containing high B2O3 content the IRO structural units get activated and influence the Cp,conf when the temperature reaches the glass transition, which has no influence on short range order structural units.37 Therefore, the variation in the structural units surroundings the RE3+ ion within the LGTT glass network in the IRO may influence the ΔCp values after reaching the temperature Tg. In general, the specific heat is directly proportional to the degree of freedom. With the increase in temperature beyond Tg, the displacement of atoms increases leading to an increase in the possible configuration of atoms. It is known that the thermodynamic driving force is the prerequisite to activate the motion of atoms favourable for the precipitation of critical size nuclei and the crystal growth. The materials with the highest configurational heat capacity exhibit the lowest crystallization tendency due to the higher randomness in the matrix. Therefore, it is understood that the LGTT-Eu2, LGTT-Tb2, LGTT-Sm2 and LGTT-Dy2 glasses, which are exhibiting higher values of ΔCp, i.e., Cp,conf, have limited growth of crystallization and lead to the formation of nano-crystalline phases. A similar observation is made in the present study, that the structure of glass remains stable with respect to a change in RE cations (La-Lu including Y) but the crystallization properties are affected drastically.51Crystallization kinetic studies for the present glass systems confirm that the “anti-glass” phases grow through the diffusion-controlled growth mechanism. This highlights that precipitated nuclei during the initial period of heat treatment is protected by the inherent barriers and control the growth of crystallite sizes. Interestingly, some of the additives like TiO2, La2O3, CeO2, Y2O3, and Al2O3 tend to inhibit the nucleation rate by segregating at the periphery of the nuclei.52,53 This kind of accumulation acts as a diffusion barrier around the nuclei, thereby decreasing the interfacial energy of the amorphous/crystallite surface barrier. In a recent report, we showed that LGTT glass containing Eu2O3 (LGTT-Eu2) crystallizes through the diffusion-controlled 3D crystal growth mechanism, where the nucleation rate decreases with time.18 In LGTT-Eu2 glass, Ti4+ ions accumulate around the nuclei containing O, Ln/Gd, Eu, and Te atoms and control the crystal growth and results in nano-size crystallites during the prolonged heat treatments. Therefore, a similar process is anticipated for the LGTT glass containing Ce, Pr, Nd, Sm, Tb and Dy. Nevertheless, Rietveld refinement of XRD for GCs obtained upon the heat treatment at 400 °C for 1 h followed by further heat treatment at 450 °C for 36 h confirms that Ce, Pr and Nd occupy the La sites in La2Te6O15, whereas, Sm, Tb and Dy occupy the Gd sites in Gd2Te6O15 similar to Eu as reported earlier.28 This concludes that the RE3+ ions depending on their size, diffuse towards either La or Gd occupying regions and participate in the crystallization process during the heat treatment. Nevertheless, the nucleation and growth of crystallization differs with respect to various RE3+ ions and results in the transparency of GCs due to the different configurational entropy.
The transmission spectra of GCs obtained upon the heat treatment at 450 °C for 36 h confirm that LGTT-Eu2 and LGTT-Tb2 GCs exhibit high transparency followed by LGTT-Sm2, LGTT-Dy2 GC and LGTT-Nd2 GCs, whilst LGTT-Pr2 and LGTT-Ce2 turned opaque (Fig. 9a–g). The transparency in GCs highly depends on the size of the crystals, the smaller the crystal size compared to the wavelength of the incident light the higher the transparency. It is generally accepted that the composition of the crystallite nuclei is purely governed by the distribution of glass-former and modifying additives inside the glass network. Yu et al.54 has reported that distribution of RE3+ ions in the glass matrix plays a crucial role during the ceramization of glass. In LGTT glass, it is assumed that La, Gd and doped trivalent RE ions are distributed homogeneously. Rietveld analysis confirms that, during the heat treatment schedule, the RE3+ cations migrate towards either La or Gd sites. This is possibly because the cationic radii of Ce, Pr and Nd are close to that of the cationic radius of La, while the cationic radii of Sm, Eu, Tb and Dy are close to that of Gd. Nevertheless, the formation of nucleation and crystallization from a region enriched with La/Gd, RE, Te and O highly depends on the mixing of La/Gd and doped RE with each other, i.e., chemical ordering and the dynamics of La/Gd and RE3+ ions. A high chemical order indicates thorough mixing of atoms and favours the growth of crystallization. In the case of Ce, Pr, and Nd containing glasses, La is replaced with an equal quantity of the respective dopant ions possessing similar ionic radii. Therefore, it can be concluded that Ce/Pr/Nd cations in LGTT glass are thoroughly mixed with the La sites and leads to lowered configurational entropy than undoped LGTT glass and further allowing the Ce/Pr/Nd cations to participate in the formation of “anti-glass” crystalline phases during the crystallization of glass. This promotes a faster crystal growth rate resulting in accumulation of precipitated nano-size spherical crystallites into rectangular agglomerate (Fig. 10b and Fig. S9b, ESI†) through Ostwald ripening during the prolonged heat treatment, resulting in the loss of optical transparency. On the other hand, a decrease in chemical ordering in the LGTT glass containing RE = Sm/Eu/Tb/Dy with radii close to Gd might be responsible for higher configurational entropy in these glasses compared to undoped LGTT glass. The number of total RE3+ ions competing for the Gd site is comparatively high (7 mol%) in LGTT-Sm2/Eu2/Tb2/Dy2 glasses thereby increasing the configurational entropy. This higher configurational entropy also leads to competition between Gd and other RE (= Sm/Eu/Tb/Dy) to occupy the Gd sites during the ceramization process and this could obviously control the growth of crystallites. Furthermore, it can be assumed that, the smaller ionic radii REs = Sm/Eu/Tb/Dy may strongly bind to the non-bridging oxygens present in the glass matrix due to their relatively higher field strength and hence diffuse less compared to that of REs with larger ionic radii during crystallizaion,51 resulting in sluggish crystal growth. Therefore, the Sm/Eu/Tb/Dy doped LGTT glasses results in transparent GCs on heat treatment up to 24 h. Nonetheless, the Sm/Dy doped LGTT GCs have become slightly translucent while Eu/Tb doped LGTT GCs remain highly transparent with a further increase in the heat-treatment duration up to 36 h. This is due to the light scattering by the micron size rectangular crystallites precipitated in LGTT-Sm2(GC-36 h) and LGTT-Dy2(GC-36 h) (Fig. 10d and f).
5.2. Effect of RE3+ ionic radii on crystal growth mechanism
FE-SEM and TEM analysis reveal that the LGTT glass exhibits nano-size liquid-liquid amorphous phase separation between the Ln2O3–TeO2 region and TiO4 region in the as-quenched glass. On subjecting to application of heat-treatment, the Ln2O3–TeO2 region attains a critical nuclei energy barrier and starts to precipitate as droplet shape nuclei with the composition Ln2Te6O15 at nucleation temperature (400 °C) (Fig. S9b, ESI†). Here the TiO4 region forms a spherical barrier towards the periphery of the nuclei and acts as an inhibitor for crystal growth. Nevertheless, these droplets precipitate as ∼30 nm size Ln2Te6O15“anti-glass” crystalline phase during heat-treatments at 450 °C for 3 h.18 These precipitates, on further increment in the heat-treatment duration to 36 h, grow up to a maximum of 65 nm size due to the presence of the TiO4-rich region around the crystal and results in transparent GCs.18 However, doping different ionic radii REs (replacing La2O3) drastically affect the crystal growth mechanism as well as its morphology. For glasses that contain larger ionic radii ions such as Ce and Pr, high chemical ordering acts as the predominant factor for crystal growth. Hence, these two ions exhibit faster crystal growth and lead to a large amount of crystallite agglomeration that minimizes its transparency. In the case of Nd with an intermediate ionic radius, both the effect of growth barrier by the TiO4 region and chemical ordering in the glass matrix act equally, leading to precipitation of ∼100 nm crystallites at 36 h, that made the GCs translucent. For LGTT glass containing smaller ionic radii REs: Sm, Eu, Tb, and Dy results in controlled crystal growth with ∼60–70 nm even at higher heat-treatment durations because of the higher chemical ordering. However, LGTT-Sm2 and LGTT-Dy2 GCs heat treated for 36 h display micron size rectangular crystallite through dendritic crystal growth and result in high translucency. Whereas for LGTT-Eu2 and LGTT-Tb2 GCs, even at longer ceramization duration result in higher transparency. It has been reported in lithium-alumino-silicate GCs at higher heat-treatment duration, the alumina-rich crystal growth barrier around the ZrTiO4 crystal is dissolved and redistributed in the matrix. As a result, the crystallite changes its shape from a spherical to elongated one.50,55 Correspondingly, in the present study the Ti-rich diffusion layer probably gets dissolved for the Sm and Dy doped LGTT matrix beyond 24 h heat-treatment and the nano-size spherical crystallites observed in Fig. S7 (ESI†) turned into large size rectangular particles, evolving into a dendritic crystal growth pattern throughout the matrix.56 A visualization of each step during ceramization of LGTT glass and RE doped LGTT-GCs are represented pictorially in Fig. 12 based on their microstructures. In summary, retention of the transparency profile based on RE3+ ionic radii obey the following trend: LGTT-Eu2 > LGTT-Tb2 > LGTT-Sm2 > LGTT-Dy2 > LGTT-Nd2 > LGTT-Pr2 > LGTT-Ce2. It is anticipated that the decrease in ionic radius from Ce to Dy alter the configurational entropy and the crystallization tendency thereby increasing transmission of LGTT-GCs. Nevertheless, the transmission first increases with increasing the cationic radii from Ce to Eu and then decreases from Tb to Dy. Interestingly, LGTT-Dy2 GCs and LGTT-Eu2 GCs reveal a similar crystallization tendency and transmission behaviour to that of LGTT-Sm2 GCs and LGTT-Tb2 GCs, respectively. Therefore, it may be noted that, in comparison to the RE3+ cation size, the ‘Hole-Formalism’ plays the critical role in the crystal growth mechanism and the transparency of LGTT-GCs.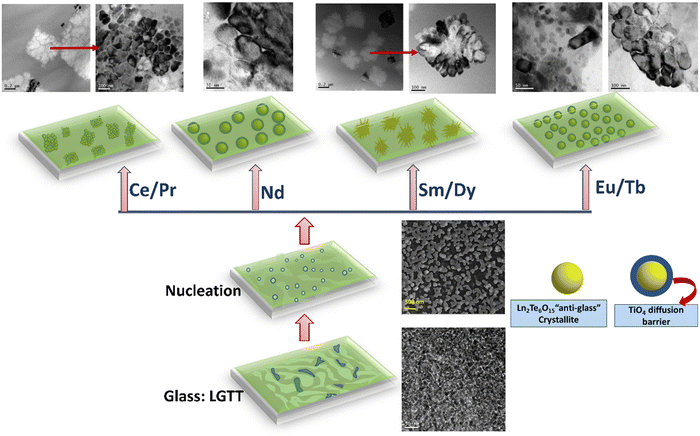 | ||
| Fig. 12 A pictorial diagram based on a microstructural change occurs in each step of ceramization in the currently studied glass and glass-ceramics. | ||
5.3. Effect of hole-formalism
It is interesting to identify that specific pair of glasses such as LGTT-Eu2:LGTT-Tb2 glasses and LGTT-Sm2:LGTT-Dy2 glasses exhibit similar properties. For example, from neutron diffraction and specific heat measurements, it is clear that the atomic configuration and RE local environment is the same for LGTT-Eu2 and LGTT-Tb2 glasses. Furthermore, the ΔCp values for LGTT-Eu2 and LGTT-Tb2 glasses and for LGTT-Sm2 and LGTT-Dy2 glasses are very close. The crystallization growth mechanism and retention of transparency profile after the conversion of glass into GCs are similar for these two pairs of glasses. Additionally, the structural morphology of the GCs observed from the FE-SEM images for these two ion pairs match with each other for all the heat-treatment durations 3 h, 24 h and 36 h (Fig. S6, Fig. S7, ESI† and Fig. 10). These observations validated the concept of ‘Hole-Formalism’ in the LGTT glass containing RE species of Eu, Tb, Sm and Dy. Sm3+ and Dy3+, and Eu3+ and Tb3+ ions are ‘Hole-Pair’ ions. As per the ‘Hole-Formalism’ theory, ‘Hole-Pair’ ions should exhibit similar distributions of structural units in their surroundings; hence in a glass matrix they should acquire a similar atomic structure up to an intermediate range. Though we could not study the whole lanthanide series in the present study, the observed results convey that the LGTT-Eu2 and LGTT-Tb2 glass-pair, and LGTT-Sm2 and LGTT-Dy2 pair of glasses obey the ‘Hole-Formalism’ effect and explain the nano-crystallization behaviour and the observed transmission of GCs. Overall, it is deduced that not only the cationic radius of the RE3+ ion but also the ‘Hole-Formalism’ play a significant role in retaining the transparency of GCs. In summary, it can be said that the ionic radii of RE3+ decide the structural site occupancy in the crystalline phase during the crystallization of glasses, whereas the ‘Hole-Formalism’ explains the crystallization process and the retention of transparency in LGTT glass.6. Conclusion
In the present study we have shown that the RE3+ ionic radii and their distribution both in the parent glass and crystalline phase control the crystallization mechanism of the LGTT glass followed by regulating the transparency of the GCs. Also, we established a new concept for RE ‘Hole-Pair’ ions, Sm:Dy and Eu:Tb, which endures an identical crystallization mechanism. The ‘Hole Formalism’ effect of RE3+ ions that was limited to the energy level configurations has been extended here to correlate the crystallization behaviour of RE doped glasses. Furthermore, the identical neutron diffraction pattern and configurational heat capacity (ΔCp) for these two pairs of ions also justify the similar local environment of ‘Hole pair’ ions up to the intermediate range order. Based on the crystallization kinetic analysis, it has been witnessed that for all of the dopant RE3+ ions, the crystal growth mechanism is diffusion controlled. However, for Ce and Pr, the nucleation rate remains zero with respect to time, and the rest of the ions follow a decreasing nucleation rate. Comparatively lower ΔCp values for larger ionic radii RE (Ce, Pr, Nd)-doped LGTT matrices than the undoped glass acquire high chemical ordering followed by an increased crystal growth rate. In contrast, smaller ionic radii RE (Sm, Eu, Tb, and Dy) doped glasses exhibit comparatively higher ΔCp values, lower chemical ordering and controlled crystal growth upon ceramization. As an outcome, with decreasing ionic radii of REs an orderly retention in transparency profile is observed and the trend is as follows Eu:Tb > Sm:Dy > Nd > Pr > Ce. It has also been clearly identified that RE3+ ionic radii concurrently with the ‘Hole-Formalism’ effect control the overall ceramization process of RE-doped lanthanide-titanium-tellurite glass.Author contributions
Pritha Patra: initiated and executed the work by preparing all the samples followed by carrying out all the experiments including XRD, UV-Vis and FTIR transmission, FE-SEM and TEM measurements. Also performed theoretical crystallization kinetics calculations from experimental data. She has drafted the whole Manuscript (data curation, formal analysis, investigation, writing original draft). K. Jayanthi: analysed the XRD data by performing Rietveld fitting and derived structural information of the precipitated crystalline phases in the glass-ceramics (formal analysis). Margit Fábián: performed neutron diffraction experiment and analysed the diffraction data. She has further simulated the experimental data using Reverse Monte Carlo (RMC) simulation (resource, data curation and formal analysis). Shweta R. Keshri: measured DSC and specific heat capacity of all the glasses (data curation). Sandip Bysakh: helped in sample preparation and measurement of TEM (Data curation and formal analysis). Kaushik Biswas: assisted in analyzing crystallization kinetics data to find out the possible crystallization mechanism (formal analysis, review and editing). Nitya Nand Gosvami: provided DSC characterization facility and also corrected the manuscript (resource along with review and editing). N. M. Anoop Krishnan: provided DSC characterization facility and also corrected the manuscript (Resource along with review and editing). Amarnath R. Allu: helped in conceptualization, investigation, review and editing. Kalyandurg Annapurna: conceptualization, investigation, supervision, review and editing.Conflicts of interest
There are no conflicts to declare.Acknowledgements
The authors would like to thank the Director, CSIR-CGCRI, and Head of Specialty Glass Division for their kind support and encouragement. The authors are thankful for the XRD and FE-SEM characterization facility at CSIR-CGCRI, and for their immense support in diffraction and microstructural characterization respectively. The first author (P. P.) is highly thankful to ER-IPR, DRDO for providing her with the project JRF fellowship.References
- J. Ren, X. Lu, C. Lin and R. K. Jain, Opt. Express, 2020, 28, 21522–21548 CrossRef CAS PubMed.
- M. Clara Gonçalves, L. F. Santos and R. M. Almeida, C. R. Chim., 2002, 5, 845–854 CrossRef.
- D. Chen, W. Xiang, X. Liang, J. Zhong, H. Yu, M. Ding, H. Lu and Z. Ji, J. Eur. Ceram. Soc., 2015, 35, 859–869 CrossRef CAS.
- X. Li, C. Yang, L. Qiu, S. Wang, Y. Chen, M. Yin and D. Chen, Laser Photonics Rev., 2022, 16, 2100346 CrossRef CAS.
- J. Qiu, Q. Jiao, D. Zhou and Z. Yang, J. Rare Earths, 2016, 34, 341–367 CrossRef CAS.
- C. B. de Araújo, L. R. P. Kassab and D. M. da Silva, Opt. Mater., 2022, 131, 112648 CrossRef.
- G. H. Beall and L. R. Pinckney, J. Am. Ceram. Soc., 1999, 82, 5–16 CrossRef CAS.
- A. Chiappini, L. Zur, F. Enrichi, B. Boulard, A. Lukowiak, G. C. Righini and M. Ferrari, Glass ceramics for frequency conversion, in Solar Cells and Light Management, ed. F. Enrichi and G. Righini, Elsevier, 2020, ch. 11, pp. 391–414 Search PubMed.
- S. Wang, J. Zhu, H. Huang, J. Lin, C. Yang, S. Liao, F. Huang and D. Chen, Cell Rep. Phys. Sci., 2022, 3, 100794 CrossRef CAS.
- S. Wang, J. Zhu, Y. He, Z. Li, J. Lin, S. Liao, F. Huang, P. Huang, Y. Zheng, X. Li and D. Chen, Laser Photonics Rev., 2022, 16, 2200039 CrossRef CAS.
- M. Allix, S. Alahrache, F. Fayon, M. Suchomel, F. Porcher, T. Cardinal and G. Matzen, Adv. Mater., 2012, 24, 5570–5575.
- S. Chenu, E. Véron, C. Genevois, G. Matzen, T. Cardinal, A. Etienne, D. Massiot and M. Allix, Adv. Opt. Mater., 2014, 2, 364–372 CrossRef CAS.
- P. Patra and K. Annapurna, Prog. Mater. Sci., 2022, 125, 100890 CrossRef CAS.
- M. Trömel, W. Hützler and E. Münch, J. Less Common Met., 1985, 110, 421–424 CrossRef.
- G. Gupta, S. Bysakh, S. Balaji, S. Khan, K. Biswas, A. R. Allu and K. Annapurna, Adv. Eng. Mater., 2020, 22, 1901357 CrossRef CAS.
- M. Dolhen, M. Allix, V. Sarou-Kanian, F. Fayon, C. Genevois, S. Chenu, P.-E. Coulon, M. Colas, J. Cornette, J.-R. Duclère, F. Brisset, O. Masson, P. Thomas and G. Delaizir, Acta Mater., 2020, 189, 73–84 CrossRef CAS.
- N. Gupta, A. Khanna, Hirdesh, A.-C. Dippel and O. Gutowski, RSC Adv., 2020, 10, 13237–13251 RSC.
- P. Patra, R. Kumar, K. Jayanthi, M. Fábián, G. Gupta, S. Khan, S. Chakraborty, S. Das, A. R. Allu and K. Annapurna, Inorg. Chem., 2022, 61, 10342–10358 CrossRef CAS PubMed.
- A. Bertrand, J. Carreaud, S. Chenu, M. Allix, E. Véron, J.-R. Duclère, Y. Launay, T. Hayakawa, C. Genevois, F. Brisset, F. Célarié, P. Thomas and G. Delaizir, Adv. Opt. Mater., 2016, 4, 1482–1486 CrossRef CAS.
- M. Dolhen, M. Tanaka, V. Couderc, S. Chenu, G. Delaizir, T. Hayakawa, J. Cornette, F. Brisset, M. Colas, P. Thomas and J.-R. Duclère, Sci. Rep., 2018, 8, 4640 CrossRef PubMed.
- S. Wen, Y. Wang, B. Lan, W. Zhang, Z. Shi, S. Lv, Y. Zhao, J. Qiu and S. Zhou, Adv. Sci., 2019, 6, 1901096 CrossRef PubMed.
- G. Gupta, S. Balaji, K. Biswas and A. Kalyandurg, J. Am. Ceram. Soc., 2018, 101, 3900–3916 CrossRef CAS.
- S. Balaji, A. Allu, K. Biswas, G. Gupta, D. Ghosh and A. Kalyandurg, Laser Phys. Lett., 2017, 14, 35804 CrossRef.
- Y. Fujomoto, Y. Benino, T. Fujiwara, R. Sato and T. Komatsu, J. Ceram. Soc. Japan, 2001, 109, 466–469 CrossRef.
- W. Stambouli, H. Elhouichet, B. Gelloz and M. Férid, J. Lumin., 2013, 138, 201–208 CrossRef CAS.
- R. Renata, AIMS Mater. Sci., 2015, 2, 37–60 Search PubMed.
- J. S. Griffith, J. Inorg. Nucl. Chem., 1956, 2, 1–10 CrossRef CAS.
- E. M. R. Kiremire, J. Chem. Educ., 1989, 66, 479 CrossRef CAS.
- K. Binnemans, Coord. Chem. Rev., 2015, 295, 1–45 CrossRef CAS.
- E. Furet, K. Costuas, P. Rabiller and O. Maury, J. Am. Chem. Soc., 2008, 130, 2180–2183 CrossRef CAS PubMed.
- R. Kaur, A. Khanna and M. Fábián, Phase Transitions, 2020, 93, 1016–1029 CrossRef CAS.
- E. R. Barney, A. C. Hannon, D. Holland, N. Umesaki and M. Tatsumisago, J. Non. Cryst. Solids, 2015, 414, 33–41 CrossRef CAS.
- E. R. Barney, A. C. Hannon, D. Holland, N. Umesaki, M. Tatsumisago, R. G. Orman and S. Feller, J. Phys. Chem. Lett., 2013, 4, 2312–2316 CrossRef CAS.
- A. Kaur, Hirdesh, A. Khanna, M. Fabian, P. S. R. Krishna and A. B. Shinde, Mater. Res. Bull., 2019, 110, 239–246 CrossRef CAS.
- Q. Zheng, M. Potuzak, J. C. Mauro, M. M. Smedskjaer, R. E. Youngman and Y. Yue, J. Non. Cryst. Solids, 2012, 358, 993–1002 CrossRef CAS.
- T. Komatsu, T. Noguchi and R. Sato, J. Am. Ceram. Soc., 1997, 80, 1327–1332 CrossRef CAS.
- H. Liu, M. M. Smedskjaer, H. Tao, L. R. Jensen, X. Zhao and Y. Yue, Phys. Chem. Chem. Phys., 2016, 18, 10887–10895 RSC.
- Q. Zheng, Y. Zhang, M. Montazerian, O. Gulbiten, J. C. Mauro, E. D. Zanotto and Y. Yue, Chem. Rev., 2019, 119, 7848–7939 CrossRef CAS PubMed.
- S. Mandal, D.-E. Lee and T. Park, Sci. Rep., 2020, 10, 10577 CrossRef CAS PubMed.
- P. Karmakar, A. K. Subudhi, K. Biswas and K. Annapurna, Thermochim. Acta, 2015, 610, 1–9 CrossRef CAS.
- Y. K. Lee and S. Y. Choi, J. Mater. Sci., 1997, 32, 431–436 CrossRef CAS.
- B. H. Toby and R. B. Von Dreele, J. Appl. Crystallogr., 2013, 46, 544–549 CrossRef CAS.
- D. Palmer, CrystalMaker 10.7. CrystalMaker Softw. Ltd, Yarnton, Oxfordshire, England.
- R. Kaur and A. Khanna, J. Lumin., 2020, 225, 117375 CrossRef CAS.
- P. Ghosh, R. K. Sharma, Y. N. Chouryal and A.-V. Mudring, RSC Adv., 2017, 7, 33467–33476 RSC.
- T. Höche, C. Moisescu, I. Avramov, C. Rüssel, W. D. Heerdegen and C. Jäger, Chem. Mater., 2001, 13, 1320–1325 CrossRef.
- W. Höland, C. Ritzberger, E. Apel, V. Rheinberger, R. Nesper, F. Krumeich, C. Mönster and H. Eckert, J. Mater. Chem., 2008, 18, 1318–1332 RSC.
- C. Lin, C. Bocker and C. Rüssel, Nano Lett., 2015, 15, 6764–6769 CrossRef CAS PubMed.
- S. Chenu, E. Véron, C. Genevois, A. Garcia, G. Matzen and M. Allix, J. Mater. Chem. C, 2014, 2, 10002–10010 RSC.
- T. Höche, C. Patzig, T. Gemming, R. Wurth, C. Rüssel and I. Avramov, Cryst. Growth Des., 2012, 12, 1556–1563 CrossRef.
- A. Quintas, D. Caurant, O. Majerus, J. L. Dussossoy and T. Charpentier, Phys. Chem. Glas., 2008, 49, 192–197 CAS.
- K. Thieme, I. Avramov and C. Rüssel, Sci. Rep., 2016, 6, 25451 CrossRef CAS PubMed.
- K. Thieme and C. Rüssel, J. Mater. Sci., 2016, 51, 989–999 CrossRef CAS.
- J. Yu, L. Hu and J. Ren, Inorg. Chem., 2021, 60, 3401–3409 CrossRef CAS PubMed.
- V. S. Raghuwanshi, C. Rüssel and A. Hoell, Cryst. Growth Des., 2014, 14, 2838–2845 CrossRef CAS.
- D. V. Alexandrov and P. K. Galenko, Phil. Trans. R. Soc. A., 2021, A379, 20200325 CrossRef PubMed.
Footnote |
| † Electronic supplementary information (ESI) available. See DOI: https://doi.org/10.1039/d3ma00036b |
| This journal is © The Royal Society of Chemistry 2023 |

