 Open Access Article
Naphthyl-azine – aggregation induced emission, reversible acidochromism, cyanide sensing and its application in intracellular imaging†
Sukanya
Paul
a,
Kingshuk
Debsharma‡
 b,
Sunanda
Dey‡
c,
Satyajit
Halder
d,
Kuladip
Jana
d and
Chittaranjan
Sinha
 *a
*a
aDepartment of Chemistry, Jadavpur University, Kolkata-700032, India. E-mail: crsjuchem@gmail.com; chittaranjan.sinha@jadavpuruniversity.in
bDepartment of Chemistry, Indian Institute of Technology Madras, Chennai 600036, India
cDepartment of Chemistry, Mrinalini Datta Mahavidyapith, Birati, Kolkata 700051, India
dDivision of Molecular Medicine, Bose Institute, Kolkata-700056, India
First published on 8th August 2023
Abstract
The naphthylhydrazone derivative 1-[(2-hydroxy-4,6-dimethoxy-benzylidene)-hydrazonomethyl]-naphthalen-2-ol (H2L), an aggregation induced emission (AIE) active probe, has emerged as a promising solid-state emitter upon exercising restricted intramolecular rotation (RIR) in an ordered J-type self-assembly and accounts for solid-state sensitive fluorescence quenching of trifluoroacetic acid (HTFA) vapour with a limit of detection (LOD) of 1.41 ppm. A plausible mechanism of quenching may be the protonation driven destruction of compacted arrangement in the solid state of the probe. Interestingly, H2L exhibits reversible acidochromic behavior upon sequential addition of HTFA and TEA (triethylamine, NEt3) vapour, which has been utilized for information protection application using the “write–erase” technique. Moreover, the probe shows a selective and sensitive colorimetric and ‘turn-on’ fluorogenic response towards CN− amongst twenty anions, with a limit of detection (LOD) of 45.42 nM. The CN−-sensing activity of H2L is also reversible in the presence of HTFA, and the probe can easily be recycled several times demonstrating its potent reusability and ardent support to sustainable development goals (SDGs). Furthermore, cytotoxicity studies reveal considerable biocompatibility and intracellular imaging of the probe, which reflects the AIEgenic properties and CN− detection in MDA-MB 231 cells as well.
Introduction
π-Conjugated organic molecules with fluorogenic motifs exhibit tunable photophysical behavior in the aggregated state and find use in a vast arena of potential applications including sensing, optoelectronic device formation (OLEDs, OFETs), bioimaging, etc.1–3 Aggregation has two opposite basic effects – aggregation-caused quenching (ACQ),4,5 a common phenomenon, and aggregation-induced emission (AIE),6,7 an unusual emissive process. In the case of AIE, molecular packing plays an important role in the onset of this unusual event, where restriction of intramolecular rotation (RIR) induces vigorous rigidity upon aggregation/self-assembly and prevents the continuous dissipation of energy through non-radiative relaxation.8,9 Owing to the augmented luminescence feature accomplished with superior photostability, AIEgens have established themselves as sensitive agents for trace quantity detection of toxic ions, gases, and even explosives.10–15 AIEgens may be incorporated into polymers for the construction of AIE polymeric materials which have extensive future application potential.16–20 In recent times, functional fluorescent carbon dot based sensors are widely chosen as a platform for stimuli responsive studies. However, the multistep fabrication method of such materials does not favor the sustainable development goals (SDGs) approach.21,22 Solid luminophores owing to their high quantum efficiency are often considered as convenient multi-stimuli responsive materials in the presence of external stimuli such as heat,23–25 light,26 mechanical force,27–30 biomolecules31–34 and chemical vapors or gas.35–39 Subsequently, fluorogenic devices fabricated for the detection of volatile acids have drawn considerable interest due to their inevitable implications for the estimation of acidity in the local environment in biology, chemistry, food science, pharmacy, forensic science, etc.40 Even lower concentrations of such acid vapours are potentially toxic, corrosive, irritant to skin and eyes and cause severe burn to the mucous membrane of the respiratory tract.41–43 Therefore, there is increasing demand for developing improved, cost-effective, reusable and responsive materials for ultra-trace recognition of toxic acid vapors.Side-by-side, anion sensors have also emerged as a progressive field of research owing to their crucial roles in various biochemical and industrial processes. Out of several existing anions in the environment, the cyanide ion (CN−) is known to be a highly toxic anion which can easily bind with the iron (Fe3+) centre of cytochrome-C oxidase and cause disruption of the mitochondrial electron transport chain and lead to hypoxia.44,45 Also, CN− is extremely detrimental as it gets easily absorbed through the skin and induces potential damage to vascular, central nervous, endocrine and even cardiac systems.46 Extensive use of CN− in different industrial processes such as gold extraction, synthesis of fibers and electroplating work may release unprocessed waste into the environment, causing severe environmental contamination and increasing the risk of damage to human health mostly via oral and dermal exposure. Therefore, the permissible limit for CN− in drinking water has been restricted to 1.9 μM by WHO.47 Hence, the development of efficient chromogenic and fluorogenic sensing modules for visual detection of CN− has become a top priority in the ongoing research fraternity.
In the present work, we have designed an azine derivative based on a naphthyl scaffold namely 1-[(2-hydroxy-4,6-dimethoxy-benzylidene)-hydrazonomethyl]-naphthalen-2-ol (H2L), which exhibits excellent AIE behavior in mixed aqueous medium. The π–π stacking of the naphthyl unit plays a predominant role contributing to its interesting photophysical properties such as AIEgenic behaviour with a substantial Stokes shift (83 nm). The probe H2L is strongly emissive and is employed as a reversible fluorescence sensor for HTFA/TEA (NEt3) vapors. It serves as a solvent free medium for analysis and has encrypted security ink application which emphasizes its scope in real-world technologies. Further the azine probe H2L simultaneously detects CN− in acetonitrile medium through chromogenic response via the selective deprotonation pathway which has been substantiated by spectroscopic results and DFT computation of the probe (H2L) and its deprotonated (L2−) form. Because of the low solubility of the probe in water, the sensing experiment of CN− is carried out in CH3CN/H2O (99![[thin space (1/6-em)]](https://www.rsc.org/images/entities/char_2009.gif) :
:![[thin space (1/6-em)]](https://www.rsc.org/images/entities/char_2009.gif) 1, v/v; HEPES buffer, pH 7.3) medium. However, the use of a greener solvent such as aqueous medium is more preferred than the organic solvent for its practical utility as per the SDG protocol. Nevertheless, the probe shows dual channel application with a very low detection limit of two analytes trifluoroacetic acid (HTFA) vapour (1.41 ppm) and cyanide (45.42 nM). In addition, the reagents required for the synthesis of H2L are of low cost and the purification process is very simple. Further, the practical application of CN− detection has been extended to the detection of cyanide from food extract, test kit development and construction of the INHIBIT logic gate circuit. The probe H2L is employed for intracellular imaging application in the MDA-MB-231 cell line in the presence of CN− and for revealing the AIEgenic behaviour of H2L at different water fractions in cells. The greater water dispersibility, strong AIE-fluorescence, acidochromic feature, CN− sensing and low cytotoxicity along with intracellular imaging in the MDA-MB-231 cell line make the probe a suitable motif for future technology.
1, v/v; HEPES buffer, pH 7.3) medium. However, the use of a greener solvent such as aqueous medium is more preferred than the organic solvent for its practical utility as per the SDG protocol. Nevertheless, the probe shows dual channel application with a very low detection limit of two analytes trifluoroacetic acid (HTFA) vapour (1.41 ppm) and cyanide (45.42 nM). In addition, the reagents required for the synthesis of H2L are of low cost and the purification process is very simple. Further, the practical application of CN− detection has been extended to the detection of cyanide from food extract, test kit development and construction of the INHIBIT logic gate circuit. The probe H2L is employed for intracellular imaging application in the MDA-MB-231 cell line in the presence of CN− and for revealing the AIEgenic behaviour of H2L at different water fractions in cells. The greater water dispersibility, strong AIE-fluorescence, acidochromic feature, CN− sensing and low cytotoxicity along with intracellular imaging in the MDA-MB-231 cell line make the probe a suitable motif for future technology.
Experimental section
Materials and methods
All reagents were of analytical grade (AR grade) and were collected from commercial suppliers, TCI chemicals and Merck: 2-hydroxy-napthaldehyde (98%), hydrazine hydrate (80% solution in water), 4,6-dimethoxy-salicylaldehyde (>98%), inorganic salts and other organic chemicals (Na2S2O3·5H2O (99.5%), NaCl (99.5%), NaF (>98.0%), NH4HF2 (98%), KNO3(≥99.0%), KBr (≥99.0%), NaNO2 (≥99.0%), NaN3 (≥99.5%), CH3COONa (≥99.0%), KIO3 (99.5%), KI (≥99.0%), Na2SO4 (≥99.0%), Na2S, (C4H9)N(CN) (95%), KSCN (99%)) trifluoroacetic acid (≥99.0%), triethylamine (≥99.5%), phosphoric acid (85 wt% in H2O), propionic acid (≥99.5%), sulphuric acid (98%), methane sulfonic acid (≥99.0%), methacrylic acid (99.0%), heptanoic acid (99.0%), oleic acid (≥99.0%), acetic acid (≥99.0%), nitric acid (70%), and HCl (37 wt% in H2O) were bought from TCI chemicals and Merck. For spectroscopic measurements UV grade solvents were used. Milli-Q water (Millipore) was used for the preparation of aqueous solutions of metal salts. A PerkinElmer (2400 Series-II, PerkinElmer, USA) CHN analyzer was used for elemental analysis. The spectra were recorded using UV-Vis Lambda 25, LS55 fluorescence and LX-1 FTIR spectrophotometers (KBr disk, 4000–400 cm−1) on PerkinElmer instruments. 1H and 13C NMR spectra were recorded by using a Bruker 300 MHz FT-NMR spectrometer. The chemical shift (δ) of the respective NMR spectra was recorded in parts per million (ppm) with respect to TMS (trimethylsilane) as the internal standard. ESI-MS spectra were obtained from a HRMS spectrometer (model XEVO-G2QTOF#YCA351). BET measurements, which reveal the specific surface area of the samples, and pore distribution, were made based on N2 adsorption isotherms carried out in an Autosorb iQ2 gas sorption instrument (Quantachrome Instruments, USA). Before measuring the pore volume, all the samples were degassed at 100 °C under vacuum for 4 h with a FLOVAC degasser tube.Synthesis of 1-[(2-hydroxy-4,6-dimethoxy-benzylidene)-hydrazonomethyl]-naphthalen-2-ol (H2L)
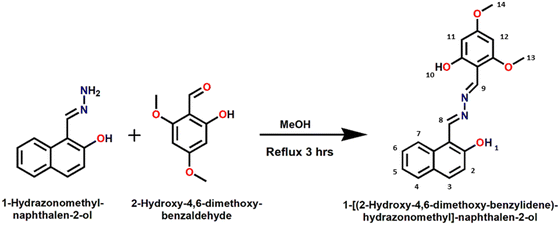
1-Hydrazonomethyl-naphthalen-2-ol was synthesized based on a literature procedure48 (Scheme 1). To a methanolic solution (10 mL) of 1-hydrazonomethyl-naphthalen-2-ol (0.186 mg, 1 mmol), 2-hydroxy-4,6-dimethoxy-benzaldehyde (0.182 mg, 1 mmol) in MeOH (5 ml) was added dropwise slowly. The resulting solution was stirred overnight followed by reflux for 3 h to yield a bright yellow precipitate. The precipitate was filtered, washed several times with methanol and dried under vacuum. The product was further recrystallized from a saturated solution of DMSO/acetonitrile (1![[thin space (1/6-em)]](https://www.rsc.org/images/entities/char_2009.gif) :
:![[thin space (1/6-em)]](https://www.rsc.org/images/entities/char_2009.gif) 5 v/v) through a slow evaporation method and the isolated yellow needle shaped crystals were found to be suitable for single crystal X-ray diffraction measurements. Yield: 0.255 mg (73%). 1H NMR (CDCl3, 300 MHz): 13.12 (s, 1H, OH(1)), 12.41 (s, 1H, OH(10)), 9.56 (s, 1H, N
5 v/v) through a slow evaporation method and the isolated yellow needle shaped crystals were found to be suitable for single crystal X-ray diffraction measurements. Yield: 0.255 mg (73%). 1H NMR (CDCl3, 300 MHz): 13.12 (s, 1H, OH(1)), 12.41 (s, 1H, OH(10)), 9.56 (s, 1H, N![[double bond, length as m-dash]](https://www.rsc.org/images/entities/char_e001.gif) CH(8)), 9.11 (s, 1H, N
CH(8)), 9.11 (s, 1H, N![[double bond, length as m-dash]](https://www.rsc.org/images/entities/char_e001.gif) CH(9)) 8.16–7.24 (m, 6H, Ar-H(2–7)), 6.20–6.02 (s, 2H, Ar-H(11,12)), 3.89 (s, 6H, CH3(13,14)) (Fig. S1, ESI†); 13C NMR (CDCl3, 75 MHz): 165.19, 163.17, 161.00, 160.68, 159.55, 158.71, 134.27, 132.58, 129.15, 128.18, 127.84, 123.68, 120.09, 119.17, 108.26, 101.29, 93.50, 90.76, 55.78, 55.56 (Fig. S2, ESI†). ESI-MS: 351.1333 [M + H+] (Fig. S3, ESI†). IR spectrum: 3392 cm−1 (O–H stretching), 2953 and 2843 cm−1 (C–H stretching), 1628 and 1583 cm−1 (C
CH(9)) 8.16–7.24 (m, 6H, Ar-H(2–7)), 6.20–6.02 (s, 2H, Ar-H(11,12)), 3.89 (s, 6H, CH3(13,14)) (Fig. S1, ESI†); 13C NMR (CDCl3, 75 MHz): 165.19, 163.17, 161.00, 160.68, 159.55, 158.71, 134.27, 132.58, 129.15, 128.18, 127.84, 123.68, 120.09, 119.17, 108.26, 101.29, 93.50, 90.76, 55.78, 55.56 (Fig. S2, ESI†). ESI-MS: 351.1333 [M + H+] (Fig. S3, ESI†). IR spectrum: 3392 cm−1 (O–H stretching), 2953 and 2843 cm−1 (C–H stretching), 1628 and 1583 cm−1 (C![[double bond, length as m-dash]](https://www.rsc.org/images/entities/char_e001.gif) N stretching) (Fig. S4, ESI†).
N stretching) (Fig. S4, ESI†).
X-Ray crystallographic measurements
The needle shaped yellow single crystals (0.20 × 0.12 × 0.08 mm3) of H2L were obtained through the slow evaporation technique in DMSO/acetonitrile (1![[thin space (1/6-em)]](https://www.rsc.org/images/entities/char_2009.gif) :
:![[thin space (1/6-em)]](https://www.rsc.org/images/entities/char_2009.gif) 5, v/v) medium. Single crystal X-ray data were collected by using a Bruker Apex II CCD Area Detector at 100(2) K. Graphite-monochromatized Cu-Kα radiation (λ = 1.54178 Å) was used in a fine-focused sealed tube. The hkl range for data collection was −12 ≤ h ≤ 13; −11 ≤ k ≤ 11; −37 ≤ l ≤ 37 for the probe H2L, where diffraction was recorded within the angular range 2.292 ≤ θ ≤ 73.202° for H2L. The intensity was corrected for Lorentz and polarisation effects and empirical absorption corrections were applied for both the probe and the complex. Data were collected applying the condition I > 2σ(I). The structure was solved by the direct method followed by successive Fourier and difference Fourier syntheses. All the non-hydrogen atoms were refined anisotropically. The hydrogen atoms were geometrically fixed and refined using the riding model. All calculations were carried out using the SHELXL-2016/6,49 ORTEP-32,50 and PLATON-9951 programs. The details of data collection and crystal data with some selected bond lengths and bond angles are listed in Tables S1–S3 (ESI†). The crystal data for the probe H2L have been deposited at the Cambridge Crystallographic Data Centre (CCDC 2178275).†
5, v/v) medium. Single crystal X-ray data were collected by using a Bruker Apex II CCD Area Detector at 100(2) K. Graphite-monochromatized Cu-Kα radiation (λ = 1.54178 Å) was used in a fine-focused sealed tube. The hkl range for data collection was −12 ≤ h ≤ 13; −11 ≤ k ≤ 11; −37 ≤ l ≤ 37 for the probe H2L, where diffraction was recorded within the angular range 2.292 ≤ θ ≤ 73.202° for H2L. The intensity was corrected for Lorentz and polarisation effects and empirical absorption corrections were applied for both the probe and the complex. Data were collected applying the condition I > 2σ(I). The structure was solved by the direct method followed by successive Fourier and difference Fourier syntheses. All the non-hydrogen atoms were refined anisotropically. The hydrogen atoms were geometrically fixed and refined using the riding model. All calculations were carried out using the SHELXL-2016/6,49 ORTEP-32,50 and PLATON-9951 programs. The details of data collection and crystal data with some selected bond lengths and bond angles are listed in Tables S1–S3 (ESI†). The crystal data for the probe H2L have been deposited at the Cambridge Crystallographic Data Centre (CCDC 2178275).†
Theoretical calculation
The gas-phase optimized structures of H2L and its CN− complex (H2L + 2CN−) were calculated with the 6311-G basis set (C, H, O, N) and the B3LYP functional of Gaussian Program Package 09.52–54 The optimized geometry of H2L was obtained using the coordinates from single crystal structures where the vibrational frequency calculation represented the local minima with positive eigenvalues. The TD-DFT calculation determined the theoretical transitions in relevance to that of experimental absorption spectral behaviour of H2L and also in the presence of CN−, which was performed using the conductor like polarizable continuum model (CPCM) in acetonitrile medium.55–57 Fractional contribution of the orbital was calculated using GAUSSUM.58Cell line study
Human breast cancer cell line MDA-MB-231 and human normal lung fibroblast cell line WI-38 were procured from the central cell repository of National Centre for Cell Science (NCCS), Pune, India. All the cell lines were cultured in a T25 flask with DMEM supplemented with 10% FBS (fetal bovine serum), 1 mM sodium pyruvate, 2 mM L-glutamine, non-essential amino acids, 100 units per L penicillin, 100 mg L−1 streptomycin, and 50 mg L−1 gentamycin in a 37 °C humidified incubator containing 5% CO2.Cytotoxicity assay
The MTT cell proliferation assay59 was performed to assess the cytotoxic effect of the ligand H2L in both the cancer cell line MDA-MB-231 and the normal cell line WI-38. The cells were seeded in 96 well plates at a concentration of 1 × 10⁴ cells per well for 24 h, which were then exposed to different working concentrations of the ligand H2L in DMSO (0, 10, 20, 40, 80, and 100 μM) for 24 h. After incubation, the cells were washed with 1× PBS, and MTT solution (0.5 mg mL−1) was added to each well and incubated for 4 h and the resulting formazan crystals were dissolved in DMSO and the absorbance was measured at 570 nm by using a microplate reader. Cell viability was expressed as a percentage of the experimental control group.Fluorescence imaging
To visualize the fluorescence ability of H2L in the presence of mixed solvent medium (water (H2O) and acetonitrile (CH3CN)), and also in the presence of cyanide (CN−), the fluorescence imaging was performed in the cell line MDA-MB 231. The cells were allowed to grow in cover slips for 24 h in a 37 °C humidified incubator containing 5% CO2 and then the systems were either mock-treated or treated with 10 μM H2L in the presence and absence of CN− (5 and 10 μM) separately in water as well as in organic solvent medium and incubated for 30 minutes in the dark at 37 °C. The cells were washed with 1× PBS and then they were mounted on a glass slide and detected under a fluorescence microscope (Olympus) using a DAPI filter.60Quantum yield and limit of detection calculation
Fluorescence quantum yields (Φ) were obtained by using the following equation:| Φsample = (ODstd. × Asample)/(ODsample× Astd.) × Φstd. |
The limit of detection (LOD) was calculated from the absorption titration experiment on gradual addition of CN− ions to the solution of the ligand H2L using the 3σ/m method, where σ represents the standard deviation and m is the slope acquired from the plot of the absorption titration experiment.
Results and discussion
Structural characterization of the probe H2L
The 1H NMR spectrum of 1-[(2-hydroxy-4,6-dimethoxy-benzylidene)-hydrazonomethyl]-naphthalen-2-ol (H2L) (Fig. S1, ESI†) reveals two singlet Hs (Scheme 1) of naphthyl–OH (1) (13.12 ppm) and dimethoxyphenyl–OH(10) (12.41 ppm). In addition, the sharp singlets for naphthyl –CH(8)![[double bond, length as m-dash]](https://www.rsc.org/images/entities/char_e001.gif) N– (9.56 ppm) and dimethoxyphenyl –CH(9)
N– (9.56 ppm) and dimethoxyphenyl –CH(9)![[double bond, length as m-dash]](https://www.rsc.org/images/entities/char_e001.gif) N– (9.12 ppm) certainly confirm the formation of probe H2L. Two aromatic singlets of the dimethoxyphenyl group appear at 6.20 (11H) and 6.02 (12H) ppm; an intense singlet at 3.89 ppm implies –OCH3 protons. Other aromatic protons (2–7H) of H2L are observed at 8.16–7.24 ppm. The 13C NMR spectrum of H2L shows two peaks at 165.19 and 163.17 ppm due to C (C–O) centres attached to the methoxy unit. The two peaks at 161.00 and 160.68 ppm represent the C of (CH
N– (9.12 ppm) certainly confirm the formation of probe H2L. Two aromatic singlets of the dimethoxyphenyl group appear at 6.20 (11H) and 6.02 (12H) ppm; an intense singlet at 3.89 ppm implies –OCH3 protons. Other aromatic protons (2–7H) of H2L are observed at 8.16–7.24 ppm. The 13C NMR spectrum of H2L shows two peaks at 165.19 and 163.17 ppm due to C (C–O) centres attached to the methoxy unit. The two peaks at 161.00 and 160.68 ppm represent the C of (CH![[double bond, length as m-dash]](https://www.rsc.org/images/entities/char_e001.gif) N) imine signals. Phenolic-C (C–O) contributes to the peaks at 159.55 and 158.71 ppm. The remaining aromatic-Cs appear from 134.27 to 90.76 ppm.
N) imine signals. Phenolic-C (C–O) contributes to the peaks at 159.55 and 158.71 ppm. The remaining aromatic-Cs appear from 134.27 to 90.76 ppm.
The signals at 55.78 and 55.56 ppm are assigned to the methoxy carbon (Fig. S2, ESI†). ESI-MS analysis of H2L shows a molecular ion peak at 351.1333, which corresponds to [M + H+] formation and confirms its composition (Fig. S3, ESI†). The IR spectrum of H2L shows stretching frequencies of two imine (C![[double bond, length as m-dash]](https://www.rsc.org/images/entities/char_e001.gif) N) groups at 1630 and1590 cm−1 which certifies the formation of the probe. Correspondingly, the N–N stretching band of the azine linkage appears at 1219 cm−1 (Fig. S4, ESI†).
N) groups at 1630 and1590 cm−1 which certifies the formation of the probe. Correspondingly, the N–N stretching band of the azine linkage appears at 1219 cm−1 (Fig. S4, ESI†).
H2L crystallizes in the orthorhombic system with Pna21 space group having Z = 8 and density 1.402 g cm−3. The bond lengths C22–N1 (1.296 Å) and C33–N2 (1.304 Å) exhibit imine (C![[double bond, length as m-dash]](https://www.rsc.org/images/entities/char_e001.gif) N) linkage, and are found to be shorter than the N1–N2 distance (1.400 Å) of azine function. Also, the bond distance C24–O3 (1.345 Å) and C35–O8 (1.349 Å) indicate characteristic phenolic type bonding, whereas the bonds C37–O1 and C39–O2 correspond to methoxy units, and are equal (1.360 Å) (Tables S2 and S3, ESI†). There are two types of intramolecular hydrogen bonds, viz., O3–H3⋯N1 (1.821 Å) and O8–H8⋯N2 (1.873 Å), which impart stability to the molecule (Fig. 1a). The bond angles corresponding to C33–N2–N1 and C22–N1–N2 are 112.45° and 113.91°. A 2D supramolecular self-assembly is formed by various non-covalent π⋯π (4.312 Å) interactions (Fig. 1b).
N) linkage, and are found to be shorter than the N1–N2 distance (1.400 Å) of azine function. Also, the bond distance C24–O3 (1.345 Å) and C35–O8 (1.349 Å) indicate characteristic phenolic type bonding, whereas the bonds C37–O1 and C39–O2 correspond to methoxy units, and are equal (1.360 Å) (Tables S2 and S3, ESI†). There are two types of intramolecular hydrogen bonds, viz., O3–H3⋯N1 (1.821 Å) and O8–H8⋯N2 (1.873 Å), which impart stability to the molecule (Fig. 1a). The bond angles corresponding to C33–N2–N1 and C22–N1–N2 are 112.45° and 113.91°. A 2D supramolecular self-assembly is formed by various non-covalent π⋯π (4.312 Å) interactions (Fig. 1b).
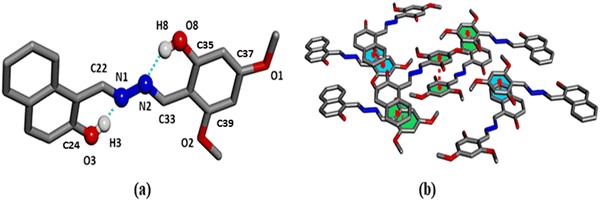 | ||
| Fig. 1 (a) Single crystal X-ray structure of the probe. (b) Supramolecular assembly and occurrence of π⋯π interactions (4.312 Å) in the molecule of H2L due to different non-covalent interactions. | ||
Spectral study
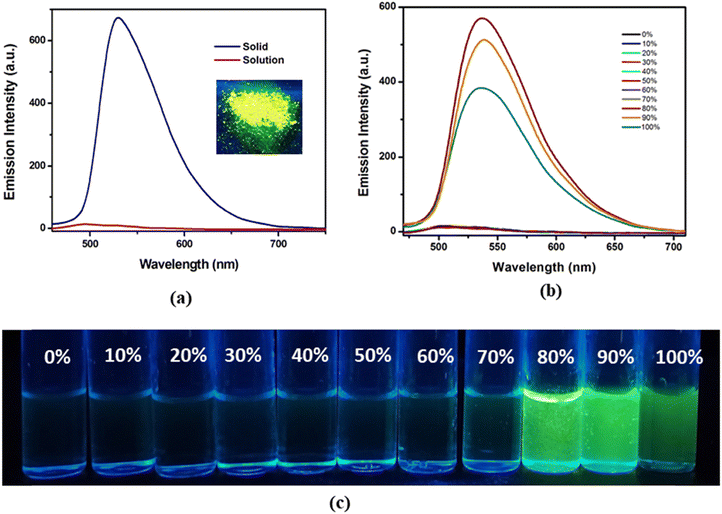
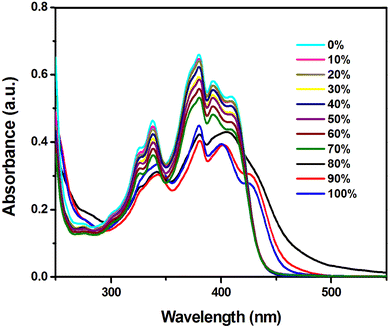
The absorption spectrum of H2L in acetonitrile (CH3CN) solution exhibits multiple absorption with two intense bands at 339 and 409 nm, which are assigned to π⋯π* and n–π* transitions, respectively (Fig. S5, ESI†). The probe H2L is weakly emissive (λem = 503 nm; λex = 420 nm) in pure CH3CN (fw = 0); increasing addition of water (fw) into CH3CN solution enhances the intensity of emission (λem = 537 nm) and the maximum intensity appears at fw = 80%. However, further addition of water (80% < fw ≤ 100%) results in gradual depletion of emission intensity presumably due to the destabilization of the emissive aggregated state. This phenomenon is referred to as aggregation induced emission (AIE).5 Moreover, an increased water fractions in the solvent system of the probe leads to a bathochromic shift in the emission spectrum at fw = 80%, with the emission maximum (λem = 537 nm) shifted by 34 nm compared to pure CH3CN (λem = 503 nm), which signifies the formation of J-type self-assembly where instigation of RIR within the aggregated framework ultimately promotes 152 fold enhanced fluorescence maxima together with an augmented quantum yield from 0.0025 at fw = 0 to 0.306 at fw = 80%, respectively (Fig. 2b).The effect of AIE is further confirmed from the vial-images taken under UV light of H2L in CH3CN (Fig. 2(c)) with varied fw, where the phenomenon of RIR in J-type self-assembly induces the probe to emit bright green emission (λem, 530 nm) from the CH3CN/H2O solvent mixture at fw = 80%. The fluorescence (FL) spectrum in the solid phase is more intense compared to the solution phase located at 503 nm upon excitation at 420 nm (Fig. 2a) and λem shifts to longer wavelength. Apart from the fluorescence characteristics, absorption spectral measurement of the probe in CH3CN and different CH3CN–H2O fractions has also been performed to explicate the AIE behaviour. Initially, H2L exhibits an absorption band at 390 nm in pure CH3CN and upon increased fw, the band corresponding to fw = 80% shows the level off tailing in the visible region (around 500–700 nm), aroused due to Mie scattering from the evolved nanoaggregates in the binary solvent mixture (Fig. 3).62
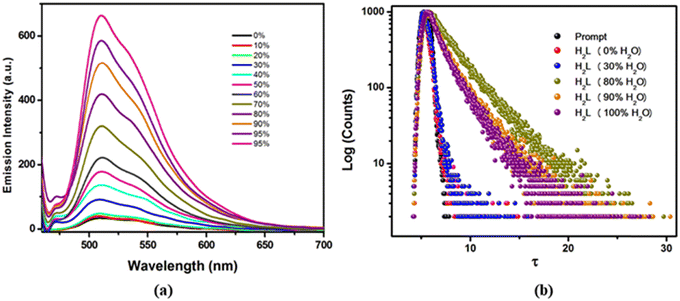
Correspondingly, the dynamic light scattering (DLS) measurement reveals the growth of particle size with increased fw, which is broadened from 41.04 ± 1.0 nm in pure CH3CN to 550 ± 6.0 nm in pure water (Fig. S6, ESI†). Scanning electron microscopic (SEM) images indicate change in the morphology of H2L in the presence of higher water fractions, where evolution of self-assembled spherical nanoparticles at fw = 80% leads to the formation of discontinuous irregular shaped particles at fw = 0% confirming the formation of such aggregates (Fig. 4). In order to understand the detailed mechanistic pathway behind AIE, viscosity-dependent fluorescence studies have been performed and the changes in the emission intensities of H2L in CH3CN are noted carefully with increasingly added glycerol fractions (Fig. 5a).
Interestingly, upon increasing the percentage of glycerol from 0 to 95, the emission intensity from H2L is concomitantly enhanced and reaches maximum at 95% glycerol content (Fig. 5a). Herein, thickening of the resultant solvent mixture with increased glycerol fraction induces considerable viscous drag, which imparts rigidity to the molecule upon freezing its free rotation explaining the more emissive behaviour of this AIE luminogen. Evidently in pure CH3CN, the free rotation of H2L around its azine bond results in weak emission on account of non-radiative decay, whereas 41-fold augmented emission intensity in 95% glycerol content supports the vivid effect of RIR, which enables the solid and/or aggregated state of the resultant probe to reveal the pronounced effect of AIE. Meanwhile, the time resolved fluorescence decay profile of H2L in the CH3CN/H2O solvent mixture with different fw is measured, where the relaxation kinetics fits well into bi-exponential decay and shows resemblance with AIE behaviour with an increased lifetime (τavg) from 0.023 ns (fw = 0) to 4.63 ns (fw = 80) (Fig. 5b).63,64 The enhanced fluorescence properties of the aggregated state of H2L ascertain that the resultant fluorophore might act as a promising solid state chemosensing material. The time-dependent fluorescence spectra of the thin film of H2L were collected upon exposure to UV light (λex = 365 nm) and its emission was constantly monitored after certain intervals of time. The emission intensity remains almost unaffected without any significant loss for over 2 h. This observation suggests that the probe H2L possesses sufficient photostability (Fig. S7, ESI†).
The compact packing mode in the solid phase results in improved fluorescence efficiency, which has further been explored as a reversible signalling protocol for solvent-free detection of acid/base vapour. Hence, to check the sensory activity of aggregated H2L, a thin film of approximately 1 cm2 area is immersed in 10−3 M CH2Cl2 solution of the probe and allowed to dry in air. Subsequently, the optical behavior of the homogeneously coated yellow-emissive thin film was noted. Firstly, the solid-state luminescence spectrum of the H2L film reveals an intense emissive band at around 530 nm (λex = 420 nm). Then the film upon exposure to HTFA vapour responds rapidly through notable rapid quenching of emission, along with a significant red shift in the absorption maximum indicating a distinguished chromogenic transformation from bright yellow to orange. Such behaviour is prominent in the presence of gaseous HTFA while for other acid vapours the effects are less significant even on prolonged exposure (Fig. S8, ESI†).
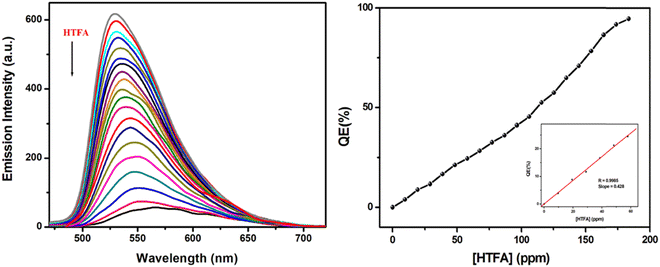
Then fluorescence titration experiment is performed for the thin film while exposing the system to increasing concentration of HTFA vapour (0–183.35 ppm), which reveals a gradual decrease in the emission intensity of the thin film, accompanied with shifting of the characteristic emissive band from 530 nm to 565 nm in the presence of saturated HTFA vapor (Fig. 6a). Accordingly, concentration-dependent FL quenching exhibits an almost nonlinear fluorogenic response towards entire HTFA vapor concentration, where the quenching efficiency (QE, 1 − I/I0) of the H2L film reaches up to 94.72% when HTFA vapor concentration is as high as 183.35 ppm, with a rapid response time of 8.5 s (Fig. 6(b) and Fig. S9, ESI†). Considering the linear variation in QE (%) with respect to lower HTFA vapor concentration (0 ≤ [HTFA] ≤ 100 ppm), the limit of detection (LOD: 3σ/slope), calculated from the luminescence quenching titration curve, is found to be as low as 1.41 ppm, which in turn supports the emissive self-assembled substrates as a sensitive platform for HTFA vapor detection (Fig. S10, ESI†). The Stern–Volmer plot of [(I0/I) − 1] vs. [HTFA] displays a steep upward bending at [HTFA] > 152 ppm (Fig. 7(a)), while a linear response is observed at concentration lower than 152 ppm (inset of Fig. 7(a)). The Stern–Volmer constant (KSV = 1.0984 × 10³ M−1) is calculated from the linear segment of the S–V plot, which confirms reasonable interaction between the analyte and the probe.65,66 Also, the colorimetric response has further been verified from the remarkable red shift of the absorption band of the thin film from 430 to 479 nm before and after the addition of saturated HTFA vapor (Fig. 7(b)).
Reversibility of properties is an important parameter for reusability of a material in the sustainable development. Accordingly, the self-assembled film of H2L is subjected to sequential exposure to saturated vapors of HTFA and NEt3 (TEA). Meanwhile, FESEM images clearly demonstrate the desired changes in the respective morphologies before and after treatment with TFA vapor followed by an exploration of the acid-treated film in TEA vapor. The morphology of the free probe depicts a robust interconnecting plate like porous network of the aggregated probe, which upon treatment with HTFA collapses to a distorted structure, causing quenching of emission intensity. Interestingly, a densely aggregated morphology started to evolve again in the presence of TEA vapor with restored emission intensity (Fig. 8). Importantly, the film acts as a recyclable emissive and colorimetric optical switch which turns off its emission and alter its visible color from yellow to orange in the presence of HTFA due to the disruption in ordered morphology.
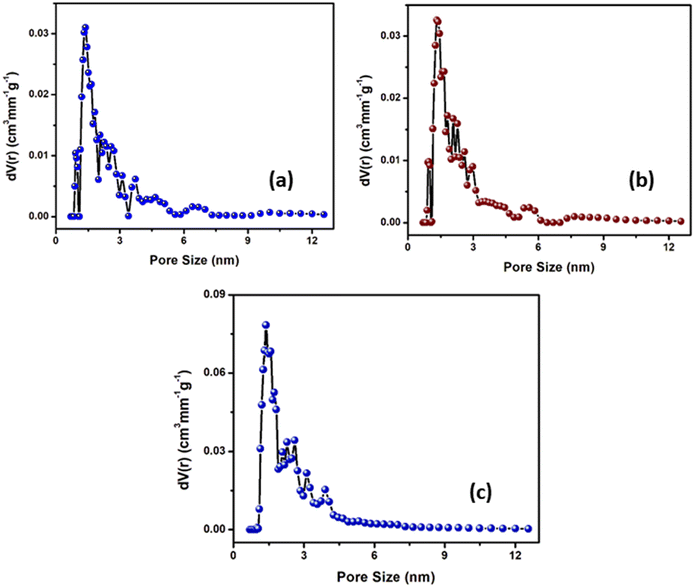
The porosity of the sample is studied by exposing it to HTFA/TEA vapour so as to investigate the reversibility response on the surface properties of the probe. The pore distribution of the sample was calculated with the help of non-local density function theory (NLDFT).67 The BET N2 adsorption–desorption isotherms of the samples measured at 77 K are displayed in Fig. S11 (ESI†) which provide information on the pore size distribution revealing a pore diameter of 1.38 nm (H2L), 1.32 nm (H2L + HTFA) and 1.38 nm (H2L + HTFA + TEA) (Fig. 9). This reversible change in pore size observed for the respective samples on treatment with HTFA followed by TEA is in good agreement with reversible sensing response.
Notably, in the emission spectra, the original emission is restored and its yellow color is recovered on exposure to TEA (Fig. 10(a)). The reversibility of the probe can be repeated up to 6 cycles. The PXRD pattern clearly explains the reversible acidochromic behaviour of probe in the presence of HTFA/TEA. The PXRD of the free probe with sharp and intense reflection peaks changes into a relatively less intense diffractogram in the presence of HTFA, which almost recovers back to its pattern of the free probe in the presence of TEA (Fig. 10(b)).
 | ||
| Fig. 10 (a) Reversibility of the probe H2L subjected to HTFA/TEA cycles. (b) PXRD patterns of the probe in presence of HTFA/TEA. | ||
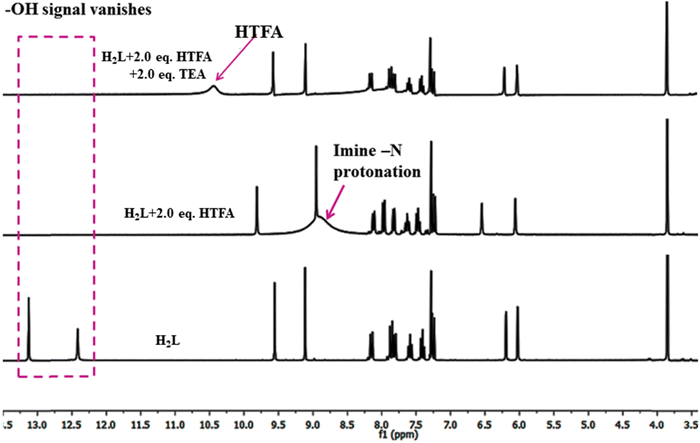
The reversibility of sensing ability has been confirmed through 1HNMR titration of H2L with successive addition of HTFA and TEA in CDCl3 solvent. On addition of HTFA, the phenolic protons (OH (1,10)) attributed to the naphthyl and dimethoxyphenyl moiety at 13.12 and 12.41 ppm are completely vanished with the generation of a broad signal at 8.95 ppm due to the protonation in imine nitrogen (N![[double bond, length as m-dash]](https://www.rsc.org/images/entities/char_e001.gif) CH(9)) of the methoxy unit. The resultant shift in the peak position is attributed to the proton transfer from the carboxylic group of HTFA to the imine-N forming an ionic compound. The aromatic protons attached to the naphthyl ring remain unaltered. Out of the two aromatic protons of the dimethoxyphenyl ring, the proton (C–H(12)) adjacent to the methoxy unit exhibits downfield shifts from 6.20 to 6.55 ppm while the other gets unaffected. When TEA is added to the acidified solution most of peak regenerates except the phenolic –OH signals and this phenomenon may support proton abstraction from -OH in the presence of base (TEA) (Fig. 11).68
CH(9)) of the methoxy unit. The resultant shift in the peak position is attributed to the proton transfer from the carboxylic group of HTFA to the imine-N forming an ionic compound. The aromatic protons attached to the naphthyl ring remain unaltered. Out of the two aromatic protons of the dimethoxyphenyl ring, the proton (C–H(12)) adjacent to the methoxy unit exhibits downfield shifts from 6.20 to 6.55 ppm while the other gets unaffected. When TEA is added to the acidified solution most of peak regenerates except the phenolic –OH signals and this phenomenon may support proton abstraction from -OH in the presence of base (TEA) (Fig. 11).68
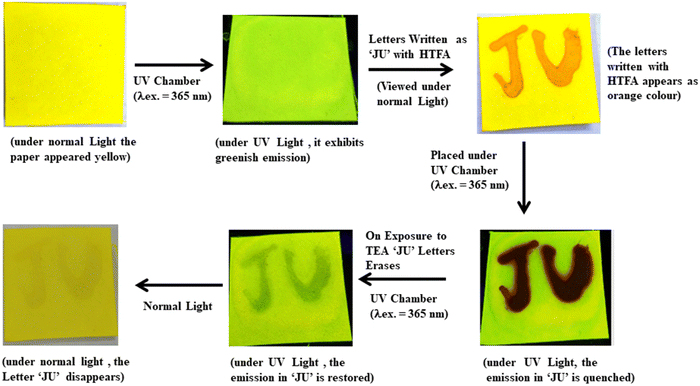
The reversible acidochromic response of the probe upon treatment with HTFA/TEA has further been employed for information shielding application which enables a reusable write–erase fluorescence platform. The non-fluorescent Whatman filter paper was dipped in CH2Cl2 solution of H2L and air dried. The probe coated paper emits bright green fluorescence upon excitation under UV light (λex = 365 nm). The inscription ‘JU’ is written using CH2Cl2 solution of HTFA which became readable and appeared as orange colored letters under normal light and exhibited quenching phenomena on excitation under UV light as clearly reflected from the photographs of the filter paper. The information gets easily erased upon exposure to TEA vapor within 15 seconds after writing. Thus a rapid reversible behaviour of the probe has been verified for write–erase–write application over multiple cycles under ambient conditions (Fig. 12).
CN− sensing
Along with solid-state acidochromism, the probe H2L exhibits interesting chemosensing properties in the solution phase. The chromogenic response from the solution of H2L has been verified upon treating with various anions (Cl−, Br−, I−, CN−, S2−, CH3COO−, S2O32−, SO42−, F−, HF2−, SCN−, NO3−, NO2−, N3−, OH−, CF3COO−, NCS−, HCO3−, CO32−, HSO3−, SO32−) in CH3CN/H2O (99![[thin space (1/6-em)]](https://www.rsc.org/images/entities/char_2009.gif) :
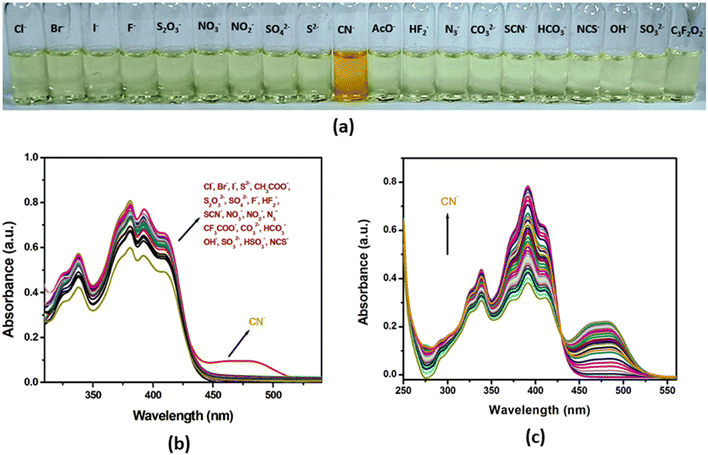
:![[thin space (1/6-em)]](https://www.rsc.org/images/entities/char_2009.gif) 1, v/v; HEPES buffer, pH 7.3) medium. Upon adding 2.0 equivalents of several anions, only CN− induces a prominent naked eye colorimetric response from colourless to orange while other anions essentially remain silent (Fig. 13(a)).69 The selective colorimetric response has been confirmed from the UV-Vis absorption study which shows the appearance of a new band at 479 nm in the case of CN− while for the rest of the anions, no significant change in spectra is noted (Fig. 13(b)). Consequently, the sensitivity of the probe has been investigated in detail by UV-Vis absorption titration experiment with CN−. On gradual addition of CN− to the probe solution in CH3CN/H2O (99
1, v/v; HEPES buffer, pH 7.3) medium. Upon adding 2.0 equivalents of several anions, only CN− induces a prominent naked eye colorimetric response from colourless to orange while other anions essentially remain silent (Fig. 13(a)).69 The selective colorimetric response has been confirmed from the UV-Vis absorption study which shows the appearance of a new band at 479 nm in the case of CN− while for the rest of the anions, no significant change in spectra is noted (Fig. 13(b)). Consequently, the sensitivity of the probe has been investigated in detail by UV-Vis absorption titration experiment with CN−. On gradual addition of CN− to the probe solution in CH3CN/H2O (99![[thin space (1/6-em)]](https://www.rsc.org/images/entities/char_2009.gif) :
:![[thin space (1/6-em)]](https://www.rsc.org/images/entities/char_2009.gif) 1, v/v; HEPES buffer, pH 7.3) medium, the existing absorption maxima at 381, 392 and 409 nm gradually decrease with the concomitant generation of a new broad band at 479 nm. Upon increasing CN− concentration, the absorption band varies linearly with a well-defined isobestic point at 430 nm and finally attains saturation on addition of 2.0 equivalents of CN− (Fig. 13(c)). Meanwhile, the limit of detection (LOD: 3σ/slope), estimated from the absorption titration curve, is 45.42 nM (Fig. S12, ESI†), which is found to be compatible with or even better than the LOD values of some of the reported probes (Table S4, ESI†). Incidentally the binding constant, evaluated from the Benesi–Hildebrand plot, is 9.27 × 10⁴ M−1, which indicates a stable association of probe H2L with CN− (Fig. S13, ESI†).
1, v/v; HEPES buffer, pH 7.3) medium, the existing absorption maxima at 381, 392 and 409 nm gradually decrease with the concomitant generation of a new broad band at 479 nm. Upon increasing CN− concentration, the absorption band varies linearly with a well-defined isobestic point at 430 nm and finally attains saturation on addition of 2.0 equivalents of CN− (Fig. 13(c)). Meanwhile, the limit of detection (LOD: 3σ/slope), estimated from the absorption titration curve, is 45.42 nM (Fig. S12, ESI†), which is found to be compatible with or even better than the LOD values of some of the reported probes (Table S4, ESI†). Incidentally the binding constant, evaluated from the Benesi–Hildebrand plot, is 9.27 × 10⁴ M−1, which indicates a stable association of probe H2L with CN− (Fig. S13, ESI†).
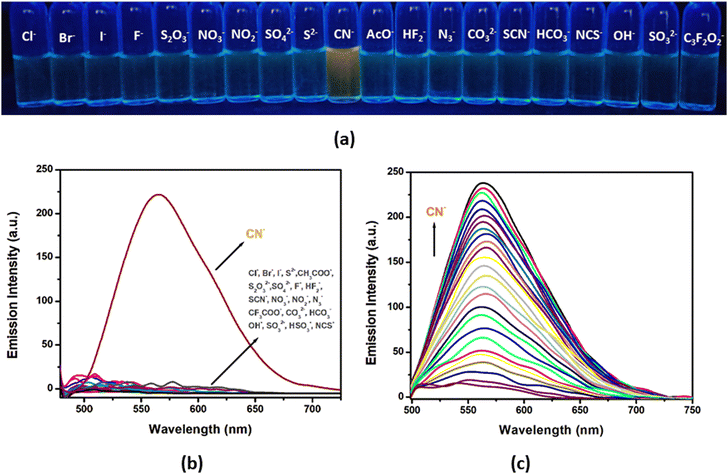
The fluorogenic response of H2L has further been examined upon monitoring the emission spectral response of the probe in the presence of aforementioned anions (Cl−, Br−, I−, CN−, S2−, CH3COO−, S2O32−, SO42−, F−, HF2−, SCN−, NO3−, NO2−, N3−, OH−, CF3COO−, NCS−, HCO3−, CO32−, HSO3−, SO32−) in CH3CN/H2O (99![[thin space (1/6-em)]](https://www.rsc.org/images/entities/char_2009.gif) :
:![[thin space (1/6-em)]](https://www.rsc.org/images/entities/char_2009.gif) 1, v/v; HEPES buffer, pH 7.3) medium (Fig. 14(a)). The enhancement of intensity and broadening of the emission band are observed only in the case of CN− while others exert no effect. Upon exciting the probe at 460 nm, a 20-fold enhancement of emission is detected selectively towards CN− with the emission band centred around 565 nm (Fig. 14(b)). On incremental addition of CN− (0–55 μM) into the probe solution (25 μM), the emission intensity gradually increases till it attains saturation at 2.0 equivalents of CN− addition and the change in emission intensity varies linearly with increasing concentration of CN− (Fig. 14(c)).
1, v/v; HEPES buffer, pH 7.3) medium (Fig. 14(a)). The enhancement of intensity and broadening of the emission band are observed only in the case of CN− while others exert no effect. Upon exciting the probe at 460 nm, a 20-fold enhancement of emission is detected selectively towards CN− with the emission band centred around 565 nm (Fig. 14(b)). On incremental addition of CN− (0–55 μM) into the probe solution (25 μM), the emission intensity gradually increases till it attains saturation at 2.0 equivalents of CN− addition and the change in emission intensity varies linearly with increasing concentration of CN− (Fig. 14(c)).
Effects of pH, temperature and time on CN− sensing
The effect of pH on sensing application of the probe has been extensively investigated. The change in the absorption and fluorescence spectra of H2L and H2L + 2CN− was noted from pH 2 to 12 in CH3CN/H2O (99![[thin space (1/6-em)]](https://www.rsc.org/images/entities/char_2009.gif) :
:![[thin space (1/6-em)]](https://www.rsc.org/images/entities/char_2009.gif) 1, v/v; HEPES buffer, pH 7.3) medium. In the case of highly acidic pH from 2 to 4, no noticeable change is observed in the characteristic absorption (λabs = 479 nm) and fluorescence (λexc = 570 nm) spectra of the probe on addition of CN−. This observation may validate the protonation of CN− into HCN in acidic medium which may hamper the abstraction of phenolic-OH. However, a considerable spectral change has been noted in the absorption and fluorescence behaviour of H2L on addition of CN− at pH 5 to 12 with a maximum at pH 7 which certifies that the probe is appropriate for the detection of CN− at neutral pH (Fig. S14(a) and (b), ESI†).
1, v/v; HEPES buffer, pH 7.3) medium. In the case of highly acidic pH from 2 to 4, no noticeable change is observed in the characteristic absorption (λabs = 479 nm) and fluorescence (λexc = 570 nm) spectra of the probe on addition of CN−. This observation may validate the protonation of CN− into HCN in acidic medium which may hamper the abstraction of phenolic-OH. However, a considerable spectral change has been noted in the absorption and fluorescence behaviour of H2L on addition of CN− at pH 5 to 12 with a maximum at pH 7 which certifies that the probe is appropriate for the detection of CN− at neutral pH (Fig. S14(a) and (b), ESI†).
Temperature plays a contributing role in the chemosensing of H2L. In this work, the effect of temperature (ranging from 5 to 75 °C) on the sensing efficacy of the probe towards the detection of CN− is considered. On increasing the temperature, the absorbance of the free probe practically remains unchanged whereas on CN− addition (H2L + 2CN−) an increase in absorbance at 479 nm is noted which varies linearly with the temperature. In a similar way, the fluorescence spectra of the probe in the presence of CN− are also examined upon temperature variation from 5 to 75 °C and the sensory response is studied. The observed fluorescence band of the free probe shows no changes to such temperature variation. However, the fluorescence response of the probe on addition of CN− has shown an interesting trend, showing a gradual decrease in the emission intensity with increasing temperature. This behaviour of the probe is beneficial for sensing CN− at both higher and lower temperature by two different spectroscopic techniques (Fig. S15(a) and (b), ESI†).
The effect of time on CN− sensing by H2L has also been explored through chromogenic and fluorogenic responses. The interaction of H2L with CN− is quite stable because the absorbance intensity corresponding to the 479 nm band remains constant for more than 2 h. A similar persistent behaviour is also observed in fluorescence response where the emission intensity of the band at 570 nm remains unchanged with time (Fig. S16(a) and (b), ESI†).70
1H NMR titration of H2L with CN−
1H NMR titration of the probe with CN− in DMSO-d6 explains the interaction of the probe in the presence of varying concentration of CN−. On addition of 1 equivalent of CN−, the intensity of the phenolic protons (OH (1,10)) at 12.72 (naphthyl-OH) and 12.26 ppm (dimethoxyphenyl-OH) diminishes, and it completely vanishes upon addition of 2 equivalents of CN− (Fig. 15). The imine peak (N![[double bond, length as m-dash]](https://www.rsc.org/images/entities/char_e001.gif) CH(8)) corresponding to the naphthyl ring undergoes significant upfield shift from 9.85 to 9.52 ppm compared to the shift of the imine singlet (N
CH(8)) corresponding to the naphthyl ring undergoes significant upfield shift from 9.85 to 9.52 ppm compared to the shift of the imine singlet (N![[double bond, length as m-dash]](https://www.rsc.org/images/entities/char_e001.gif) CH(9)) of the dimethoxyphenyl unit from 9.02 to 8.97 ppm. The doublet signal at 8.61 ppm (C–H(3)) is also downfield shifted and merges with the imine singlet. The remaining protons of the naphthyl unit undergo upfield shift where two protons (C–H(11,12)) corresponding to the dimethoxyphenyl unit exhibit marginal shift from 6.20 to 6.16 ppm. The overall shielding effect on the aromatic protons depicted in the 1H NMR titration of the probe with CN− (Fig. 15(a)) may be due to the negative charge of the deprotonated ligand (L2−).
CH(9)) of the dimethoxyphenyl unit from 9.02 to 8.97 ppm. The doublet signal at 8.61 ppm (C–H(3)) is also downfield shifted and merges with the imine singlet. The remaining protons of the naphthyl unit undergo upfield shift where two protons (C–H(11,12)) corresponding to the dimethoxyphenyl unit exhibit marginal shift from 6.20 to 6.16 ppm. The overall shielding effect on the aromatic protons depicted in the 1H NMR titration of the probe with CN− (Fig. 15(a)) may be due to the negative charge of the deprotonated ligand (L2−).
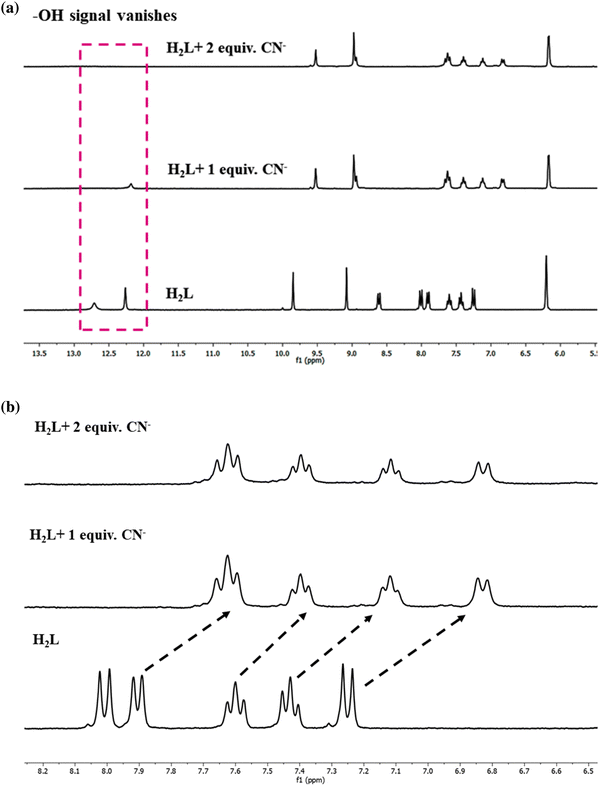 | ||
| Fig. 15 (a) 1HNMR titration of H2L on successive addition of CN− (DMSO-d6). (b) Expanded aromatic region of the 1HNMR titration curve of H2L with CN−. | ||
This initial result describes the proton abstraction that has been taken place by the analyte CN− anion. The equilibrium that exists between the phenolate and quinone form allows rapid interconversion between the two on account of resonance. Thus, the quinone form is relatively unstable and makes it difficult to detect such form. The 1HNMR spectral pattern of the aromatic region of the probe on titration with CN− reveals a broadening of the aromatic peaks with an upfield shift and the number of peaks remains almost unchanged.71 This observation is in accordance with the predominant existence of the phenolate type form (Fig. 15(b)).
In FITR analysis, the stretching bands in the CN− adduct were compared with that of the free probe. The IR spectrum of the CN− adduct reveals the diminishing of the intense broad band assigned to the phenolic peak at 3393 cm−1 which validates the deprotonation of phenolic-OH by CN−. A new absorption peak at 2070 cm−1 along with a weak stretching at 3386 cm−1 is found which may be due to H-bonded CN− which may appear due to close association in the solid state. Meanwhile, the two imine stretching bands appearing at 1629 and 1583 cm−1 of the free probe remain unchanged upon addition of CN−. These observations support the structural integrity of the molecule and affirm the predominance of the phenolate state of the adduct. Overall, the results of both NMR and IR spectra majorly hint at the predominant existence of the phenolate form while considering the chances of rapid interconversion of the quinone and phenolate form72 (Fig. S17, ESI†). The resultant ESI-MS (−ve) spectrum of the probe on addition of CN− in anionic mode gives out both the peaks at m/z value of 174.2801 (di-negative (L2−)) and 349.6396 (mono-negative (HL−)) respectively (Fig. S18, ESI†).
The spectra and theoretical computation
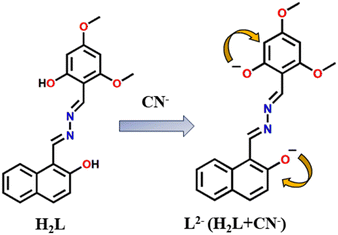
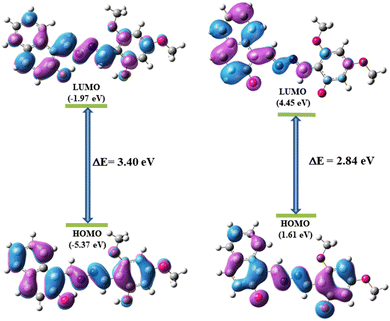
The UV-Vis spectrum of H2L + CN− shows an absorption band at 479 nm (Fig. 13(b)) that is red-shifted which may be due to lowering of energy separation between HOMO and LUMO in L2− (2.7410 eV, Table S5, ESI†) compared to H2L (3.1252 eV, Table S5, ESI†) as evident from vertical electronic excitation deduced from the TD-DFT/B3LYP/CPCM method. The enhancement in the emission intensity upon addition of CN− to H2L solution may be attributed to an extensive delocalization of charge between phenolato-O− and the aromatic rings, and the cleavage of the intramolecular hydrogen bonding may stop the ESIPT (Excited-State Intramolecular Proton Transfer) and may initiate “turn on” response (Scheme 2). Nonetheless, the overall results clearly depict that the probe H2L acts as a selective and sensitive naked eye colorimetric and “turn on” fluorogenic sensor towards CN−.73–75The mechanistic pathway for the chemoselective CN− sensing of the probe through deprotonation was experimentally verified from the 1HNMR titration and the noticeable changes in the absorption spectra.76 The observation has been correlated with the ground state and excited state electronic charge density of the probe calculated from density functional theory (DFT) computation which has been performed using X-ray coordinates of the probe (H2L) and optimised geometry of the probe in the presence of CN− (L2−) by the B3LYP method and the 6-311G basis set of Gaussian Program Package 09 (Tables S2 and S3, ESI†). The ground state energy of the free probe and its deprotonated form is presented in Fig. 16.
The time dependent-density functional theory (TD-DFT) calculation was performed to understand the electronic excited state phenomena of H2L and its deprotonated form L2− to predict the absorbance spectra and oscillator strength and the corresponding donor and acceptor FMOs. Selected transitions are enlisted and subsequently added in the supporting information (Table S5, ESI†). The electrostatic potential landscape (ESP) diagram of H2L (Fig. S19, ESI†) also reveals the electropositive character of O–H protons which favours for binding of CN−. From ESP mapping, it further confirms that the de-protonation site of O–H by CN− is in good accordance with the observation of NMR titration. The TD-DFT calculation reveals that H2L and L2− exhibit absorbance at 410 and 479 nm which may be associated with the electronic transition from HUMO to LUMO with an oscillation frequency (f) of 1.0918 and 0.8995 respectively. The HOMO generated for H2L reveals that the electron density is equally distributed between the naphthyl and dimethoxyphenyl unit whereas in the case of the LUMO it is relatively more localized on the naphthyl part. In the case of the deprotonated form, the electron density is also uniformly distributed in a similar pattern to that of HOMO of H2L but in LUMO it is mostly concentrated on the naphthyl part. The calculated HOMO–LUMO gap of the probe H2L (3.40 eV) is sternly decreased on deprotonation (L2−) upon interacting with CN− (2.84 eV) (Fig. 17). This reduced energy gap explains the red-shift in the absorption wavelength of the probe in the presence of CN−. Hence it can be concluded that λmax is well-correlated with experimental and theoretical findings which further support its sensing mechanistic deprotonation pathway. From TD-DFT calculations, the vertical electronic excitation energy representing the HOMO–LUMO transition of H2L and L2− is 3.1252 eV and 2.7410 eV (Tables S5, ESI†) showing close resemblance with the calculated ones. Selected orbitals along with their energy are listed in the supporting information (Tables S6 and S7, ESI†).77,78
Practical applications: detection of CN− in a paper strip and in food extract
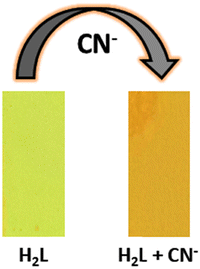
For practical utility, a portable paper strip infused with H2L is prepared which functions as a colorimetric detection kit for CN−. A test strip coated with H2L by immersing in an acetonitrile solution of the probe (25 μM) and air-dried is used to test CN− in solution at pH 7. The paper test strip is dipped into 50 μM CN− in CH3CN solution and dried in air. It resulted in a prominent colour change from yellow to orange as depicted from the images taken under normal light permitting visual detection of CN− ions (Fig. 18) without the involvement of expensive instrumental analysis. This “easy-to-prepare” test kit adds to the practical utility of the sensor H2L (Fig. 18).79The practical application of this CN− sensing probe was also further extended to the detection of endogenous cyanide from selected food extracts like bitter seeds, apple seeds and sprouted potato which contain cyanogenic glycosides. When the extracts from food samples were added to the probe H2L in CH3CN/H2O (99![[thin space (1/6-em)]](https://www.rsc.org/images/entities/char_2009.gif) :
:![[thin space (1/6-em)]](https://www.rsc.org/images/entities/char_2009.gif) 1, v/v; HEPES buffer, pH 7.3) medium, a distinctive visual change in the colour of the probe was observed along with red-shifting of absorbance at around 479 nm. The change in the emission spectrum of the probe resulted through relatively enhanced fluorescence on addition of food extracted solution. Thus, H2L could be used as a potential, simple and convenient sensor to analyse CN− in food samples (Fig. S20, ESI†).79
1, v/v; HEPES buffer, pH 7.3) medium, a distinctive visual change in the colour of the probe was observed along with red-shifting of absorbance at around 479 nm. The change in the emission spectrum of the probe resulted through relatively enhanced fluorescence on addition of food extracted solution. Thus, H2L could be used as a potential, simple and convenient sensor to analyse CN− in food samples (Fig. S20, ESI†).79
Reversibility
The reversibility of CN− detection has also been checked upon gradual addition of HTFA (H+) solution (10−3 M), where restoration of original absorbance at 381, 392 and 409 nm was observed with concomitant reduced absorbance at 479 nm, which clearly demonstrates the re-protonation of L2− by HTFA to generate the original product H2L (Fig. S21, ESI†). The outcome is also accompanied with decolouration of CN−-treated solution of H2L in the presence of HTFA (Fig. S22, ESI†). The reversible colorimetric response on addition of HTFA can be repeated up to 5 cycles.Logic gate
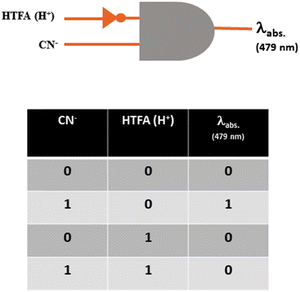
As the probe chromogenically analyses CN− through a reversible approach, an INHIBIT logic gate has been constructed for the reversible CN− sensing using the two chemical inputs CN−/HTFA (H+) and absorbance at 479 nm as the output signal. An output of ‘1’ is considered for the appearance of red-shifted absorbance at around 479 nm upon the addition of CN− while its disappearance on addition of HTFA (H+) is considered ‘0’. The input and output strings are connected with the combination of H2L, CN− and HTFA and are represented in the truth table for the logical gate (Fig. 19).Biological applications
In vivo cell cytotoxicity assay of the drug H2L has been checked on MDA-MB 231 and WI-38 cell lines and the MTT assay study has shown that the toxicity limit is 100 μM (Fig. S23, ESI†). Hence, 10 μM working concentration of the drug is selected to perform further studies. The results from fluorescence microscopy imaging in aqueous medium have shown a maximum level of fluorescence intensity when the MDA-MB 231 cell is treated with H2L in 80% H2O + 20% CH3CN medium at an emission level of 535 nm while a gradual diminution is observed at 100% water medium which further declines at 50% H2O + 50% CH3CN medium compared to untreated as well as cells treated in CH3CN medium only where no fluorescence is seen (Fig. 20(a)). Thus, these results depict the ability of H2L to function as a cell imaging probe in water medium. The cells were also treated with H2L (10 μM) in combination with CN− (5 and 10 μM respectively) in CH3CN at an incubation time frame of 30 min and they showed an enhanced fluorescence intensity at 650 nm compared to untreated cells (Fig. 20(b)). Based on the emissive properties of H2L in recognizing CN− in CH3CN medium it is very useful for tracking and analyzing CN− in living systems. Hence, H2L is biocompatible due to its minimal toxicity and is favourable for biological application.Conclusion
A multifunctional material 1-[(2-hydroxy-4,6-dimethoxy-benzylidene)-hydrazonomethyl]-naphthalen-2-ol (H2L) was well-characterized through different spectroscopic techniques (NMR, ESI-MS, IR) and the single-crystal X-ray diffraction study (SCXRD) confirmed the structure. The AIE active probe H2L exhibits the solid state emission phenomenon which accounts for the solvent-free acidochromic property in the presence of HTFA vapor with a detection limit (LOD) of 1.41 ppm. The acidochromic behaviour exhibits reversibility in the presence of sequential addition of HTFA/TEA vapors, which has further been employed to develop a security encrypted device. The probe has also been applied for the colorimetric and fluorogenic detection of CN− specifically over a series of other compatible anions in CH3CN/H2O (99![[thin space (1/6-em)]](https://www.rsc.org/images/entities/char_2009.gif) :
:![[thin space (1/6-em)]](https://www.rsc.org/images/entities/char_2009.gif) 1, v/v; HEPES buffer, pH 7.3) medium with a low detection limit (LOD) of 45.42 nM and its utilization in real application is also investigated. Further, a INHIBIT logic gate is constructed with two reversible inputs CN−/H+(HTFA). The MTT assay of the probe in the MDA-MB 231 cell line ensures biocompatibility even at higher concentration (100 μM) and the probe has successfully been applied for intracellular imaging of AIE phenomena at different fractions of water content as well as for the sensitive CN− detection which has clearly been concluded with the appearance of greenish and reddish emission in the cells.
1, v/v; HEPES buffer, pH 7.3) medium with a low detection limit (LOD) of 45.42 nM and its utilization in real application is also investigated. Further, a INHIBIT logic gate is constructed with two reversible inputs CN−/H+(HTFA). The MTT assay of the probe in the MDA-MB 231 cell line ensures biocompatibility even at higher concentration (100 μM) and the probe has successfully been applied for intracellular imaging of AIE phenomena at different fractions of water content as well as for the sensitive CN− detection which has clearly been concluded with the appearance of greenish and reddish emission in the cells.
Conflicts of interest
There are no conflicts to declare.Acknowledgements
The work is financially and logistically supported by Jadavpur University, West Bengal, India. S. P. is obliged to the Council of Scientific and Industrial Research (CSIR, file no. 09/096(0936)/2017-EMR-1) for granting the research fellowship. Dr Basudeb Dutta, Institute for Integrated Cell-Material Sciences (WPI-iCeMS), Kyoto University, Dr Suvendu Maity, R. K. Mission Residential College, Narendrapur, and Mr Suprava Bhunia are gratefully acknowledged for crystallographic measurements and structure manipulation.References
- B. Chen, B. Liu, J. Zeng, H. Nie, Y. Xiong, J. Zou, H. Ning, Z. Wang, Z. Zhao and B. Z. Tan, Adv. Funct. Mater., 2018, 28, 1803369 CrossRef.
- S. Jhulki, S. Seth, A. Ghosh, T. J. Chow and J. N. Moorthy, ACS Appl. Mater. Interfaces, 2016, 8, 1527–1535 CrossRef CAS PubMed.
- H. Li, H. Kim, J. Han, V.-N. Nguyen, X. Peng and J. Yoon, Aggregate, 2021, 2, 1–30 CrossRef PubMed.
- Y. Hong, J. W. Y. Lamab and B. Z. Tang, Chem. Soc. Rev., 2011, 40, 5361–5388 RSC.
- S. Sivalingam, K. Debsharma, A. Dasgupta, S. Sankararaman and E. Prasad, ChemPlusChem, 2019, 84, 392–402 CrossRef CAS PubMed.
- V. Bhardwaj, S. K. A. Kumar and S. K. Sahoo, Microchem., 2022, 178, 107404 CrossRef CAS.
- Z. He, C. Ke and B. Z. Tang, ACS Omega, 2018, 3, 3267–3277 CrossRef CAS PubMed.
- Y. Hong, J. W. Lam and B. Z. Tang, Chem. Commun., 2009, 4332–4353 RSC.
- J. Li, W. Yang, W. Zhou, C. Li, Z. Cheng, M. Li, L. Xie and Y. Li, RSC Adv., 2016, 6, 35833–35841 RSC.
- P. Alam, N. L. C. Leunga, J. Zhang, R. T. K. Kwok, J. W. Y. Lam and B. Z. Tang, Coord. Chem. Rev., 2021, 429, 213693 CrossRef CAS.
- H. Wan, Q. Xu, P. Gu, H. Li, D. Chen, N. Li, J. He and J. Lu, J. Hazard. Mater., 2021, 403, 123656 CrossRef CAS PubMed.
- M. H. Chua, K. W. Shah, H. Zhou and J. Xu, Molecules, 2019, 24, 1–42 Search PubMed.
- H. Xie, Y. Wu, F. Zeng, J. Chena and S. Wu, Chem. Commun., 2017, 53, 9813–9816 RSC.
- S. Dey, R. Purkait, K. Pal, K. Jana and C. Sinha, ACS Omega, 2019, 4, 8451–8464 CrossRef CAS PubMed.
- P. Alam, N. L. C. Leung, J. Zhang, R. T. K. Kwok, J. W. Y. Lam and B. Z. Tang, Coord. Chem. Rev., 2021, 429, 213693 CrossRef CAS.
- R. Hu, X. Yang, A. Qin and B. Z. Tang, Mater. Chem. Front., 2021, 5, 4073–4088 RSC.
- H. Duan, C. Zhuang, F. Mei, C. Zeng, R. A. Pashameah, M. Huang, E. Alzahrani, J. Gao, Y. Han, Q. Yu and Z. Wang, Adv. Compos. Hybrid Mater., 2022, 5, 776–787 CrossRef CAS.
- Z. Yu, Z. Yan, F. Zhang, J. Wang, Q. Shao, V. Murugadoss, A. Alhadhrami, G. A. M. Mersal, M. M. Ibrahim, Z. M. El-Bahy, Y. Li, M. Huang and Z. Guo, Prog. Org. Coat., 2022, 168, 106875 CrossRef CAS.
- Y. Feng, Y. Li, X. Ye, Z. Li, W. Wang, T. Liu, I. H. E. Azab, G. A. M. Mersal, M. M. Ibrahim, Z. M. El-Bahy, M. Huang and Z. Guo, J. Mater. Sci., 2022, 57, 10997–11012 CrossRef CAS.
- G. Li, L. Wang, X. Lei, Z. Peng, T. Wan, S. Maganti, M. Huang, V. Murugadss, I. Seok, Q. Jiang, D. Cui, A. Alhadhrami, M. M. Ibrahim and H. Wei, Adv. Compos. Hybrid Mater., 2022, 5, 853–863 CrossRef CAS.
- A. Vijeata, G. R. Chaudhary, A. Umar and S. Chaudhary, Eng. Sci., 2021, 15, 197–209 Search PubMed.
- M. Kumari, G. R. Chaudhary, S. Chaudhary and A. Umar, Eng. Sci., 2022, 17, 101–112 CAS.
- Y. Li, H. Li, W. Jina, X. Xua, H. Liu, Y. Ding, G. Wang, T. Zhang, Q. Peng, J. He, Q. Hu, L. Pan and K. Li, Dyes Pigm., 2022, 202, 110295 CrossRef CAS.
- J. Chen, Y. Zhu, Z. Guo and A. G. Nasibulin, Eng. Sci., 2020, 12, 13–22 CAS.
- H. Sun, J.-Y. Li, F.-F. Han, R. Zhang, Y. Zhao, B.-X. Miao and Z.-H. Ni, Dyes Pigm., 2019, 167, 143–150 CrossRef CAS.
- L. Huang, Y. Qiu, C. Wu, Z. Ma, Z. Shen and X. Jia, J. Mater. Chem. C, 2018, 6, 10250–10255 RSC.
- S. Suganya, K. Debsharma, E. Ravindran, M. K. Mahato and E. Prasad, ACS Appl. Polym. Mater., 2020, 2, 1222–1233 CrossRef CAS.
- D. Kong, Z. M. E. Bahy, H. Algadi, T. Li, S. M. E. Bahy, M. A. Nassan, J. Li, A. A. Faheim, A. Li, C. Xu, M. Huang, D. Cui and H. Wei, Adv. Compos. Hybrid Mater., 2022, 5, 1976–1987 CrossRef CAS.
- Y. He, M. Zhou, M. H. H. Mahmoud, X. Lu, G. He, L. Zhang, M. Huang, A. Y. Elnaggar, Q. Lei, H. Liu, C. Liu and I. H. E. Azab, Adv. Compos. Hybrid Mater., 2022, 5, 1939–1950 CrossRef CAS.
- Y. Wu, J. Liu, S. Lin, K. Huang, E. Chen, K. Huang and M. Lei, Eng. Sci., 2022, 18, 105–112 CAS.
- M. Gijare, S. Chaudhari, S. Ekar and A. Garje, ES Mater. Manuf., 2021, 14, 110–119 Search PubMed.
- S. Mishra, P. Chaudhary, B. C. Yadav, A. Umar, P. Lohia and D. K. Dwivedi, Eng. Sci., 2021, 15, 138–147 CAS.
- Y. Wu, E. Chen, X. Weng, Z. He, G. Chang, X. Pan, J. Liu, K. Huang, K. Huang and M. Lei, Eng. Sci., 2022, 18, 113–120 CAS.
- D. Rohilla, S. Chaudhary and A. Umar, Eng. Sci., 2021, 16, 47–70 CAS.
- H. Zhu, J. Huang, L. Kong, Y. Tian and J. Yang, Dyes Pigm., 2018, 151, 140–148 CrossRef CAS.
- J. Hua, Y. Liu, X. Zhanga, H. Han, Z. Li and T. Han, Dyes Pigm., 2021, 192, 109393 CrossRef.
- P. Xue, J. Ding, Y. Shen, H. Gao, J. Zhao, J. Sun and R. Lu, J. Mater. Chem. C, 2017, 5, 11532–11541 RSC.
- N. N. Prabhu, R. B. J. Chandra, B. V. Rajendra, G. George, A.-H. I. Mourad and B. Shivamurthy, Eng. Sci., 2022, 19, 59–82 CAS.
- M. Cao, D. Sun, H. Li, D. Lou, F. Yang, P. Du, D. Xu and S. Wang, ES Mater. Manuf., 2022, 18, 56–65 CAS.
- S. Cui, B. Wang, Y. Teng, Z. Wan, Y. Zan, L. Chen, Y. Li and X. Yan, Sens. Actuators, B, 2021, 344, 130120 CrossRef CAS.
- V. Ramanathan, P. J. Crutzen, J. T. Kiehl and D. Rosenfeld, Science, 2001, 294, 2119–2124 CrossRef CAS PubMed.
- S. Gupta and M. D. Milton, Dyes Pigm., 2019, 165, 474–487 CrossRef CAS.
- K. Debsharma, J. Santhi, B. Baire and E. Prasad, ACS Appl. Mater. Interfaces, 2019, 11, 48249–48260 CrossRef CAS PubMed.
- Z. Xu, X. Chen, H. N. Kim and J. Yoon, Chem. Soc. Rev., 2010, 39, 127–137 RSC.
- F. J. Baud, Hum. Exp. Toxicol., 2007, 26, 191–201 CrossRef CAS PubMed.
- S. Paul, S. Maity, S. Halder, B. Dutta, S. Jana, K. Jana and C. Sinha, Dalton Trans., 2022, 51, 3198–3212 RSC.
- Guidelines for drinking-water quality, World Health Organization, Geneva, Switzerland, 1996 Search PubMed.
- S. Paul, S. Dey, K. Pal, S. Maity, K. Jana and C. Sinha, ChemistrySelect, 2020, 5, 15233–15242 CrossRef CAS.
- G. M. Sheldrick, Acta Crystallogr., Sect. A: Found. Crystallogr., 2008, 64, 112–122 CrossRef CAS PubMed.
- A. L. Spek, Platon, The Netherlands, 1999.
- J. Farrugia, J. Appl. Crystallogr., 1997, 30, 565 CrossRef.
- M. J. Frisch, G. W. Trucks, H. B. Schlegel, G. E. Scuseria, M. A. Robb, J. R. Cheeseman, G. Scalmani, V. Barone, B. Mennucci, G. A. Petersson, H. Nakatsuji, M. Caricato, X. Li, H. P. Hratchian, A. F. Izmaylov, J. Bloino, G. Zheng, J. L. Sonnenberg, M. Hada, M. Ehara, K. Toyota, R. Fukuda, J. Hasegawa, M. Ishida, T. Nakajima, Y. Honda, O. Kitao, H. Nakai, T. Vreven, J. A. Montgomery Jr., J. E. Peralta, F. Ogliaro, M. Bearpark, J. J. Heyd, E. Brothers, K. N. Kudin, V. N. Staroverov, R. Kobayashi, J. Normand, K. Raghavachari, A. Rendell, J. C. Burant, S. S. Iyengar, J. Tomasi, M. Cossi, N. Rega, J. M. Millam, M. Klene, J. E. Knox, J. B. Cross, V. Bakken, C. Adamo, J. Jaramillo, R. Gomperts, R. E. Stratmann, O. Yazyev, A. J. Austin, R. Cammi, C. Pomelli, J. W. Ochterski, R. L. Martin, K. Morokuma, V. G. Zakrzewski, G. A. Voth, P. Salvador, J. J. Dannenberg, S. Dapprich, A. D. Daniels, O. Farkas, J. B. Foresman, J. V. Ortiz, J. Cioslowski and D. J. Fox, Gaussian 09, Revision D.01, Gaussian Inc., Wallingford, CT, 2009 Search PubMed.
- A. D. Becke, J. Chem. Phys., 1993, 98, 5648–5652 CrossRef CAS.
- W. R. Wadt and P. J. Hay, J. Chem. Phys., 1985, 82, 299–310 CrossRef.
- R. Bauernschmitt and R. Ahlrichs, Chem. Phys. Lett., 1996, 256, 454–464 CrossRef CAS.
- M. Cossi and V. Barone, J. Chem. Phys., 2001, 115, 4708–4717 CrossRef CAS.
- M. Cossi, N. Rega, G. Scalmani and V. Barone, J. Comput. Chem., 2003, 24, 669–681 CrossRef CAS PubMed.
- N. M. O’Boyle, A. L. Tenderholt and K. M. Langner, J. Comput. Chem., 2008, 29, 839–845 CrossRef PubMed.
- D. Laha, A. Pramanik, S. Chattopadhyay, S. K. Dash, S. Roy, P. Pramanik and P. Karmakar, RSC Adv., 2015, 5, 68169–68178 RSC.
- M. Mandal, D. Sain, Md. M. Islam, D. Banik, M. Periyasamy, S. Mandal, A. K. Mahapatra and A. Kar, Anal. Methods, 2021, 13, 3922–3929 RSC.
- D. Maiti, A. S. M. Islam, M. Sasmal, C. Prodhan and M. Ali, Photochem. Photobiol. Sci., 2018, 17, 1213–1221 CrossRef CAS PubMed.
- D. A. Patel, S. K. A. Kumar and S. K. Sahoo, J. Photochem. & Photobio. A: Chem., 2023, 437, 114465 Search PubMed.
- M. Mathivanan, B. Tharmalingam, O. Anitha, C.-H. Lin, V. Thiagarajan and B. Murugesapandian, Mater. Chem. Front., 2021, 5, 8183–8196 RSC.
- X. Feng, J. Zhang, Z. Hu, Q. Wang, M. M. Islam, J.-S. Ni, M. R. Elsegood, J. W. Lam, E. Zhou and B. Z. Tang, J. Mater. Chem. C, 2019, 7, 6932–6940 RSC.
- Y. Zhan, Q. Wei, J. Zhao and X. Zhang, RSC Adv., 2017, 7, 48777 RSC.
- P. Alam, N. L. C. Leung, H. Su, Z. Qiu, R. T. K. Kwok, J. W. Y. Lam and B. Z. Tang, Chem. – Eur. J., 2017, 23, 14911–14917 CrossRef CAS PubMed.
- N. Wu, B. Zhao, J. Liu, Y. Li, Y. Chen, L. Chen, M. Wang and Z. Guo, Adv. Compos. Hybrid Mater., 2021, 4, 707–715 CrossRef CAS.
- M. E. Abdelhamid, T. Murdoch, T. L. Greaves, A. P. O. Mullane and G. A. Snook, Phys. Chem. Chem. Phys., 2015, 17, 17967 RSC.
- V. Hemalatha and V. Vijayakumar, Inorg. Chem. Commun., 2022, 144, 109894 CrossRef CAS.
- D. Jothi, S. Munusamy, S. Manickam, S. Enbanathan, S. Manojkumar and S. K. Iyer, RSC Adv., 2022, 12, 30045–30050 RSC.
- D. Matiadis, C. Fountzoulaa, M. Trapali, P. Karkalousos and M. Sagnou, J. Mol. Struct., 2022, 1268, 133677 CrossRef CAS.
- P. Hellwig, Biochim. Biophys. Acta – Bioenerg., 2015, 1847, 126–133 CrossRef CAS PubMed.
- Q. Niu, T. Sun, T. Li, Z. Guo and H. Pang, Sens. Actuators, B, 2018, 266, 730–743 CrossRef CAS.
- D. Udhayakumari, Sens. Actuators, B, 2018, 259, 1022–1057 CrossRef CAS.
- S. Panja, A. Panja and K. Ghosh, Mater. Chem. Front., 2021, 5, 584–602 RSC.
- R. Bhaskar, V. Vijayakumara, V. Srinivasadesikan and S.-L. Lee, Spectrochim. Acta A Mol. and Biomol. Spectrosc., 2020, 234, 118212 CrossRef CAS PubMed.
- P. Karuppusamy and S. Sarveswari, J. Mol. Struct., 2022, 1248, 131494 CrossRef CAS.
- M. Sahu, A. Kumar, M. K. Rout, D. Nikunj, B. Sharma and G. K. Patra, Inorg. Chim. Acta, 2021, 528, 120600 CrossRef CAS.
- R. Bhaskar and S. Sarveswari, Inorg. Chem. Commun., 2019, 102, 83–88 CrossRef CAS.
Footnotes |
| † Electronic supplementary information (ESI) available. CCDC 2178275. For ESI and crystallographic data in CIF or other electronic format see DOI: https://doi.org/10.1039/d3ma00095h |
| ‡ Authors contributed equally. |
| This journal is © The Royal Society of Chemistry 2023 |

