 Open Access Article
Proton density monitoring at the interface of proton-donor and proton-acceptor regions in a protonic p–n junction with bias voltage
Jerzy J.
Langer
 *ab,
Mikołaj
Baranowski
bc,
Maciej
Kujawa
c and
Sebastian
Golczak
a
aFaculty of Chemistry, Adam Mickiewicz University in Poznań, Uniwersytetu Poznanskiego 8, Poznań 61-614, Poland. E-mail: langer@amu.edu.pl
bFaculty of Physics, Adam Mickiewicz University in Poznań, Uniwersytetu Poznanskiego 2, Poznań 61-614, Poland
cNovilet Poznań, Poland
First published on 18th September 2023
Abstract
The innovative method applied leads to direct insight into the protonic p–n junction, including changes in proton density with bias voltage. The concentration of protons in the p–n junction area increases with forward polarization (positive at the proton-donor doped site) and decreases with the blocking polarization (in the reverse direction). Due to the dependence of electrical conductivity and spin density from proton concentration (affecting the protonation degree of polyaniline molecules), polyaniline in the emeraldine base form (PANI EB) is an effective proton-sensitive spin probe, which has been used in studying the protonic p–n junction with L-band EPR. The results are the first direct evidence of the key role of protons in the protonic p–n junction.
Introduction
Protons are well known as charge carriers with high mobility in liquid water, ice and some other solids.1–4 Protons are fermions, like electrons, and the similarity goes much further, leading to a concept of protonic semiconductors. This was discussed in our first paper published in 1984.5 Our further studies led to the construction of a protonic rectifier and complex protonic systems, including a nano scale protonic rectifier.5–8 Other laboratories have also published a number of important articles on proton conductivity.4,9–13 This led to significant progress in the field of protonics, or electronics based on protons.Water, as an intrinsic protonic semiconductor, is doped with an acid (H+) and a base (HO−) to form a protonic p–n junction, which works similarly to a typical electron-based p–n junction. Polymer scaffolding (modified polystyrene) is used to maintain the mechanical stability of the water-based system. At the same time, the side groups (acidic and basic) play the role of dopants.
The protonic p–n junction, analogously to an electron p–n junction, is based on proton diffusion and proton transport with an applied external electric field. Thus, one can expect that the concentration of protons in the p–n junction area increases with its forward polarization (positive at the proton-donor doped site) and decreases with the blocking polarization (in the reverse direction, Fig. 1).
This statement, crucial to the basic mechanism of action of a protonic p–n junction, can be tested with a proton-sensitive probe.
Taking into account that the electrical properties of polyaniline depend on the degree of protonation of its macromolecules,14 we used it (in the form of an emeraldine base, PANI EB) as a spin probe, which is sensitive to protons. In this way, protons can be observed via the EPR signal. Using the L-band EPR technique, it is a new non-contact method, very convenient and effective.
Polyaniline was one of the first conductive polymers, examined in our laboratory since pioneering times (1975), and our first publication appeared in 1978.15 Interestingly, our studies in the field of protonics, including the protonic p–n junction, appeared at roughly the same time (1980), and the results were published in 1984.5–8 Ultimately, many laboratories have been involved and many papers have been published in both fields, and “conducting polymers” were awarded with the Nobel Prize in 2000 (Alan MacDiarmid, Alan Heeger and Hideki Shirakawa). Now, we describe a new application of polyaniline at the edge between protonics and organic electronics.
Results and discussion
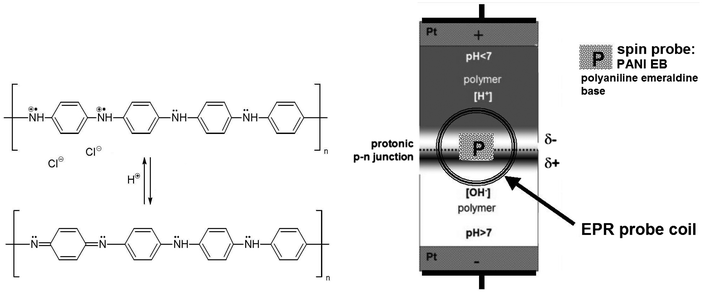
Water, as an intrinsic protonic semiconductor, is doped with an acid or a base, to form protonic analogues of the n-type or the p-type semiconductors, and then a protonic p–n junction.5–8,13 The modification and mechanical stability of the system is preserved using functionalised polymers – ion exchangers: Dowex 50W (D × 50) and Dowex 1 × 4 (D × 1) with the acidic groups –SO3H and the basic groups –[N(CH3)3]+OH−, respectively (Fig. 1 and 2-right).8The spin probe, a small amount of polyaniline emeraldine base PANI EB (1–2 mg), is deposited directly on the surface of the polymers in the p–n junction area, and only locally – at the side near the EPR probe coil (Fig. 2 and 4).
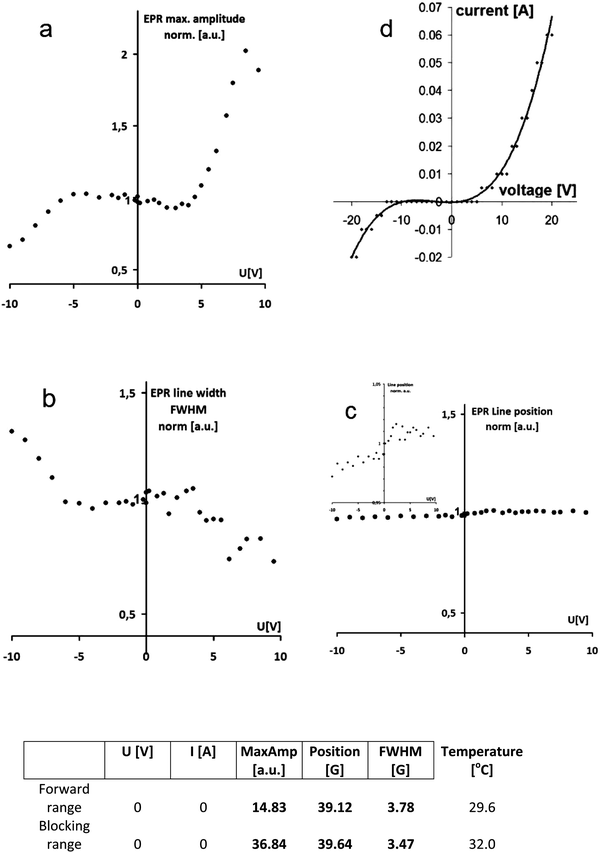
Analogously to the traditional electron-based p–n junction, the proton population increases dramatically within the protonic p–n junction in forward bias, as the proton current flows, compared to the blocking polarity with the limited current (Fig. 1). This leads to an increase in the electron spin density in the polyaniline spin probe (Fig. 2) and thus the amplitude of the EPR signal with the applied voltage. The maximum amplitude measured at a forward bias (10 V) is twice as high as with no voltage (0 V), and more than three times greater than that at blocking bias (−10 V), Fig. 3a.
 | ||
| Fig. 3 Monitoring of the protonic p–n junction in action vs. bias voltage using L-band EPR and PANI EB as a spin probe: EPR signal amplitude (a), line width (b) and line position (c), and I–V characteristics of a protonic p–n junction composed of the same materials8 (d) for comparison. The data set measured at a voltage of 0 V (direct read out) is presented in the table. | ||
 | ||
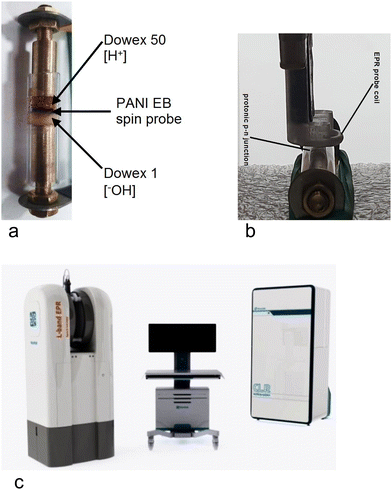
| Fig. 4 Experimental set-up: (a) tested sample and its holder; (b) EPR probe; (c) L-band EPR spectrometer (Novilet Poznań, Poland) with ERI imaging. | ||
At the same time, we observe a narrowing of the EPR line width by 50% (Fig. 3b), which is related to the greater number and mobility of electrons in polyaniline protonated to a higher degree because of increased proton density within the area of the p–n junction. The position of the EPR line is almost unchanged within the whole voltage range applied, particularly at the forward bias (Fig. 3c).
Due to the unequivocal relationship between the number of electron spins and protons in polyaniline, schematically illustrated in Fig. 2, the EPR signal amplitude diagram (Fig. 3a) resembles I–V characteristics of the protonic p–n junction (Fig. 3d), in accordance with the Shockley equation (by analogy to the classical p–n junction based on electrons):
| I = Is[exp(qU/kT) − 1]I |
The EPR signal starts to increase sharply at the voltage of 4.0 V, which corresponds to the forward polarization of the protonic p–n junction (with high proton density), and decreases at the voltage below −5.0 V in the range of blocking polarization leading to low proton density within the area of the p–n junction (Fig. 3a). In our EPR experiments, the proton current flowing through the diode (protonic p–n junction) is in the range of 20 mA at the voltage of 10 V.
Note that without the PANI EB spin probe, no EPR signal is recorded during the current flow and without the current. Thus, the EPR signal from the PANI EB spin probe corresponds to the presence of protons and increases with increasing proton density.
This proves that protons (and not electrons) are the key charge carriers in the protonic p–n junction, responsible for its formation, properties and operation.
The measurements we describe would not be possible on a standard X-band spectrometer equipped with a resonance cavity. The problem is the size of the sample and holder, as well as the large amount of water inside the sample, which makes the resonator unable to be matched and tuned.
The undoubted advantages of low-frequency EPR spectrometers for such measurements, including biological substances and imaging, have been described in many scientific papers.19–23
A milestone was the development and implementation (mostly in Eaton's laboratory) of the rapid scan direct detection technique.20–23
The development of low-frequency EPR instrumentation at the L-band (1–2 GHz) has made it possible to perform previously very hard EPR measurements on complex biological systems such as intact animals, isolated functioning organs and various solid state and water-containing samples. One of the extremely important parameters is the depth of the electromagnetic wave penetration into the tested matter. Non-invasive EPR measurements are limited to a penetration depth on the order of 1 cm at the L-band (∼1.2 GHz). The penetration depth can be increased to 8 cm or more by lowering the frequency to the 300–600 MHz range. The trade-off, however, is that the signal-to-noise ratio significantly decreases at these lower frequencies causing a decrease in spatial resolution and accuracy of measurement.19
Experimental
Two wet polymer layers: proton-donor (DOWEX 50) and proton-acceptor (DOWEX 1) – each approximately of 7 mm in length (total 14 mm), are deposited in direct contact with each other to make a protonic p–n junction,8 All inside a protecting glass tube, which is equipped with two metal electrodes (Cu or Pt-coated brass) at both ends (Fig. 4a).The diameter of the EPR resonator probe coil is 8 mm (Fig. 4b), so that the applied EM field does not interact with metal electrodes.
We use an L-band EPR spectrometer (Novilet Poznań, Poland) with imagining option ERI for low-frequency EPR measurements (Fig. 4c). Operating with a surface loop resonator of a diameter of 8 mm, the device is able to detect EPR signals from the 100 pmol (1013 spins) spin probe within a few seconds. It is suitable for measuring the dynamics of processes with high time resolution.
The open structure L-band EPR spectrometer (1150 MHz) enables real-time measurements on a macroscopic system through which a current flows, here the proton current. Protons interact with polyaniline (in emeraldine base form, PANI EB) generating unpaired electron spins, which can be detected with EPR. This way, PANI EB works as a proton-sensitive spin probe, and the spectra are collected point-by-point, using the Rapid Scan (RS) technique. The scanning range is 40 G, and the RF power generated by the resonator is 5 dBm.
To limit heating the sample, the current is turned on only during the EPR measurement for about 1 second, and then turned off, and the voltage is changed for the next measurement, separately within the range 0 V to +10 V (forward bias) and 0 V to −10 V (blocking bias).
Materials
Ion exchangers Dowex 50 W and Dowex 1–4 are the same as used in previous experiments.8Dowex 50 W, D × 50.
Dowex 50 W (100–200 meshes) is a strongly acidic ion exchanger with functional groups –SO3H, used as is in the hydrogen form; matrix: styrene-divinylbenzene; cross-linked 8%.
Elemental analysis (EA) (Elementar model Vario EL III): found: 30.79% C, 6.11% H, 0.00% N, 10.40% S; [C8H7SO3H–5H2O]n.
Dowex 1, D × 1.
Dowex 1 × 4 (100–200 meshes; SERVA) is a strongly basic ion exchanger, TYPE I, with functional groups (CH3)3–N+, used after activation with NH4OH; matrix: styrene-divinylbenzene (C10H12–C10H10–C8H8–C3H8N)x, cross-linked 4%.
Polyaniline Emeraldine Base, PANI EB is prepared in our laboratory according to the procedure described previously:15–18 aniline hydrochloride (6.9 g) was dissolved in 300 mL of 1 M hydrochloric acid. At the same time, 11.4 g of ammonium persulfate was dissolved in 200 mL of 1 M hydrochloric acid (separately). The ammonium persulfate solution was slowly added to a solution of aniline hydrochloride. The resulting dark-green solution was stirred with a magnetic stirrer at room temperature for 24 h. The precipitate was filtered under reduced pressure and washed several times with distilled water until the filtrate was nearly colorless and neutral.
The solid product was treated with 500 mL of 1 M ammonium hydroxide and stirred with a magnetic stirrer at room temperature for 20 h. Then, the precipitate was isolated by filtration under reduced pressure and washed several times with distilled water until pH ∼ 7.
The dark-blue emeraldine base (PANI EB) was dried under ambient conditions (yield 1.8 g) and characterized (FTIR, EPR), getting results similar to the values measured for materials previously prepared in our laboratory.15–18
Elemental analysis:
Found [%]: C 74.05, H 5.01, N 13.61, O 7.33.
Calculated [%]: C 72.69, H 5.09, N 14.13, O 8.07.
[C12H8N2·H2O]n, where one molecule of H2O is associated with two monomeric units of C6H4N.
Chemicals and solvents:
Hydrochloric acid (HCl) (Stanlab, pure p.a.) – 600 mL of 1 M solution prepared from concentrated hydrochloric acid (36%) – 50 mL of 36% HCl dissolved in 550 mL of H2O.
Aniline hydrochloride (C6H8NCl) (Fisher Scientific, pure p.a.) – 6.9 g of aniline hydrochloride dissolved in 300 mL of 1 M hydrochloric acid.
Ammonium persulfate [(NH4)2S2O8] (Chempur, pure p.a.) – 11.4 g of ammonium persulfate was dissolved in 200 mL of 1 M hydrochloric acid.
Ammonium hydroxide (NH4OH) solution 25% (POCh, pure p.a.) – 500 mL of 1 M solution prepared from concentrated ammonium hydroxide (25%) – 37 mL of 25% ammonium hydroxide dissolved in 463 mL of H2O.
Conclusions
This is the first direct evidence (based on direct proton monitoring) that protons play a key role in the formation and operation of the protonic p–n junction.Polyaniline emeraldine base (PANI EB) is an effective, proton-sensitive spin probe that can be used more widely to monitor proton concentration with EPR in a non-contact regime, e.g. in biomedical applications using the L-band EPR technique.
Author contributions
JJL – the concept, interpretation of the results, writing manuscript; MB – EPR experiments, elaboration and interpretation of the results; MK – EPR experiments; SG – preparation PANI EB.Conflicts of interest
No conflict of interest.Acknowledgements
We would like to thank the School of Science of the Adam Mickiewicz University in Poznan for financial support under the grant for the Inter-Faculty Research Project. The measurements were supported by Smart Growth Operation Programme under projects POIR.01.01.01-00-0025/15 and POIR.01.02.00-00-0077/18.Notes and references
- K.-D. Kreuer, Chem. Mater., 1996, 8(3), 610 CrossRef CAS.
- V. V. Krasnoholovets, P. M. Tomchuk and S. Lukyanets, in Advances in Chemical Physics, ed. I. Prigogine and S. A. Rice, John Wiley & Sons, Inc., 2003, vol. 125, p. 351 Search PubMed.
- P. Colomban, ChemInform, 2013, 13(1), 6 CAS.
- P. V. Hobbs, Ice Physics, Oxford University Press, Oxford, 2010, p. 197 Search PubMed.
- J. J. Langer, Appl. Phys. A: Solids Surf., 1984, 34, 195 CrossRef.
- J. J. Langer, Appl. Phys. A: Solids Surf., 1985, 38, 59 CrossRef.
- J. J. Langer and M. Martyński, Synth. Met., 1999, 107, 1 CrossRef CAS.
- J. J. Langer, E. Frąckowiak and S. Golczak, J. Mater. Chem. C, 2020, 8, 943 RSC.
- Ph Colomban, Solid State Ionics, 2023, 393, 116187, DOI:10.1016/j.ssi.2023.116187.
- T. Miyake and M. Rolandi, J. Phys.: Condens. Matter, 2016, 28, 023001 CrossRef PubMed.
- Z. Hemmatian, T. Miyake, Y. Deng, E. E. Josberger, S. Keene, R. Kautz, Ch Zhong, J. Jin and M. Rolandi, J. Mater. Chem. C, 2015, 3, 6407 RSC.
- Y. Deng, B. A. Helms and M. Rolandi, J. Polym. Sci., Part A: Polym. Chem., 2015, 53, 211 CrossRef CAS.
- Y. Deng, E. Josberger, J. Jin, A. Fadavi Rousdari, B. A. Helms, C. Zhong, M. P. Anantram and M. Rolandi, Sci. Rep., 2013, 3, 2481 CrossRef PubMed.
- N. P. S. Chauhan, R. Ameta and S. C. Ameta, Indian J. Chem. Technol., 2011, 18, 118 CAS.
- J. J. Langer, Solid State Commun., 1978, 26, 839 CrossRef CAS.
- J. J. Langer, B. Miładowski, S. Golczak, K. Langer, P. Stefaniak, A. Adamczak, M. Andrzejewska, L. Sójka and M. Kalisz, J. Mater. Chem., 2010, 20, 3859 RSC.
- M. Kalisz, S. Golczak, E. Frąckowiak, K. Langer and J. J. Langer, J. Mater. Chem. C, 2016, 4, 6634 RSC.
- J. J. Langer, K. Ratajczak, E. Frąckowiak and S. Golczak, ACS Omega, 2021, 6(50), 34650 CrossRef CAS.
- H. M. Swartz, et al. , Acad. Radiol., 2014, 21(2) DOI:10.1016/j.acra.2013.10.011.
- J. W. Stoner, D. Szymanski, S. S. Eaton, R. W. Quine, G. A. Rinard and G. R. Eaton, J. Magn. Reson., 2004, 170, 127 CrossRef CAS PubMed.
- S. Subramanian, J. W. Koscielniak, N. Devasahayam, R. H. Pursley, T. J. Pohida and M. C. Krishna, J. Magn. Reson., 2007, 186, 212 CrossRef CAS PubMed.
- T. Czechowski, W. Chlewicki, M. Baranowski, K. Jurga, P. Szczepanik, P. Szulc, K. Tadyszak, P. Kedzia, M. Szostak, P. Malinowski, S. Wosinski, W. Prukala and J. Jurga, J. Magn. Reson., 2014, 248, 126 CrossRef CAS PubMed.
- J. P. Joshi, J. R. Ballard, G. A. Rinard, R. W. Quine, S. S. Eaton and G. R. Eaton, J. Magn. Reson., 2005, 175(1), 44 CrossRef CAS PubMed.
| This journal is © The Royal Society of Chemistry 2023 |


