 Open Access Article
Potential mediated electrochemical recycling and sensing of cadmium ions in wastewater over ZnO/SA-g-PPy biocomposite†
Sandeep
Verma
ab,
Ashok K.
Sharma
*a and
Saroj K.
Shukla
 *b
*b
aThin-Film Lab Department of Chemistry, Deenbandhu Chhotu Ram University of Science and Technology, Murthal 131039, India. E-mail: draksharma.chem@dcrustm.org
bDepartment of Polymer Science, Bhaskaracharya College of Applied Sciences, University of Delhi, Delhi 110075, India. E-mail: sarojshukla2003@yahoo.co.in
First published on 10th July 2023
Abstract
Potentiometric sensing and electrochemical recycling of cadmium ions have been demonstrated over chemically interactive and electrically conducting bio-nanocomposite film comprised of zinc oxide, sodium alginate, and polypyrrole (ZnO/SA-g-PPy) using a laboratory-designed electrochemical setup. The chemical structure, functionality, morphology, crystallinity, conductivity, and physico-mechanical properties of composite and constituents were investigated by infrared spectrometry, X-ray diffractometry, scanning electron microscopy, and other relevant standard techniques. The analytical results reveal the evolution of chemically interactive sites along with electrochemical responsive nature due to the liberation of interactive sites in sodium alginate during composite formation towards the cadmium ions present in solution states along with electrical conductivity. Further, a thin film of composite cast on ITO-coated glass was explored for potentiometric sensing of trace cadmium ions in the range of 0.1 μM to 1000 μM, with a sensitivity of 0.255 mV μM−1 cm−2, response time of 40 s, recovery time of 10 s, and stability of 80 days, along with 72% extractability after the application of external optimized potential, i.e., 0.48 V, on the used sensing electrode. The mechanism of recycling and sensing has been proposed based on induced potential and applied external potential against electrodes after electrochemical interaction between cadmium ions and ZnO/SA-g-PPy-based electrode along potentiometric reductive desorption of adsorbed cadmium ions due to electrochemical reduction and desorption.
1. Introduction
Electrochemical recycling is an important tool to ensure the circular economy, optimum use of materials, valorization of waste materials, controls, and optimization of chemical pollution in water, soil, and edible samples. This method is based on electro-reduction, electrodeposition, electrocoagulation, electrodialysis, electro-floatation, and electro-sorption. Further, different electrochemical recycling methods are also projected as potential tools to valorize different pollutants in value-added products. The method has been explored to convert gaseous carbon dioxide into different organic compounds, collection of a homogeneous catalyst, separation of heavy metals from battery electrodes and polluted water after exploring suitable electroactive materials like nanocomposites and polymer nanocomposites after optimized reduction potential and surface interactivity. Currently, uncontrolled industrialization and urbanization have yielded exponential increases in heavy metal pollutants like titanium, chromium, zinc, nickel, copper, lead, mercury, and arsenic in water, soil, fruits, vegetables, and seafood.1,2 Further, heavy metal pollutants also percolate in water, fruits, vegetables, fishes, and other aquatic animals, which are also responsible for their biomagnification after entering the food chain. However, some of the heavy metals are essential in biological reactions within prescribed limits along with huge industrial importance and technical applications.3 Therefore, the determination and recycling of these metals are important for screening polluted water, soil, and edible items along with the valorization and sustainable use of residual heavy metals.4 Furthermore, the problems and importance of different heavy metals have been always fascinating areas for precise determination and extraction of different heavy metals after using different analytical techniques, i.e., AAS, ICAP, GC, HPLC, mass spectrometry, chemical, and electrically recycling methods. Although some of the methods exhibit high sensitivity and accuracy, there are the limitations of high cost, sophisticated infrastructure, and need for trained personnel for operation and application. Therefore, the development of portable and cost-effective sensors and recycling methods for heavy metals with better features is important for society and industries.5,6In this context, several types of sensors (optical, electrical, and mechanical) have been developed using metals, metal oxides, conducting polymers, carbon nanostructures, and their composites for sensing heavy metals.7–10 Among the different heavy metal sensors, the potentiometric sensors exhibit zero consumption of analytes, higher sensitivity, and are of a self-powered portable nature.11 Several potentiometric sensors are also reported for cadmium sensing with limited features using different electrode materials and techniques, i.e., voltammetry, amperometry, and potentiometry.12,13 A comparison of representative potentiometric cadmium sensors is made in Table 1, along with their limitations and future need.
| No. | Composite | Pollutant | Method | Observations | Ref. |
|---|---|---|---|---|---|
| 1 | OAK BC-AUNPs liquid carbon paste electrode | Cd2+ | Amperometry | Linear range of 0.5 μM to 6.0 μM for Cd2+, Pb2+, and Hg2+ and the detection limit is 0.09 μM, 0.366 μM, and 0.489 μM respectively | 14 and 15 |
| 2 | Au/ZnS/ZnO | Cd2+ | Potentiometric | Concentration range from 0.1 to 100 μM and sensitivity is 153.3 μA mm−1 cm−2 | 16 |
| 3 | Carbon quantum dots (CQDs) from Polyalthia longifolia | Cd2+ | Fluorescence | The linear range of 7.3 nM–12 μM | 17 |
| 4 | PPy-GOx | Cd2+ | Amperometric | The linear concentration range for Hg2+ is 0.48–3.3 μM, 1.5–10 μM for Cu2+, 1.6–7.7 μM for Pb2+, and 4–26 μM for Cd2+ | 18 |
| 5 | Schiff base-ZnS | Cd2+ | Fluorometric | The limit of detection is 64.56 μM | 19 |
| 6. | Zeolitic imidazolate frameworks (ZIF-8) into cellulose (CelloZIF Paper) | Cd2+ | Electrochemical | Adsorption capacities of 66.2–354.0 mg g−1 and a limit of detection of 8 μM | 20 |
| 7 | Chitosan grafted polyaniline | Pb2+ | Potentiometric | Pb2+ ions ranging from 10−6 M to 10−3 M, sensitivity is 0.2379 mV μM−1 cm−1, response time is 40 s, and recovery time is 10 s with a stability of 64 days | 21 |
| 8 | Carbon-based electrode/calcinated and acidified clay composite (CPEACC) | Cd2+ | SWV | Preconcentration, detection limits of 0.15![[thin space (1/6-em)]](https://www.rsc.org/images/entities/char_2009.gif) 513 513![[thin space (1/6-em)]](https://www.rsc.org/images/entities/char_2009.gif) μmol L−1 and 0.24 μmol L−1 and 0.24![[thin space (1/6-em)]](https://www.rsc.org/images/entities/char_2009.gif) 227 227![[thin space (1/6-em)]](https://www.rsc.org/images/entities/char_2009.gif) μmol L−1 were obtained for Pb2+ and Cd2+ in the electrolyte solution and 0.08438 μmol L−1 were obtained for Pb2+ and Cd2+ in the electrolyte solution and 0.08438![[thin space (1/6-em)]](https://www.rsc.org/images/entities/char_2009.gif) μmol L−1 and 0.46 μmol L−1 and 0.46![[thin space (1/6-em)]](https://www.rsc.org/images/entities/char_2009.gif) 522 522![[thin space (1/6-em)]](https://www.rsc.org/images/entities/char_2009.gif) μmol L−1, respectively μmol L−1, respectively |
22 |
| 9 | Carbon nanomaterial synthesized from Justicia wynaadensis | Cd2+ | Fluorescence | 5.235 nM detection limit | 23 |
| 10 | ZnO/SA-g-PPy | Cd2+ | Potentiometric | Sensitivity, response, and recovery time are 0.255 mV μM−1 cm−2, 40 s, and 10 s. Sensing range of Cd2+ ion from 0.1 μM to 1000 μM | This work |
The above-mentioned findings and limitations of existing cadmium sensors in terms of portability, effectiveness, and extractability are confirming the need for the development of efficient cadmium sensors along with extractability due to the huge industrial importance and acute toxicity of cadmium as one of the first eight most toxic substances.24 The basic explored strategy for effective cadmium sensing is to design surface-responsive interactivity with optimum electrochemical reactivity after incorporating an ionic centre with appropriate binding energy.25 The integration of these properties is reported for efficient cadmium sensing after making the composite structure and designing metal–organic frameworks using different inorganic and organic components like conducting polymers, supramolecules, and biopolymers.26,27 Wang et al. have demonstrated a processable hydrogel of sodium alginate composite for efficient adsorption due to the evolution of abundant adsorption sites along with compressibility.28 The indigenous and induced electro-interactive nature of structurally engineered sodium alginate has been reported for sensing cadmium ions with limited features like sensing range and detection limits but confirms the potential of this valuable polymer structure.29,30 Therefore, along the lines of the above developments, in the present study, efforts are made to develop a chemically engineered sodium alginate composite for improved interactivity towards cadmium ions to prepare a portable potentiometric sensor offering recycling of cadmium ions with 81% extractability for up to 19 cycles.
2. Experimental
2.1. Materials
Pyrrole (99.9%), NaNO3 (99.9%), KNO3 (99.9%), cadmium sulphate (99.95%), ammonium persulfate (98%), zinc sulfate (99.5%), hydrochloric acid (HCl; 34.5%), and sodium alginate (SA; >75%, Mw 120–120k) were purchased from Sigma Aldrich, and used without any further purification.2.2 Synthesis of ZnO and ZnO/SA-g-PPy composite
![[thin space (1/6-em)]](https://www.rsc.org/images/entities/char_2009.gif) :
:![[thin space (1/6-em)]](https://www.rsc.org/images/entities/char_2009.gif) 55 mass ratio in a silica crucible at 450 °C for 90 minutes in a muffle furnace. Initially, the synthesis was also performed at temperatures of 400, 450, and 500 °C, and the amount of ZnSO4 was 1.0 g, 2.0 g, and 3.0 g. The best results were obtained under the reported conditions.
55 mass ratio in a silica crucible at 450 °C for 90 minutes in a muffle furnace. Initially, the synthesis was also performed at temperatures of 400, 450, and 500 °C, and the amount of ZnSO4 was 1.0 g, 2.0 g, and 3.0 g. The best results were obtained under the reported conditions.
The thus obtained white-colored product was collected, ground, and washed repeatedly to remove the residual alkali contents. Further, collected powder was dried in a vacuum oven at 100 °C for 10 hours and then stored in an airtight glass tube for future use.
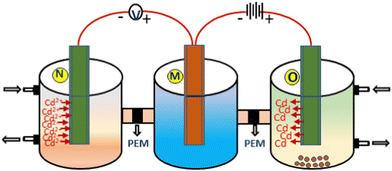
The sensing setup consists of three glass compartments labeled M, N, and O with the same volume of 200 mL. Compartment M is attached to both N and O through a tube of diameter of 1 mm and length of 1 cm containing Nafion membranes. Compartment M was filled with 100 mL of 0.1 M aqueous cupric sulfate solution along with a pure copper wire to use as a reference electrode, while in compartment N, ZnO/SA-g-PPy-based electrode was inserted to use as a working electrode after connecting both electrodes with a potentiometer. To measure the sensing response, i.e., induced potential, a 100 mL solution of CdSO4 with different concentrations from 10−9 M to 10−3 M was added in chamber N. The solution was stirred for 10 s, maintaining the pH after adding a laboratory-prepared buffer, and the potential was noted once the reading was stabilized.35 Initially, the optimum conditions were established by performing the sensing experiment at different pH and temperatures using identical analytical samples. The results revealed that a suitable pH for sensing is 7 with a temperature of 25 to 30 °C. The sensing of cadmium ions was also performed with wastewater samples in the same setup using standard addition methods. The other important sensing parameters, i.e., response time, recovery time, reproducibility, stability, and repeatability, were determined by reported standard methods under optimized conditions using the requisite electrodes and sensing samples.36
Further, for recycling of adsorbed cadmium ions, the sensing electrode was pulled out from sensing compartment N and inserted into compartment O and left for 5 to 10 s. After that, a variable external potential was applied against electrodes M and O with the help of a 20 W DC power supply. Further, the concentration of desorbed cadmium metal was measured by standard atomic absorption techniques to estimate the desorbed and reduced cadmium metal from the electrodes.
 | (1) |
A two-probe approach was used to estimate the conductivity after measuring the current against applied voltage with the help of a Scientech Digital Multimeter DM-97.37 The calculation of conductivity was performed using eqn (2) and (3):
 | (2) |
 | (3) |
Furthermore, standard ASTM procedures were used to determine the physico-mechanical parameters, i.e., porosity swelling index and water adsorption capacity. For this purpose, a square layer was sliced off the electrode using a surgical blade and soaked in 20 mL of a 1 M sodium chloride aqueous solution for 24 hours. The weight of the film before and after soaking was measured by a serious balance with minimum measurement of 0.1 mg. The water absorption capacity (%) of the films was calculated using eqn (4):
 | (4) |
The swelling index was calculated by comparing the average thickness of the soaked and dried films.38Eqn (5) was used to determine the porosity39 (P) of the film using the measured mass of film Ww and Wd based on the volume of solvent incorporated into the cavities per unit volume measured:
 | (5) |
3. Results and discussion
3.1. Synthesis of ZnO/SA-g-PPy
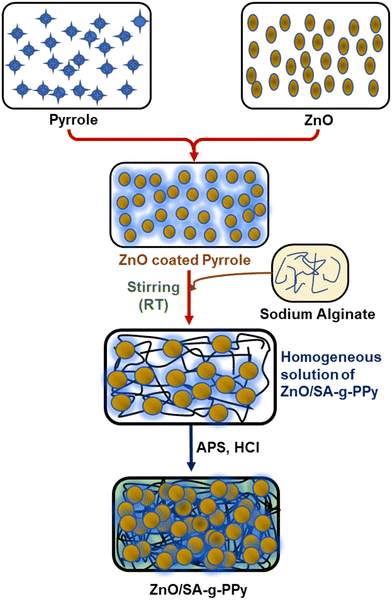
Synthesis of composite with an in situ chemical oxidation polymerization process involves better parameters, i.e., change in reaction yield, reaction temperature, and polymerization duration, compared with polymerization of polypyrrole (Table S1, ESI†). It may be indicated that the dispersion of ZnO permits the interaction between pyrrole and ZnO molecules, due to their Lewis acid and basic nature respectively. This interaction between ZnO and pyrrole destabilized the pyrrole molecules, which serve as better polymerizing monomers for effective polymerization with better parameters.40 Further, the increase in the pyrrole chain reduces its mobility due to growth in the chain and, after that, the resultant polypyrrole macro-ion combines with alginate ions to produce alginate-grafted polypyrrole containing ZnO centres. The change in reaction routes and composite structure also depends on thermodynamic parameters of constituents and associated energy during the transformation of monomer to polymer.41,42 The solvation energy is another aspect relating to progress of the polymerization process and the formation of a composite matrix if it is comprised of both polymeric and non-polymeric constituents. In this context, the heat dissipated during thermochemical interaction between Lewis base pyrrole and Lewis acid ZnO in the presence of solvents responsible for an improved polymerization process with better yield. Further, based on the above, a schematic of the polymerization reaction is shown in Fig. 2.3.2. FT-IR spectra
Fig. 3 shows FT-IR spectra of sodium alginate, polypyrrole, SA-g-PPy, and ZnO/SA-g-PPy, while Table S2 (ESI†) depicts the peak positions along with the respective functional groups. The spectrum of PPy shows the characteristics peaks of PPy at 906 cm−1 for in-plane C–N–H, 1043 cm−1 for C–N–C, 1187 cm−1 for C–C, 1221 cm−1 for C–H, 1361 cm−1 for C–N, and 1552 cm−1 for C![[double bond, length as m-dash]](https://www.rsc.org/images/entities/char_e001.gif) N–H. Similarly, the IR curve of SA shows its characteristic peaks at 927 cm−1 for C–O–H, 1046 cm−1 for C–O–C glycosidic linkage, and 1556 cm−1 for hydrogen bonding COO. Further, the spectrum of SA-g-PPy shows peaks for both PPy and SA with a change in position and intensity like a significant peak at 1712 cm−1, and the reduction in peak intensity of sharp peaks appearing around 1400 cm−1 for both SA and PPy. However, the IR spectrum of ZnO/SA-g-PPy shows complete disappearance of the peak at 1712 cm−1 and the appearance of a peak at 1400 cm−1 in the spectrum of SA-g-PPy due to the chemical interaction with ZnO as well as confirming the presence of ZnO in the composite.29,43
N–H. Similarly, the IR curve of SA shows its characteristic peaks at 927 cm−1 for C–O–H, 1046 cm−1 for C–O–C glycosidic linkage, and 1556 cm−1 for hydrogen bonding COO. Further, the spectrum of SA-g-PPy shows peaks for both PPy and SA with a change in position and intensity like a significant peak at 1712 cm−1, and the reduction in peak intensity of sharp peaks appearing around 1400 cm−1 for both SA and PPy. However, the IR spectrum of ZnO/SA-g-PPy shows complete disappearance of the peak at 1712 cm−1 and the appearance of a peak at 1400 cm−1 in the spectrum of SA-g-PPy due to the chemical interaction with ZnO as well as confirming the presence of ZnO in the composite.29,43
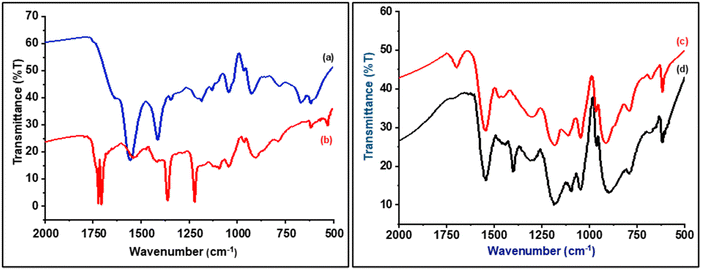 | ||
| Fig. 3 IR spectra of (a) sodium alginate, (b) polypyrrole, (c) sodium alginate-grafted polypyrrole, and (d) ZnO/sodium alginate-grafted polypyrrole. | ||
The interaction inferred from IR spectra between SA, PPy, and ZnO is responsible for thermodynamic phase reorientation and compatibility of the components in the composite matrix due to a change of thermodynamically induced surface engineering, i.e., solvation and crystallization of the composite structure. Although the evolution of mixed structures of eutectic salts is reported based on thermodynamics and some weak interaction rather than the formation of a single matrix of binary salt, it has not explained been for polymer composites.44,45 In this context, a common peak appears between 1552 and 1557 cm−1 due to hydrogen bonding between constituent polymers, which shows significant improvement like the PPy peak from less intense and broad to sharp and intense after grafting with SA.46 The evolution of a sharper peak reveals the evolution of the thermodynamic-oriented phase due to the transition from amorphous to crystalline nature. Further, the developing composite structure exhibits a shift due to interaction with ZnO as proposed in Section 3.1 due to improvement in crystallinity along with structural reorientation of constituent polymeric phase during grafting in the presence of ZnO.47,48
3.3. XRD
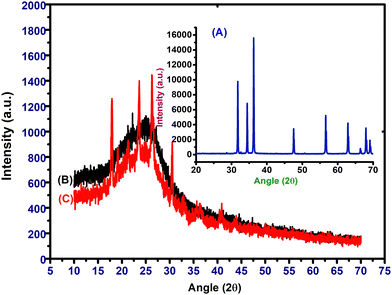
XRD curves of SA-g-PPy and ZnO/SA-g-PPy are shown in Fig. 4 and XRD-derived parameters, i.e., characteristic peaks (2θ values), corresponding planes, and d-values (Å), are listed in Table S3 (ESI†). The ZnO curve is given in the inset, which depicts the characteristic peaks at 2θ values of 31.78, 34.44, 36.22, 47.55, 56.64, 62.91, 66.35, 67.97, 69.18 for (100), (002), (101), (102), (110), (103), (200), (112), (201) planes and confirming the formation of pure zinc oxide (JCPDS no. 36-1451). Further, the XRD pattern of SA-g-PPy demonstrates an amorphous nature due to the presence of single broad peaks around 25.1°. The XRD pattern of ZnO/SA-g-PPy exhibits several peaks in the same range due to evolution of induced crystallinity during composite formation in the presence of ZnO; however, the peaks present at 30°, 32°, and 36° confirm the presence of ZnO in the composite.49Further, a comparison of the peak intensity of pristine ZnO with that of the composite reveals a significant increase in peak intensity for 100 planes along with a shift towards lower 2θ values due to aligned crystallinity at 100 plane by 97% due to interaction between zinc and nitrogen atoms of pyrrole molecules as well as expansion in the plane by 22.82% due to encapsulation of the polymer chain. Further, the significant shifts of peaks towards lower 2θ values in the pattern of the prepared composite also confirm the enhanced porosity, promising for better adsorption during sensing applications.
3.4. SEM
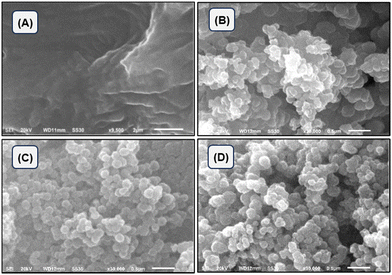
The microstructures of SA, polypyrrole, SA-g-PPy and ZnO/SA-g-PPy are shown in Fig. 5.The SEM image of the ZnO/SA-g-PPy composite demonstrates the presence of a multi-component composite with a porous nature along with a significant change in morphology due to phase reorientation as proposed by spectroscopic analysis.50
3.5. Physicochemical properties
The observed electrical conductivities of SA, PPy, and ZnO/SA-g-PPy were 6.01 × 10⁻⁷ S cm−1, 3.98 × 10⁻⁵ S cm−1, and 1.5 × 10⁻⁴ S cm−1. The increased conductivity of ZnO/SA-g-PPy is due to the grafting of PPy with SA as well as the doping effect of ZnO nanoparticles. The other physico-mechanical properties of the composite, i.e., thickness, swelling degree, and porosity, shown in Table 2, reveal the improvements due to the evolution of the porous matrix of the composite and confirm the adsorption capacity and suitability in sensing applications.51| No. | Physical property | Sodium alginate | Polypyrrole | ZnO/SA-g-PPy |
|---|---|---|---|---|
| 1 | Degree of swelling | 24.2% | 22.2% | 40% |
| 2 | Porosity | 0.0050 | 52.52 | 130 |
| 3 | Electrical conductivity | 6.01 × 10⁻⁷ S cm−1 | 3.98 × 10⁻⁵ S cm−1 | 1.5 × 10⁻⁴ S cm−1 |
3.6. Cadmium ion sensing
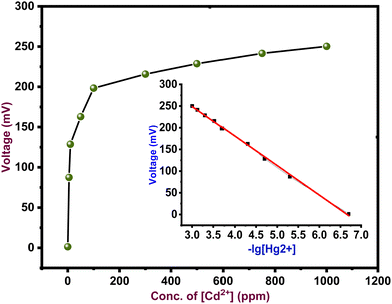
The trend of the observed potential of the ZnO/SA-g-PPy electrode against the concentration of Cd2+ ions at different pH and optimum pH is shown in Fig. 6. The trend shows better sensing performance at pH 7.A linear increasing trend in voltage with cadmium ion concentration at pH 7 from 0.1 μM to 1000 μM reveals the suitability of the electrode to potentiometrically detect cadmium ions in an aqueous medium.
The reduced Cd2+ ions generate a potential difference against the used reference electrode owing to the difference between the values for the electromotive force between zinc and cadmium ions, which is directly related to cadmium ions. The scheme for generation of potential is depicted through eqn (6) and (7):
Anode reaction:
| Zn → Zn2+ + 2e− | (6) |
 | (7) |
 | (8) |
3.7. Sensing parameters
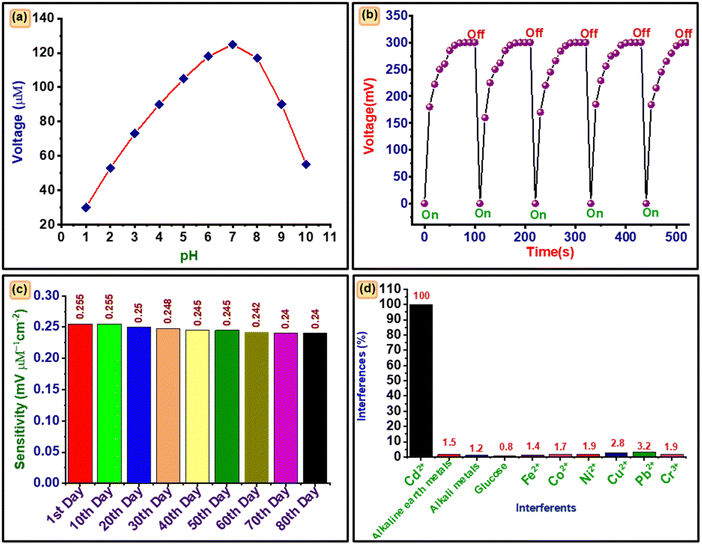
The sensing parameters, i.e., optimum pH and temperature, response time, and interference effect, of developed sensors are shown in Fig. 7.The change in induced potential with pH for 100 μM cadmium ions at ambient temperature is shown in Fig. 7(a). The graph indicates the best value of the potential at pH 7. This may be because at low pH the electrode may get oxidized and lose its properties, while at higher pH hydroxyl formation occurs which reduces the mobility and is responsible for reduced potential.53
Fig. 7(b) shows the change of induced potential at 100 μM concentration of cadmium ions with time. The curve indicates the regular increase and decrease in potential with and without cadmium ions, which confirms the repeated use of the proposed electrode for sensing cadmium ions with better reproducibility. Further, the 85% electrode potential was increased in 45 s and again recovered its original value in 10 s, which reveals the response recovery times of the electrode are 45 s and 10 s respectively.
The electrode was tested in the sensing of 10 samples under optimum conditions. The obtained results reveal a deviation of 1.54% and it confirms the reproducibility of the proposed electrode for cadmium sensing. The sensing response of seven electrodes prepared by a similar method was explored for sensing cadmium ions under identical conditions. The observed values differ from each other by 3.56% and confirm the repeatability of the proposed electrode.
The sensitivity of electrode was also monitored for 80 days at intervals of 240 hours and the results are given in Fig. 7(c). The trend confirms the consistent stability of the electrode for 80 days due to negligible deterioration in sensitivity from 0.255 to 0.240 mV μM−1 cm−2, i.e., 4%.
The developed sensing electrode was tested in a Cd2+ solution at a concentration of 0.1 mM in the presence of common interfering compounds. The sensing response was investigated after adding a 10-fold higher quantity of interferents, namely ions (Cr3+, Ni2+, Cu2+, Fe2+, Pb2+, Co2+), alkali metals, alkaline earth metals, and glucose. The percentage interference was calculated according to eqn (9):
 | (9) |
3.8. Real sample analysis
The presence of Cd2+ ions was also detected in natural water samples collected from sewage water of Murthal (Sonipat), Dwarka (New Delhi), and Yamuna river, New Delhi. The concentration of Cd2+ ions was determined using the above electrode and conditions after the normal addition process. The results for the electrode are given in Table 3 along with results determined by AAS methods.| No. | Samples | Reported method | |||
|---|---|---|---|---|---|
| Added (μM) | Recovery (μM) ± RSD | Recovery (%) | |||
| 1 | Sewage water (Murthal) | (a) | 50.0 | 49.25 ± 0.03 | 98.50 |
| (b) | 100.0 | 100.30 ± 0.05 | 100.3 | ||
| 2 | Sewage water (Dwarka) | (a) | 50.0 | 50.80 ± 0.05 | 101.6 |
| (b) | 100.0 | 100.60 ± 0.03 | 100.6 | ||
| 3 | Yamuna river (Dwarka) | (a) | 50.0 | 49.40 ± 0.05 | 99.8 |
| (b) | 100.0 | 99.0 ± 0.03 | 99.0 | ||
3.9. Cadmium extraction
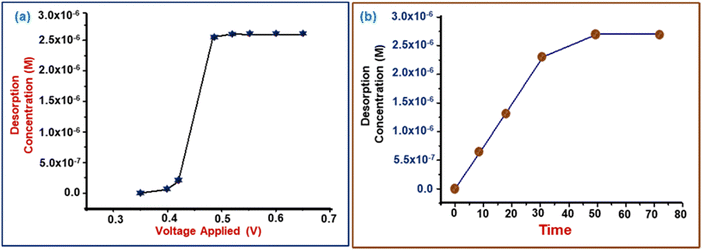
The amount of adsorbed cadmium ions extracted from the surface of the electrode after applying an external potential versus time is shown in Fig. 8(a). Initially, different voltages were applied to the electrode and the desorbed concentration was determined. It was found that 0.48 V is the optimum voltage for maximum desorption of cadmium metal. Further, the amount of desorption of metal ions with time is given in Fig. 8(b), which indicates that initially, the amount of desorption is higher and further reduces and becomes negligible. Finally, the rate of extraction was calculated using eqn (10), the rate of extraction being 6.6 × 10⁻⁵ mM min−1 with an overall extraction of 72%: | (10) |
3.10. Sensing mechanism
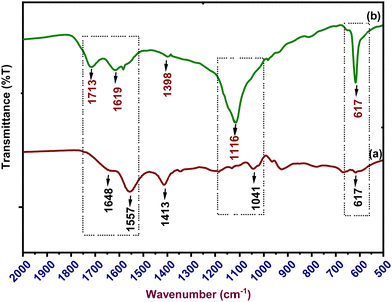
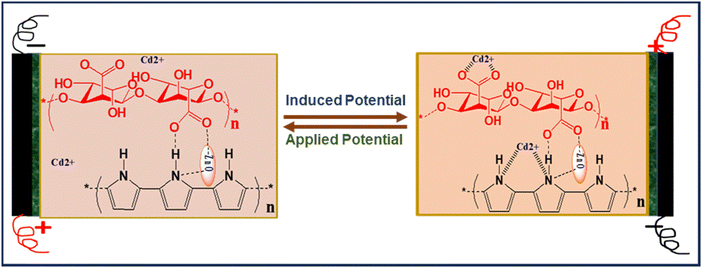
Further, to understand the sensing mechanism, the FT-IR spectra of the proposed electrode before and after sensing were recorded, which are shown in Fig. 9. The spectrum of the electrode after sensing reveals the appearance of significantly structural change peaks at 619 cm−1, 1117 cm−1 and 1617 cm−1, which reveals a structural after the adsorption of Cd2+ ions on ZnO/SA-g-PPy electrodes during sensing (Table S4, ESI†). A comparison of both before and after sensing indicates the evolution of a stronger peak at 1117 cm−1 due to the interaction between cadmium ions and the C–O group during sensing.54 Similarly, the increase in relative intensity of peaks present between 1500 and 1700 cm−1 along with shifts in their position indicates the structural alignment of the ZnO/SA-g-PPy structure after the interaction of cadmium ions with a chain of SA-g-PPy. Thus, this interactive adsorption of cadmium ions on the SA-g-PPy composite matrix containing zinc ions is responsible for the generation of a redox potential due to the difference in the potential between cadmium and zinc ions. This induced potential is proportional to the concentration of Cd+2 ions present in the solution and the basis for potentiometric sensing without any external energy.Further, after the electrode has been used for sensing, with the application of an external potential on the surface of the electrode, the weakly adsorbed cadmium ions can be desorbed due to electrochemical reduction and be recovered for further use. The extracted amount of cadmium was measured by atomic absorption spectroscopy after appropriate calibration and results indicate the extraction of 81% of total adsorbed cadmium ions after applying the potential. The complete mechanism for sensing and recovery of cadmium for the proposed electrode is illustrated in Fig. 10.
4. Conclusion and future prospects
A chemically functionalized, electrically responsive bio-nanocomposite comprised of ZnO, alginate, and polypyrrole has been prepared and explored for potential mediated recycling and sensing of cadmium ions in the concentration range of 0.1 μM to 1000 μM, with better sensing parameters, i.e., sensitivity of 0.255 mV μM−1 cm−2, response time of 50 s, and recovery time of 10 s with stability for 80 days. Further, the cadmium ions adsorbed on the proposed electrode are extracted by an amount of 72% after applying an external potential of 0.48 V. The mechanism of sensing and extraction has been proposed in terms of the surface electrochemical interaction between cadmium ions and the electrode based on the infrared spectra of the electrode before and after sensing. Thus, the proposed electrochemical sensor shows promise for use in on-site application for sensing and extraction of the Cd present in natural water samples in a cost-effective manner compared with other traditional sensors reported in the literature.Conflicts of interest
There are no conflicts to declare.Acknowledgements
The authors would like to acknowledge the All-India Council for Technical Education, AICTE for financial support (File No. 8-94/FDC/RPS (Policy-1)/2019-20) and Principal, Bhaskaracharya College of Applied Sciences, University of Delhi for encouragement and permission to work in college laboratory. Sandeep Verma wishes to acknowledge the University Grants Commission, India, for providing JRF (DEC18-118207).References
- N. Verma, M. Rachamalla, P. S. Kumar and K. Dua, Assessment and Impact of Metal Toxicity on Wildlife and Human Health, Metals Water, 2023, 93–110, DOI:10.1016/B978-0-323-95919-3.00002-1.
- D. Đukić-Ćosić, K. Baralić, D. Javorac, A. B. Djordjevic and Z. Bulat, An Overview of Molecular Mechanisms in Cadmium Toxicity, Curr. Opin. Toxicol., 2020, 19, 56–62, DOI:10.1016/J.COTOX.2019.12.002.
- J. Briffa, E. Sinagra and R. Blundell, Heavy Metal Pollution in the Environment and Their Toxicological Effects on Humans, Heliyon, 2020, 6(9), e04691, DOI:10.1016/J.HELIYON.2020.E04691.
- W. Jin and Y. Zhang, Sustainable Electrochemical Extraction of Metal Resources from Waste Streams: From Removal to Recovery, ACS Sustainable Chem. Eng., 2020, 8(12), 4693–4707, DOI:10.1021/ACSSUSCHEMENG.9B07007.
- Y. Yi, Y. Zhao, Z. Zhang, Y. Wu and G. Z.-E. A. Chemistry, Recent Developments in Electrochemical Detection of Cadmium, Trends Environ. Anal. Chem., 2022, 33, e00152, DOI:10.1016/j.teac.2021.e00152.
- M. Khairy, S. A. El-Safty and M. A. Shenashen, Environmental Remediation and Monitoring of Cadmium, TrAC, Trends Anal. Chem., 2014, 62, 56–68, DOI:10.1016/j.trac.2014.06.013.
- M. Li, H. Gou, I. Al-Ogaidi and N. Wu, Nanostructured Sensors for Detection of Heavy Metals: A Review, ACS Sustainable Chem. Eng., 2013, 1(7), 713–723, DOI:10.1021/SC400019A.
- I. Kaushal, A. K. Sharma, P. Saharan, K. K. Sadasivuni and S. Duhan, Superior Architecture and Electrochemical Performance of MnO2 Doped PANI/CNT Graphene Fastened Composite, J. Porous Mater., 2019, 26(5), 1287–1296, DOI:10.1007/S10934-019-00728-8.
- I. Kaushal, V. Kumar, P. Saharan, A. Mittal, R. Bhagat, S. Kumar and A. K. Sharma, Electrochemical Energy Storage and Hydrogen Peroxide Sensing Using Hybrid Framework of CeO2–MnO2 on Carbon Nano Fiber Composite, J. Alloys Compd., 2023, 934, 167740 CrossRef CAS.
- L. Dedelaite, S. Kizilkaya, H. Incebay, H. Ciftci, M. Ersoz, Z. Yazicigil, Y. Oztekin, A. Ramanaviciene and A. Ramanavicius, Electrochemical Determination of Cu(II) Ions Using Glassy Carbon Electrode Modified by Some Nanomaterials and 3-Nitroaniline, Colloids Surf., A, 2015, 483, 279–284, DOI:10.1016/J.COLSURFA.2015.05.054.
- E. Zdrachek and E. Bakker, Potentiometric Sensing, Anal. Chem., 2021, 93(1), 72–102, DOI:10.1021/ACS.ANALCHEM.0C04249.
- R. Saylakcı and H. Incebay, An Electrochemical Platform of Tannic Acid and Carbon Nanotubes for the Sensitive Determination of the Antipsychotic Medication Clozapine in Pharmaceutical, J. Electroanal. Chem., 2021, 898, 115638, DOI:10.1016/j.jelechem.2021.115638.
- H. Incebay, L. Aktepe, L. Aktepe and Z. Leblebici, An Electrochemical Sensor Based on Green Tea Extract for Detection of Cd(II) Ions by Differential Pulse Anodic Stripping Voltammetry, Surf. Interfaces, 2020, 21, 100726, DOI:10.1016/j.surfin.2020.100726.
- H. Pu, S. Ruan, M. Yin, Q. Sun, Y. Zhang, P. Gao, X. Liang, W. Yin and H. Fa, Performance Comparison of Simultaneous Detection Heavy-Metal Ions Based on Carbon Materials Electrochemical Sensor, Microchem. J., 2022, 181, 107711, DOI:10.2139/SSRN.4008859.
- Y. Yi, Y. Zhao, Z. Zhang, Y. Wu and G. Zhu, Recent Developments in Electrochemical Detection of Cadmium, Trends Environ. Anal. Chem., 2022, 33, e00152, DOI:10.1016/J.TEAC.2021.E00152.
- B. Tao, J. Li, P. Tian, H. Wu, F. Miao, Y. Zang and P. K. Chu, Au/ZnS/ZnO Photoelectrochemical Sensor for Sensitive and Selective Cd2+ Detection, J. Electrochem. Soc., 2022, 169(4), 047512, DOI:10.1149/1945-7111/AC6395.
- S. Ayilliath Kolaprath, M. K. Benny, L. Varghese and A. A. Facile, Green Synthesis of Carbon Quantum Dots from Polyalthia Longifolia and Its Application for the Selective Detection of Cadmium, Dyes Pigm., 2023, 210, 111048, DOI:10.1016/J.DYEPIG.2022.111048.
- J. G. Ayenimo and S. B. Adeloju, Rapid Amperometric Detection of Trace Metals by Inhibition of an Ultrathin Polypyrrole-Based Glucose Biosensor, Talanta, 2016, 148, 502–510, DOI:10.1016/J.TALANTA.2015.11.024.
- D. Ayodhya and G. Veerabhadram, Fabrication of Schiff Base Coordinated ZnS Nanoparticles for Enhanced Photocatalytic Degradation of Chlorpyrifos Pesticide and Detection of Heavy Metal Ions, J. Materiomics, 2019, 5(3), 446–454, DOI:10.1016/j.jmat.2019.02.002.
- H. N. Abdelhamid, D. Georgouvelas, U. Edlund and A. P. Mathew, CelloZIFPaper: Cellulose-ZIF Hybrid Paper for Heavy Metal Removal and Electrochemical Sensing, J. Chem. Eng., 2022, 446, 136614, DOI:10.1016/J.CEJ.2022.136614.
- C. S. Kushwaha and S. K. Shukla, Potentiometric Extractive Sensing of Lead Ions over a Nickel Oxide Intercalated Chitosan-Grafted-Polyaniline Composite, Dalton Trans., 2020, 49(39), 13862–13871, 10.1039/D0DT02687E.
- N. Blaise, H. Gomdje Valéry, R. Maallah, M. Oubaouz, B. Tigana Djonse Justin, E. Andrew Ofudje and A. Chtaini, Simultaneous Electrochemical Detection of Pb and Cd by Carbon Paste Electrodes Modified by Activated Clay, J. Anal. Methods Chem., 2022, 6900839, DOI:10.1155/2022/6900839.
- K. S. Sreehari, W. N. Namratha, N. Joseph and M. Balachandran, Toxic Heavy Metal Ion Detection by Fluorescent Nanocarbon Sensor Derived from a Medicinal Plant, Results Chem., 2023, 5, 100720, DOI:10.1016/J.RECHEM.2022.100720.
- D. Đukić-Ćosić, K. Baralić, D. Javorac, A. B. Djordjevic and Z. Bulat, An Overview of Molecular Mechanisms in Cadmium Toxicity, Toxicol., 2020, 19, 56–62, DOI:10.1016/j.cotox.2019.12.002.
- J. Chmielowska-Bąk, J. Gzyl, R. Rucińska-Sobkowiak, M. Arasimowicz-Jelonek and J. Deckert, The New Insights into Cadmium Sensing, Front. Plant Sci., 2014, 5, 245, DOI:10.3389/FPLS.2014.00245.
- T. Rasheed and K. Rizwan, Metal–Organic Frameworks Based Hybrid Nanocomposites as State-of–the-Art Analytical Tools for Electrochemical Sensing Applications, Biosens. Bioelectron., 2022, 199, 113867, DOI:10.1016/j.bios.2021.113867.
- H. İncebay and Z. Yazıcıgil, Effect of Different Copper Salts on the Electrochemical Determination of Cu(II) by the Application of the Graphene Oxide-Modified Glassy Carbon Electrode, Surf. Interfaces, 2017, 9, 160–166, DOI:10.1016/j.surfin.2017.09.004.
- Q. Wang, L. Li, Y. Tian, L. Kong, G. Cai, H. Zhang, J. Zhang, W. Zuo and B. Wen, Shapeable Amino-Functionalized Sodium Alginate Aerogel for High-Performance Adsorption of Cr(VI) and Cd(II): Experimental and Theoretical Investigations, J. Chem. Eng., 2022, 446, 137430, DOI:10.1016/J.CEJ.2022.137430.
- K. Zdiri, A. Cayla, A. Elamri, A. Erard and F. Salaun, Alginate-Based Bio-Composites and Their Potential Applications, J. Funct. Biomater., 2022, 13(3), 117, DOI:10.3390/JFB13030117.
- A. Chrouda, A Novel Electrochemical Sensor Based on Sodium Alginate-Decorated Single-Walled Carbon Nanotubes for the Direct Electrocatalysis of Heavy Metals Ions, Polym. Adv. Technol., 2023, 34(6), 1807–1816, DOI:10.1002/PAT.6002.
- S. K. Shukla, C. S. Kushwaha, A. Shukla and G. C. Dubey, Integrated Approach for Efficient Humidity Sensing over Zinc Oxide and Polypyrole Composite, Mater. Sci. Eng., C, 2018, 90, 325–332, DOI:10.1016/J.MSEC.2018.04.054.
- R. Kostić, D. Raković, S. A. Stepanyan, I. E. Davidova and L. A. Gribov, Vibrational Spectroscopy of Polypyrrole, Theoretical Study, J. Chem. Phys., 1998, 102(8), 3104, DOI:10.1063/1.468620.
- S. Dolabella, A. Borzì, A. Dommann, A. Neels, S. Dolabella, A. Borzì, A. Dommann and A. Neels, Lattice Strain and Defects Analysis in Nanostructured Semiconductor Materials and Devices by High-Resolution X-Ray Diffraction: Theoretical and Practical Aspects, Small Methods, 2022, 6(2), 2100932, DOI:10.1002/SMTD.202100932.
- P. Singh, C. S. Kushwaha, S. K. Shukla and G. C. Dubey, Synthesis and Humidity Sensing Properties of NiO Intercalated Polyaniline Nanocomposite, Polym-Plast Tech. Mat., 2018, 58(2), 139–147, DOI:10.1080/03602559.2018.1466170.
- C. S. Kushwaha and S. K. Shukla, Electrochemical Sensing of Paracetamol Using Iron Oxide Encapsulated in Chitosan-Grafted-Polyaniline, ACS Appl. Polym. Mater., 2020, 2(6), 2252–2259, DOI:10.1021/acsapm.0c00239.
- S. Shukla, A. Tiwari, G. Parashar and A. M. Talanta, Exploring Fiber Optic Approach to Sense Humid Environment over Nano-Crystalline Zinc Oxide Film, Mater. Sci. Eng., C, 2018, 90, 325–332, DOI:10.1016/J.MSEC.2018.04.054.
- S. K. Shukla, C. S. Kushwaha, A. Shukla and G. C. Dubey, Integrated Approach for Efficient Humidity Sensing over Zinc Oxide and Polypyrole Composite, Mater. Sci. Eng., C, 2018, 90, 325–332, DOI:10.1016/J.MSEC.2018.04.054.
- G. Qi Zhang, L. Sheng Zha, M. Hua Zhou, J. Hong Ma and B. Run Liang, Preparation and Characterization of PH-and Temperature-Responsive Semi-Interpenetrating Polymer Network Hydrogels Based on Linear Sodium Alginate and Crosslinked Poly(N-Isopropylacrylamide), J. Appl. Polym. Sci., 2005, 97(5), 1931–1940, DOI:10.1002/app.21957.
- S. Verma, A. K. Sharma and S. K. Shukla, Self-Fuelled Nickel Oxide Encapsulated Sodium Alginate-Grafted-Polypyrrole for Potentiometric Sensing of Lead Ions, Mater. Sci. Eng., B, 2023, 293, 116469, DOI:10.1016/J.MSEB.2023.116469.
- C. S. Kushwaha, V. K. Singh and S. K. Shukla, Electrochemically Triggered Sensing and Recovery of Mercury over Sodium Alginate Grafted Polyaniline, NJC, 2021, 45(24), 10626–10635, 10.1039/D1NJ01103K.
- D. Rana, B. M. Mandal and S. N. Bhattacharyya, Analogue Calorimetric Studies of Blends of Poly(Vinyl Ester)s and Polyacrylates, Macromol., 1996, 29(5), 1579–1583, DOI:10.1021/MA950954N.
- D. Rana, K. Bag, S. N. Bhattacharyya and B. M. Mandal., Miscibility of Poly(Styrene-co-butyl Acrylate) with Poly(Ethyl Methacrylate): Existence of Both UCST and LCST, J. Polym. Sci., Polym. Phys. Ed., 2000, 38(3), 369–375, DOI:10.1002/(SICI)1099-0488(20000201)38:3.
- A. K. Sharma and Y. Sharma, P-Toluene Sulfonic Acid Doped Polyaniline Carbon Nanotube Com-Posites: Synthesis via Different Routes and Modified Properties, J. Electrochem. Sci. Eng., 2013, 3(2), 47–56, DOI:10.5599/JESE.2013.0029.
- R. P. Rastogi and P. S. Bassi, Mechanism of Eutectic Crystallization, J. Phys. Chem., 1964, 68(9), 2398–2406, DOI:10.1021/J100791A003.
- N. Murugan, P. Manoharan and G. B. Nando, Thermodynamic Compatibility, Crystallizability, Thermal, Mechanical Properties and Oil Resistance Characteristics of Nanostructure Poly (Ethylene-Comethyl Acrylate)/Poly(Acrylonitrile-Co-Butadiene) Blends, Open Chem., 2020, 15(1), 426–437, DOI:10.1515/CHEM-2017-0047/HTML.
- D. Rana, B. M. Mandal and S. N. Bhattacharyya, Analogue Calorimetry of Polymer Blends: Poly(Styrene-Co-Acrylonitrile) and Poly(Phenyl Acrylate) or Poly(Vinyl Benzoate), Polymer, 1996, 37(12), 2439–2443, DOI:10.1016/0032-3861(96)85356-0.
- L. Sharma and T. Kimura, FT-IR Investigation into the Miscible Interactions in New Materials for Optical Devices, Polym. Advan. Technol., 2003, 14(6), 392–399, DOI:10.1002/pat.347.
- D. Rana, B. M. Mandal and S. N. Bhattacharyya, Miscibility and Phase Diagrams of Poly (Phenyl Acrylate) and Poly (Styrene-Co-Acrylonitrile) Blends, Polymer, 1996, 37(12), 2439–2443, DOI:10.1016/0032-3861(96)85356-0.
- I. Kaushal, A. K. Sharma, P. Saharan, V. Kumar and S. Duhan, Facile Synthesis and Electrochemical Investigations of Tin-Doped MnO2/Carbon Nanotube Composites, Carbon Lett., 2019, 29(1), 69–79, DOI:10.1007/S42823-019-00009-Z.
- M. A. Chougule, S. G. Pawar, P. R. Godse, R. N. Mulik, S. Sen and V. B. Patil, Synthesis and Characterization of Polypyrrole (PPy) Thin Films, Soft Nanosci. Lett., 2011, 01, 6–10, DOI:10.4236/SNL.2011.11002.
- S. K. Shukla, S. R. Deshpande, S. K. Shukla and A. Tiwari, Fabrication of a Tunable Glucose Biosensor Based on Zinc Oxide/Chitosan-Graft-Poly(Vinyl Alcohol) Core-Shell Nanocomposite, Talanta, 2012, 99, 283–287, DOI:10.1016/J.TALANTA.2012.05.052.
- D. F. Katowah, M. A. Hussein, M. M. Alam, M. A. Gabal, T. R. Sobahi, A. M. Asiri, J. Uddin and M. M. Rahman, Selective Fabrication of an Electrochemical Sensor for Pb2+ Based on Poly(Pyrrole-Co-o-Toluidine)/CoFe2O4 Nanocomposites, ChemistrySelect, 2019, 4(35), 10609–10619, DOI:10.1002/slct.201902714.
- V. K. Singh, C. S. Kushwaha and S. K. Shukla, Potentiometric Detection of Copper Ion Using Chitin Grafted Polyaniline Electrode, Int. J. Biol. Macromol., 2020, 147, 250–257, DOI:10.1016/J.IJBIOMAC.2019.12.209.
- S. Papageorgiou and E. Kouvelos, Metal–Carboxylate Interactions in Metal–Alginate Complexes Studied with FTIR Spectroscopy, Carbohydr. Res., 2010, 354(4), 469–473, DOI:10.1016/j.carres.2009.12.010.
Footnote |
| † Electronic supplementary information (ESI) available. See DOI: https://doi.org/10.1039/d3ma00246b |
| This journal is © The Royal Society of Chemistry 2023 |

