 Open Access Article
Investigation of the crystal structure and electrochemical performance of Gd doped LaNb0.9Mo0.1O4.05†
Yidong
Han
and
Stephen
J. Skinner
 *
*
Department of Materials, Imperial College London, Exhibition Road, London, SW7 2AZ, UK. E-mail: S.skinner@imperial.ac.uk
First published on 25th July 2023
Abstract
Single phase La1−xGdxNb0.9Mo0.1O4.05 (x = 0, 0.20, 0.40, 0.50, 0.60, 0.80 and 1.00) has been synthesized by a solid state reaction route. The crystal structures of all samples were investigated by high temperature X-ray diffraction. Both LaNb0.9Mo0.1O4.05 and La0.8Gd0.2Nb0.9Mo0.1O4.05 were found to possess modulated crystal structures at room temperature. The electrochemical performance of all samples was investigated by electrochemical impedance spectroscopy. LaNb0.9Mo0.1O4.05 exhibited the highest total conductivity of 1.52 × 10⁻² S cm−1 at 900 °C in air; however, in the intermediate temperature range, the conductivity of La0.8Gd0.2Nb0.9Mo0.1O4.05 was higher than that of LaNb0.9Mo0.1O4.05. The reason for these phenomena could be related to the influence of the negative effects of the modulated structure on the electrochemical performance and both the Gd and Mo dopants on the stability of the sample, which was investigated using the Bond Valence Sum approach.
1. Introduction
Lanthanum ortho-niobate (LaNbO4)-based materials have been widely studied as an electrolyte material for solid oxide fuel cells due to their chemical stability under different atmospheres.1,2 These materials possess a monoclinic fergusonite-type structure at lower temperatures and a tetragonal scheelite-type structure at higher temperatures, with the phase transition temperature between these two structures at a temperature of around 500 °C. Decreasing atomic radii of rare earth cations3 were found to correlate with an increase in the phase transition temperature. However, the conductivity of LaNbO4 is around 10−4–10−5 S cm−1 at 1000 °C,4,5 which is not enticing for solid oxide fuel cell electrolytes. To improve the conductivity of LaNbO4, dopants are always used on either La or Nb sites to introduce extrinsic defects to form ionic charge carriers.6 For the La site, acceptor dopants are used to introduce oxygen vacancies, which could improve the proton conductivity under wet conditions.1,7 For instance, the proton conductivity of Ca doped LaNbO4 reached 10−3 S cm−1 at 800 °C in wet oxygen.1 Some other divalent elements, including Sr and Zn, have also been investigated.2,4,8 Sr doped LaNbO4 exhibited comparable conductivity with Ca doped LaNbO4.2,4 Previous reports of the Sr doped materials revealed that protons were the major charge carriers in the grain boundaries of acceptor doped LaNbO4.9,10 Other lanthanides, which possess variable valence states and similar ionic radii compared with La,11 are also used as dopants on the La site. 10 mol% Ce doped La0.995Ca0.05NbO4−δ exhibited a combination of n-type electronic conductivity and proton conductivity under a reducing atmosphere;12 whereas, 10 mol% Pr doped La0.995Ca0.05NbO4−δ exhibited a combination of p-type electronic conductivity and proton conductivity under an oxidising atmosphere.12 Sm dopants also improved the conductivity of LaNbO4;13 however, a negative effect of Sm dopants on the bulk conductivity was found in (La0.5Sm0.5)0.99Ca0.01NbO4−δ because of the reduction of the free volume for conduction.14 For LaNbO4-related materials, Cao et al., doped Gd on the La sites of LaNbO4 to improve the conductivity.13 The author claimed that Gd possessed a mixed valence state of Gd2+ and Gd3+ and the enhanced conductivity is due to the contribution of oxide ion conductivity and electronic conductivity.13 However, this analysis was based solely on the consideration of ionisation potentials linked to the discussion of ligand complexes, with no direct evidence for these formal ionic species presented.For the Nb site, there are two effects for the dopants: on the one hand, most dopants on the Nb site could change the transition temperature of this type of material;15 on the other hand, donor dopants, like Mo and W, are used to introduce oxygen interstitials, which could improve the oxide ion conductivity.16,17 It was reported by Li et al., that the conductivity of LaNbO4 was improved by 1.5 orders of magnitude by substituting 8 mol% W on the Nb site.16 Another structural effect caused by Mo and W is that a modulated structure is introduced in the materials.18–20 The modulated structure of W-substituted LaNbO4 is suggested to be 2D incommensurate.16,18 Ryo et al., also used W as the dopant on the Nb sites of GdNbO4; the results showed that the conductivity of GdNbO4 was improved by the substitution of W and there was no modulated structure found in this type of material.21,22 The absence of a modulated structure was also found in other W-doped lanthanide (Pr, Nd) ortho-niobates, where Pr and Nd both have smaller ionic radii compared with La.11,16 Therefore, the existence of the modulated structure could be related to the cell volumes.16 However, the indexing for the modulated structure introduced by Mo is unknown and the effect of the modulated structure on the electrochemical properties also needs to be determined.
In this work, in order to study the effects of the modulated structure of Mo-doped LaNbO4, La site substitution has been utilized. As mentioned above, modulated structures will disappear when a lanthanide with a smaller ionic radius is substituted on the La sites.16 However, most of the lanthanides such as Pr, Nd or Sm, all possess multi-valence states,11 which are not suitable for an electrolyte material because of the potential risk of introducing electronic conductivity. Therefore, Gd, which is considered to possess a fixed valence state of Gd3+, has been first introduced on the La site to adjust the properties of LaNb0.9Mo0.1O4.05. With a fixed valence state, the possibility of introducing electronic conductivity could be reduced and two possible structural effects of the Gd cation are expected: first, with Gd substitution, the transition temperature of LaNb0.9Mo0.1O4.05 will become higher; second, the modulated structure will be influenced as reported previously.16 As the electrochemical properties are always related to the structure of the material, the Gd substitution may also have an influence on the electrochemical performance. The influence of the substituting cations on the structural and electrochemical properties has been investigated in this work using a combination of high temperature X-ray diffraction and electrochemical impedance spectroscopy.
2. Experimental details
2.1. Sample preparation
Samples of Gd-substituted LaNb0.9Mo0.1O4.05 (La1−xGdxNb0.9Mo0.1O4.05 with x = 0, 0.20, 0.40, 0.50, 0.60, 0.80 and 1.00, denoted as LNM10, La8Gd2, La6Gd4, La5Gd5, La4Gd6, La2Gd8 and GNM10, respectively) were prepared by a solid-state reaction route. Note that all oxygen stoichiometries discussed are the nominal values (4.05) assuming La3+, Gd3+, Nb5+ and Mo6+ adopt their formal valence states. Powders of La2O3 (Aldrich, 99.999%), Gd2O3 (Alfa Aesar, 99.99%), Nb2O5 (Aldrich, 99.99%) and MoO3 (BDH, 99.5%) were first dried for 10 h to remove any adsorbed water and carbonates before any further synthesis steps. The drying temperatures for La2O3, Gd2O3, and Nb2O5 were 1000 °C and for MoO3 it was 500 °C. Stoichiometric amounts of the as-dried powders were weighed and then ground in an agate mortar by hand for at least 30 minutes. To achieve homogeneity of the powders, acetone was added during the grinding process. After the acetone was volatilized, the mixed powders were transferred into an alumina crucible and calcined at 1000 °C for 10 h in air at a heating and cooling rate of 5 °C min−1. 1.0 g of the as-calcined powders were then uniaxially pressed into pellets (Φ 13 mm) at a pressure of 5 tons for 5 minutes. The pellets were then sintered at 1400 °C for 10 h in air at a heating and cooling rate of 5 °C min−1. To avoid any possible volatilisation of Mo during the sintering process, the pellets were buried in the calcinated powder with the same chemical composition. Part of the as-sintered pellets were then ground again into powder for further characterization.2.2. Sample characterization
The crystal structures and the phase transitions of the sintered materials were investigated by high-temperature X-ray Diffraction (XRD, Empyrean, PANalytical) in compressed air with Cu Kα radiation (λ = 1.5406 Å). The 2θ range was from 10° to 90° with a step size of 0.034°. The lattice parameters were determined by Rietveld refinement using the GSAS-II software.23 The microstructures of the as-sintered pellets were investigated by scanning electron microscopy (SEM, Leo Gemini-1525, Zeiss) and the homogeneity of the LNM10 pellet was determined using the backscattered electron (BSE) detection mode of the SEM. The chemical compositions of all samples were analysed using Energy-dispersive X-ray spectroscopy (EDX, X-Max/Auriga, Oxford instrument/Zeiss). The selected area electron diffraction (SAED) patterns of the as-sintered LNM10 powders were obtained using transmission electron microscopy (TEM, STEM-2100Plus, JEOL).The oxidation states of different atoms and the stability of all samples were calculated using the Bond Valence Sum (BVS) theory.24 The bond valence (v) is defined by eqn (1):24
| v = exp[(r0 − r)/b] | (1) |
 | (2) |
 | (3) |
For electrochemical impedance spectroscopy (EIS) measurements, the as-sintered pellets were painted with gold paste on both sides. The pellets were then heated to 900 °C for 1 h to remove the organic residues and achieve a good connection between the gold layers and the surfaces. The impedance data were collected over a temperature range from 500 °C to 900 °C in compressed dry air using a Solartron 1260 frequency response analyser (FRA) system. The AC potential was set at 50 mV and the frequency range was from 1 MHz to 500 MHz. The impedance data were fitted using the ZView package (v4.0b, Scribner Associates).
3. Results and discussion
3.1. Structural and chemical study
All samples were confirmed to be single-phase powders with monoclinic fergusonite structures from the XRD patterns at room temperature (Fig. S1, ESI†). Rietveld refinement was conducted for all the samples measured at 25 °C and 900 °C (Fig. S2 and S3, ESI†). Tables S1 and S2 (ESI†) list the refined parameters. Fig. 1 shows the trend of unit cell lengths and lattice volume against the Gd fraction. The lattice parameters b, c and lattice volume V decreased as the Gd fraction on the La site increased, which was as expected, as the ionic radius of Gd (105 pm in 8 fold coordination) is smaller than that of La (116 pm in 8 fold coordination).26 However, the a lattice parameter exhibited something different, showing a slight increase for 20 mol% Gd substituted on the La site. With 40% mol Gd substitution on the La site, the lattice parameter peaked at a = 5.4489(4) Å before decreasing with increasing Gd fraction. At room temperature, the modulated structure only existed for the LNM10 and La8Gd2 compositions (shown in Fig. S1, ESI†), so it is suggested that the increased lattice parameter is associated with the existence of the modulated structure. The analysis is discussed below using the combination of selected area electron diffraction (SAED) patterns.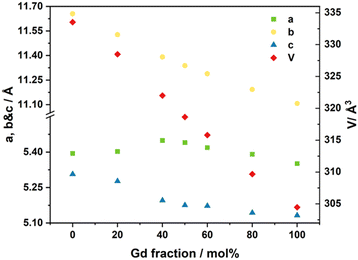 | ||
| Fig. 1 Lattice parameters a, b, c, and volume V of the La1−xGdxNb0.9Mo0.1O4.05 series obtained by Rietveld refinement against XRD data at 25 °C. Error bars are smaller than the symbols. | ||
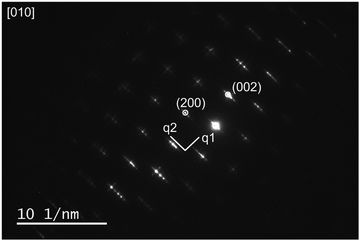
Fig. 2 shows the XRD data for the three different structures of LNM10 obtained at different temperatures. At room temperature, LNM10 was found to possess a monoclinic fergusonite structure with evidence in the pattern of a modulated superstructure, consistent with previous reports for the analogous W-substituted LaNbO4 system.16 The modulated structures originate from the modulated waves caused by the distortion of the Nb sites because of the presence of the Mo cations,18 resulting in displacements of the atoms from their original positions in the lattice, which has an influence on the symmetry of the original crystal.27 The symmetry is preserved in reciprocal space: the modulated structure appears as additional diffraction spots around the main spots in the diffraction patterns, as shown in previous work.16,19 This influence also appears in XRD patterns. The modulated structure of LNM10 was characterized by the satellite reflections marked in the XRD patterns; with increasing temperature to the intermediate temperature range (around 300 °C), the XRD patterns exhibited an obvious trend of transition from the low symmetry monoclinic fergusonite structure to the high symmetry tetragonal scheelite structure with the existence of the modulated superstructure. The tetragonal scheelite structure remained within the elevated temperature range; however, the modulated structure disappeared when the temperature was above 750 °C. Fig. S4 (ESI†) shows the XRD patterns recorded around the temperature at which the modulated structure of LNM10 disappeared. The modulated structure was also demonstrated by SAED patterns. Fig. 3 shows the SAED patterns of LNM10 along the [010] zone axis. The observed SAED patterns were similar to those reported for W-substituted LaNbO4 by Li et al.,16 where several satellite reflections were identified around the main reflections. As two different vectors were used to index the satellite reflections, it is suggested that the satellite reflections originate from a 2D incommensurately modulated structure.16,19 The modulated vectors are determined to be q1 = 0.159a* + 0.418c* and q2 = 0.452a* + 0.186c*, respectively. It is also noticed that the modulated structure was observed along the [010] axis, which means that the modulated waves propagated along the ac plane. Therefore, the atoms along the ac plane had been displaced, which could lead to an abnormal trend of the a lattice parameter observed in Fig. 1.
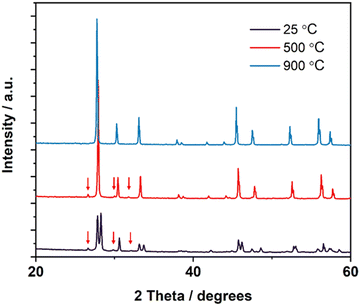 | ||
| Fig. 2 XRD patterns of LNM10 recorded at 25 °C, 500 °C and 900 °C, respectively. The satellite reflections of the modulated structure are marked by the arrows. | ||
Most of the materials synthesised exhibited similar phase transition behaviours as the LNM10 composition; however, GNM10 possessed a 2-phase structure in the intermediate temperature range. Fig. 4 shows the XRD patterns of GNM10 at different temperatures. The XRD pattern recorded at 500 °C shows that there were 3 pairs of satellite peaks next to the main peak positions at around 28.7°, 34.1° and 47.4° 2θ. As these satellite peaks only appeared around specific main peaks and always appeared in pairs in the intermediate temperature range (400–650 °C), the 2-phase structure could be regarded as a mixture of both monoclinic and tetragonal structure. The coexistence of two phases suggests that the phase transition in this type of material is a first-order transition, which agrees with the work previously reported by Auckett et al.17
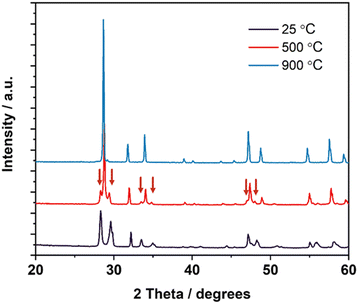 | ||
| Fig. 4 XRD patterns of GNM10 at 25 °C, 500 °C and 900 °C, respectively. The peaks from the monoclinic phase are marked by the arrows. | ||
Fig. 5 shows the derived phase diagram of all the materials investigated. The transition temperature from the monoclinic to the tetragonal phase increased with increasing Gd fraction on the La site. Fig. S5 to S11 (ESI†) show the XRD patterns of all the samples recorded through the monoclinic fergusonite structure to the tetragonal scheelite structure transition. It is noted that the modulated structure only existed with the lower Gd fraction samples (LNM10 and La8Gd2), and therefore that the modulated structure only exists in samples with large ionic radii of A site elements. This agrees with the findings of Li et al.,16 where a modulated structure was only observed in LaNb0.92W0.08O4.04, as for PrNb0.92W0.08O4.04 and NdNb0.92W0.08O4.04, there was no modulated structure detected.16
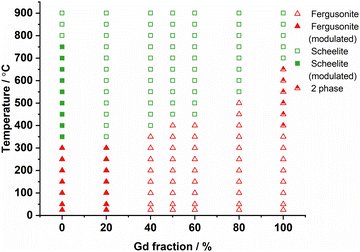 | ||
| Fig. 5 Phase diagram of La1−xGdxNb0.9Mo0.1O4.05 series. The separation between modulated and unmodulated structures is based on the satellite peaks observed from high-temperature XRD patterns. | ||
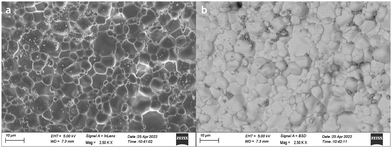
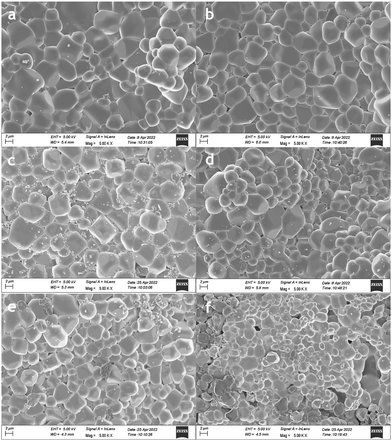
Fig. 6 and 7 show the microstructures of the surfaces of the as-sintered pellets of all samples (the microstructures of the cross sections are shown in Fig. S12 and S13, ESI†). All samples exhibited similar shapes of grains with high density. There were no obvious differences among most materials and only GNM10 showed a relatively smaller grain size than the others, with a lower overall density. The backscattered electron (BSE) image of LNM10, Fig. 6(b) indicates that the sample was single phase.
Table 1 shows the normalized atomic ratios of cations of the La1−xGdxNb0.9Mo0.1O4.05 series from EDX measurement. For each sample, 5 spectra were recorded at the cross section and the oxygen contents were excluded because of the potential contamination during the sample preparation. Most of the results agreed well with the expected stoichiometry, only GNM10 showed a slight A site deficiency. However, the ratios between Nb and Mo for all samples were around 9, showing that there was no significant loss of Mo content during the sintering process.
| La (%) | Gd (%) | Nb (%) | Mo (%) | |
|---|---|---|---|---|
| LNM10 | 50.1 ± 0.2 | — | 44.9 ± 0.2 | 5.0 ± 0.0 |
| Theoretical | 50.0 | — | 45.0 | 5.0 |
| La8Gd2 | 40.3 ± 0.7 | 9.9 ± 0.1 | 44.9 ± 0.5 | 4.9 ± 0.2 |
| Theoretical | 40.0 | 10.0 | 45.0 | 5.0 |
| La6Gd4 | 29.8 ± 0.6 | 19.6 ± 0.6 | 45.5 ± 0.8 | 5.1 ± 0.1 |
| Theoretical | 30.0 | 20.0 | 45.0 | 5.0 |
| La5Gd5 | 24.4 ± 0.3 | 24.5 ± 0.4 | 46.0 ± 0.2 | 5.1 ± 0.3 |
| Theoretical | 25.0 | 25.0 | 45.0 | 5.0 |
| La4Gd6 | 19.9 ± 0.1 | 30.1 ± 0.2 | 45.1 ± 0.1 | 4.9 ± 0.2 |
| Theoretical | 20.0 | 30.0 | 45.0 | 5.0 |
| La2Gd8 | 10.3 ± 0.4 | 40.3 ± 0.8 | 44.5 ± 0.6 | 4.9 ± 0.1 |
| Theoretical | 10.0 | 40.0 | 45.0 | 5.0 |
| GNM10 | — | 47.3 ± 0.7 | 47.4 ± 0.6 | 5.3 ± 0.1 |
| Theoretical | — | 50.0 | 45.0 | 5.0 |
3.2. Electrochemical study
The conductivities of all samples were determined using electrochemical impedance spectroscopy. Fig. 8 shows the impedance spectrum of LNM10 measured at 550 °C. Three different components (the bulk response, the grain boundary response, and the electrode response) could be distinguished by their characteristic capacitances.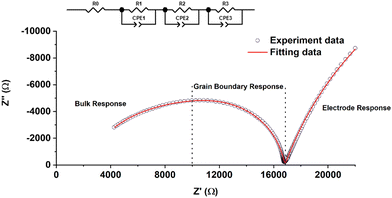 | ||
| Fig. 8 Impedance spectrum of LNM10 measured at 550 °C. The hollow circles show the measured value, and the red line shows the fitting results using the model in the inset. | ||
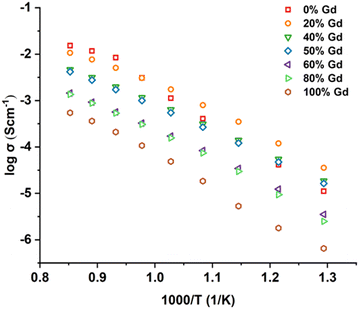
Fig. 9 shows the total conductivities of all samples measured from 500 °C to 900 °C in compressed dry air. With Mo substituted on the Nb site, the conductivity of LaNbO4 was obviously improved, which agreed with previous work.17,20 Most samples exhibited conductivities of the same order of magnitude and only GNM10 exhibited a relatively lower conductivity. This could be related to the smaller ionic radius of Gd, which was suggested by Li et al.16 As Gd possesses a small ionic radius, the lattice of GNM10 could be compressed, which cannot provide adequate space for the transportation of the oxide ions.
LNM10 exhibited the highest conductivity of 1.52 × 10⁻² S cm−1 at 900 °C in air, and this result is similar to the work reported by Cao et al., (2.65 × 10⁻² S cm−1 for LaNb0.8Mo0.2O4.1 measured at 900 °C in air) and Auckett et al. (around 7.0 × 10⁻³ S cm−1 for LaNb0.84Mo0.16O4.08 measured at 800 °C in air).17,20 The comparison between LNM10 and other materials is shown in Fig. 10. It is worth noting that both samples reported in the previous work had a higher Mo content than the samples in this work; however, the total conductivities of all samples are comparable,17,20 which contradicts the expected result, as higher Mo content should introduce more oxygen interstitials in the system, leading to higher conductivity. Similar results were also reported in the GdNb1−xWxO4+δ (0.0 ≤ x ≤ 0.7) series, as when W exceeded 0.4, a decreasing tendency in total conductivity was observed.21 Possible reasons are suggested below. First, there might be a solubility limit for Mo on the Nb site. The optimum Mo content on the Nb site could be between 10% and 20%. Therefore, the substitution level in previous work could be over this limit, which would negatively affect the conductivity. Also, the large amount of substitution at the Nb sites could form clusters, which could trap the oxygen interstitials.22 Another reason could be related to the different microstructure of the samples, although this cannot be confirmed as prior work did not include this information. The conductivity of LNM10 is also higher than the work reported by Li et al., (3.00 × 10⁻³ S cm−1 for LaNb0.92W0.08O4.04 measured at 800 °C in air) and Canu et al. (1.40 × 10⁻³ S cm−1 for LaNb0.84W0.16O4.08 measured at 800 °C in air).16,28 This agrees well with the work reported by Toyoura et al., as obvious trapping effects of W dopants on the oxygen interstitials reduced the total conductivity and Mo was suggested for the ideal dopants on Nb sites based on their simulation results.6
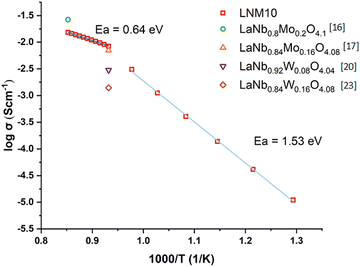 | ||
| Fig. 10 Arrhenius plot of the total conductivity of LNM10 showing the change in Ea. The results are also compared with other similar materials.16,17,20,28 | ||
Although LNM10 exhibited the highest conductivity at a high-temperature regime (800–900 °C), it did not dominate the whole temperature range. From 500 °C to 600 °C, La8Gd2, La6Gd4 and La5Gd5 all exhibited higher conductivities than LNM10. With increasing temperature, the conductivity of LNM10 surpassed La6Gd4 and La5Gd5, but was still lower than that of La8Gd2. Until 750 °C, the conductivity of LNM10 was equal to La8Gd2. It was also found that for LNM10, there was a change in the slope of the conductivity plot at 750 °C. The change in the slope could be related to the change in activation energy (Ea). However, between 800 °C and 900 °C, there were only 3 data points, which was not enough to conduct the linear fitting to calculate the Ea. Therefore, another precise EIS measurement between 800 °C and 900 °C with an interval of 10 °C was conducted for LNM10. Fig. 10 shows the Arrhenius plot of the total conductivity of LNM10. Combined with Fig. 5, the change in Ea from 1.53 eV to 0.64 eV could be related to the change in LNM10 from the modulated tetragonal phase to the unmodulated tetragonal phase. This dramatic change in Ea suggests that the modulated structure may have a negative effect on the electrochemical performance of this type of material. A possible reason could be related to the reduced symmetry of the samples. As mentioned above, the modulated structures could lead to the displacement of atoms from their original positions;27 therefore, the symmetry of the original crystal reduces. It could be suggested that a system with higher symmetry is more regular for oxygen ion conduction. However, further work is required to verify this.
Table 2 lists the activation energy (Ea) of all samples. There was no obvious change in Ea or the slope in the Arrhenius plot of conductivities for all other samples over the temperature range, as most samples transferred to the tetragonal phase below 500 °C. These Ea values are also consistent with the materials possessing predominantly ionic transport. However, from Fig. 5, it is suggested that the phase transition temperature of GNM10 is around 650 °C, this could lead to a slight change in the slope in the Arrhenius plot, as stated in previous works.1,16 The reason why there was no change could be related to the 2-phase region of GNM10, as the change from a mixture of monoclinic and tetragonal phases to a pure tetragonal phase should be smaller than the change from a pure monoclinic phase to a pure tetragonal phase.
| Transition temperature (°C) | E a (eV) | |
|---|---|---|
| LNM10 (UT) | 300 | 0.64(3) |
| LNM10 (MT) | 300 | 1.53(2) |
| La8Gd2 | 300 | 1.11(5) |
| La6Gd4 | 350 | 1.08(1) |
| La5Gd5 | 400 | 1.08(3) |
| La4Gd6 | 400 | 1.16(4) |
| La2Gd8 | 500 | 1.22(2) |
| GNM10 | 650 | 1.37(2) |
As mentioned above, a larger lattice structure could provide more adequate space for oxide ion mobility, which could lead to a higher conductivity; however, the total conductivities did not decrease with a slightly increasing Gd fraction. The elimination of the modulated structure by doping a small amount of Gd on the La site could be a reason; however, the changes in global structures should also be considered.
To further explain the novel trend of the total conductivities, a bond valence sum (BVS) calculation was conducted based on the refinement results of the XRD data collected at 750 °C (Table S3, ESI†), as at this temperature point, all samples possessed a tetragonal phase with only LNM10 possessing modulated structures. As the BVS results on La, Gd and Nb did not exhibit a similar trend of total conductivities (Fig. S14 and S15, ESI†), the BVS of the dopant element Mo was considered. Fig. 11a shows the BVS results of Mo. The mismatch here represents the difference between the calculated valence and the theoretical valence of each element. With 40 mol% Gd doped on the La site, the mismatch of the Mo element was the smallest, which represented the most reasonable structure. However, from the BVS results of Mo, the structures of La8Gd2, La6Gd4, La5Gd5 and La4Gd6 were more stable than LNM10, which was contrary to their total conductivities. Therefore, the G factor (global instability index) was introduced to combine the BVS results of both Gd and Mo. Fig. 11b shows the G factor results of all samples, and it was clear that the stability of LNM10 and La8Gd2 was at the same level, which matched really well with their conductivities. And the stabilities of La1−xGdxNb0.9Mo0.1O4.05 decreased with more Gd substituted on the La site. It is worth noting that as suggested by Brown et al., the value of the G factor should be lesser than 0.2 v.u.24 Although all the G factors calculated in this work were greater than 0.2 v.u., only the relative value and the trend were considered. The BVS results suggested that the Gd and Mo substitutions had significant influence on the total structure of these types of materials, which eventually had an influence on the total conductivities. As BVS calculation was an initial study of the bonding around atoms, further simulation work using density functional theory will be conducted in the future.
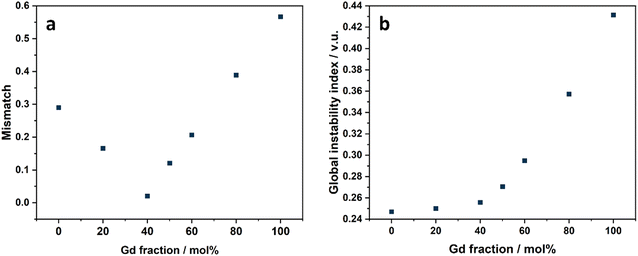 | ||
| Fig. 11 (a) BVS results of La1−xGdxNb0.9Mo0.1O4.05 series on Mo site; (b) BVS results of G factor of La1−xGdxNb0.9Mo0.1O4.05 series. | ||
4. Conclusion
Samples of La1−xGdxNb0.9Mo0.1O4.05 were successfully synthesized using a solid state reaction route. All samples adopted monoclinic fergusonite structures at room temperature and the transition temperature between the monoclinic fergusonite structure and the tetragonal scheelite structure of La1−xGdxNb0.9Mo0.1O4.05 gradually increased with increasing Gd fraction at the La site. A modulated structure exists for both LNM10 and La8Gd2 compositions. From the SAED patterns of LNM10, the modulated structure is suggested to be a 2D incommensurately modulated structure. However, the modulated structures in this type of materials could have negative effects on the electrochemical performance, as the Ea of unmodulated LNM10 (0.64 eV) is much lower than that of modulated LNM10 (1.53 eV). Also, by doping a small amount of Gd (20 mol%) on the La site, the total conductivity of LNM10 increases at an intermediate temperature range (500–700 °C). With more Gd substituted on the La site, the total conductivity decreased. The results of the BVS calculations suggest that the Mo substituent also had a significant influence on the local structure and stability. These results will be useful in the development of a new type of oxide ion conductor for operation in different temperature ranges.Conflicts of interest
There are no conflicts to declare.References
- R. Haugsrud and T. Norby, Nat. Mater., 2006, 5, 193 CrossRef CAS.
- R. Haugsrud and T. Norby, Solid State Ionics, 2006, 177, 1129 CrossRef CAS.
- S. W. Arulnesan, P. Kayser, J. A. Kimpton and B. J. Kennedy, J. Solid State Chem., 2019, 277, 229 CrossRef CAS.
- T. Mokkelbost, I. Kaus, R. Haugsrud, T. Norby, T. Grande and M.-A. Einarsrud, J. Am. Ceram. Soc., 2008, 91, 879 CrossRef CAS.
- M. Huse, T. Norby and R. Haugsrud, Int. J. Hydrogen Energy, 2012, 37, 8004 CrossRef CAS.
- K. Toyoura, Y. Sakakibara, T. Yokoi, A. Nakamura and K. Matsunaga, J. Mater. Chem. A, 2018, 6, 12004 RSC.
- Z. Bi, J. Peña-Martínez, J. H. Kim, C. A. Bridges, A. Huq, J. P. Hodges and M. P. Paranthaman, Int. J. Hydrogen Energy, 2012, 37, 12751 CrossRef CAS.
- Y. Cao, Y. Tan, D. Yan, B. Chi, J. Pu and L. Jian, Solid State Ionics, 2015, 278, 152 CrossRef CAS.
- D. Poulidi, G. C. Mather, C. N. Tabacaru, A. Thursfield and I. S. Metcalfe, Catal. Today, 2009, 146, 279 CrossRef CAS.
- H. Fjeld, D. M. Kepaptsoglou, R. Haugsrud and T. Norby, Solid State Ionics, 2010, 181, 104 CrossRef CAS.
- R. D. Shannon, Acta Crystallogr., Sect. A: Cryst. Phys., Diffr., Theor. Gen. Crystallogr., 1976, 32, 751 CrossRef.
- C. Solís and J. M. Serra, Solid State Ionics, 2011, 190, 38 CrossRef.
- Y. Cao, N. Duan, D. Yan, B. Chi, J. Pu and L. Jian, Int. J. Hydrogen Energy, 2016, 41, 20633 CrossRef CAS.
- L. Hakimova, A. Kasyanova, A. Farlenkov, J. Lyagaeva, D. Medvedev, A. Demin and P. Tsiakaras, Ceram. Int., 2019, 45, 209 CrossRef CAS.
- S. Wachowski, B. Kamecki, P. Winiarz, K. Dzierzgowski, A. Mielewczyk-Gryń and M. Gazda, Inorg. Chem. Front., 2018, 5, 2157 RSC.
- C. Li, R. D. Bayliss and S. J. Skinner, Solid State Ionics, 2014, 262, 530 CrossRef CAS.
- J. E. Auckett, L. Lopez-Odriozola, S. J. Clark and I. R. Evans, J. Mater. Chem. A, 2021, 9, 4091 RSC.
- C. Li, S. S. Pramana and S. J. Skinner, Dalton Trans., 2019, 48, 1633 RSC.
- C. Li, S. S. Pramana, R. D. Bayliss, C. P. Grey, F. Blanc and S. J. Skinner, Chem. Mater., 2020, 32, 2292 CrossRef CAS.
- Y. Cao, N. Duan, X. Wang, B. Chi, J. Pu and L. Jian, J. Eur. Ceram. Soc., 2015, 35, 1979 CrossRef CAS.
- R. Kawaguchi, R. Akizawa, Y. J. Shan, K. Tezuka and T. Katsumata, Solid State Ionics, 2020, 355, 115415 CrossRef CAS.
- Y. J. Shan, R. Kawaguchi, R. Akizawa and K. Tezuka, Ionics, 2023, 29, 2697 CrossRef CAS.
- B. H. Toby and R. B. Von Dreele, J. Appl. Crystallogr., 2013, 46, 544 CrossRef CAS.
- I. D. Brown, Chem. Rev., 2009, 109, 6858 CrossRef CAS PubMed.
- A. R. Denton and N. W. Ashcroft, Phys. Rev. A: At., Mol., Opt. Phys., 1991, 43, 3161 CrossRef CAS PubMed.
- R. D. Shannon and C. T. Prewitt, Acta Crystallogr., Sect. B: Struct. Crystallogr. Cryst. Chem., 1970, 26, 1046 CrossRef CAS.
- T. Janssen and A. Janner, Aperiodic crystals and superspace concepts, International Union of Crystallography, 2014, vol. 70, pp. 617–651 Search PubMed.
- G. Canu, V. Buscaglia, C. Ferrara, P. Mustarelli, S. Gonçalves Patrício, A. I. Batista Rondão, C. Tealdi and F. M. B. Marques, J. Alloys Compd., 2017, 697, 392 CrossRef CAS.
Footnote |
| † Electronic supplementary information (ESI) available. See DOI: https://doi.org/10.1039/d3ma00268c |
| This journal is © The Royal Society of Chemistry 2023 |

