 Open Access Article
Creative Commons Attribution 3.0 Unported Licence
Photoinduced polymer-confined CQDs for efficient photoluminescent 2D/3D printing applications
Jessica
Plé
a,
Corneliu S.
Stan
b,
Didier
Zanghi
a,
Cécile
Genevois
a,
Samar
Hajjar-Garreau
c and
Lavinia
Balan
 *a
*a
aUniversité d’Orléans, Conditions Extrêmes Matériaux Haute Température et Irradiation CNRS UPR 3079, F-45000, Orléans, France. E-mail: lavinia.balan@cnrs.fr
bUniversité Technique Gheorghe Asachi de Iaşi (TUIasi), Romania
cUniversité de Haute Alsace, Institut de Science des Matériaux de Mulhouse CNRS UMR 7361, F-68100, Mulhouse, France
First published on 18th September 2023
Abstract
CQD-loaded photopolymers were efficiently synthesized using commercially available materials in an easy one step process, combining the fast thermal decomposition of a carbon precursor with the direct integration into photopolymerizable acrylate formulations. Depending on the polymer matrix, the nanocomposites exhibited different optical properties as a result of their surface chemistry and dispersion state, while maintaining similar blue fluorescence in the 425–470 nm region. The CQD@triacrylate photoluminescent films showed the highest quantum yield (∼65%), most likely due to improved nanoparticle confinement inside the crosslinked network, compared to the diacrylate or co-polymer matrixes. The low viscosity of the monomer dispersions allowed them to be used as fluorescent inks for glass and textile coatings, 2D stenciling/stamping of various shapes or as photocurable resins for 3D printing in the near visible region. This provides promising future applications in optics, nanomedicine, sensing, anti-counterfeiting or textile functionalization.
1. Introduction
Ever since their discovery in 2004,1 carbon quantum dots (CQDs) have been actively investigated for their excellent stability,2 low toxicity,3,4 a highly reactive surface5 and tunable fluorescent properties.6,7 Top-down and bottom-up synthesis methods8,9 have been developed using a variety of carbon-based precursors,10 in order to maximize the large-scale, cost-effective production of highly luminescent QDs. Bottom-up approaches, such as pyrolysis,11 chemical oxidation12 or hydrothermal/solvothermal reactions,13,14 are usually preferred to top-down options, as they require relatively inexpensive equipment and raw materials, while allowing an easy industrial scale-up. Highly water-soluble, colloidal CQD solutions exhibit remarkable excitation-dependent fluorescence15 but the nanoparticles tend to self-aggregate in time, which ultimately leads to fluorescence quenching and limits their possible applications. CQD photoluminescence (PL) properties can nevertheless be maintained or even improved by dispersing the nanoparticles inside a solid matrix.16 As such, polymers are ideal candidates in terms of CQD chemical affinity, allowing excellent nanoparticle dispersion while preventing fluorescence quenching. Polymeric composite materials are synthesized via ex situ (blending,17 melt processing18) or in situ methods (chemical,19 reverse microemulsion,20 sol–gel21 polymerizations) followed by various deposition techniques (drop casting,22 electrospinning,23 spin24/dip25 coating, printing26).Among the latest applications of CQD/polymer composites, 2D or 3D printing of fluorescent materials has emerged as a promising tool for anti-counterfeiting labelling,27,28 bioimaging,29 energy harvesting30 and sensing31 technologies. Today, the most common 3D printing techniques used to print QD-loaded nanomaterials are fused filament fabrication,32 direct ink writing33 and photopolymerization-based methods.34,35 Photopolymerization is particularly attractive owing to fast reaction rates, temporal and spatial control depending on the chosen irradiation intensity and wavelength, room temperature conditions and the absence of toxic solvents. Zhou et al.34 mixed orange-emitting CQDs/sodium polyacrylate powders with a commercial photopolymer and used stereolithography as the 3D printing process. The subsequently printed Statue of Liberty was UV-cured at 365 nm for 2 h and showed bright orange fluorescence compared to the CQD-free one (λEx = 425 nm). More recently, Tomal et al.35 used a dual photosensitizing system containing S/N-doped CQDs and iodine salts for the cationic and radical photopolymerization of vinyl monomers and water-soluble acrylates, respectively. 3D resins and hydrogels printouts, between 0.5 and 2.5 mm thick, were then obtained via vat photopolymerization using a 405 nm laser printer, although no fluorescence measurements were carried out on the printed samples. In both previous examples, bottom-up in situ approaches (ultrasonic and magnetic hyperthermia) using citric acid as a carbon precursor were chosen to prepare the CQDs, which involved hour-long reaction times followed by several purification steps.34,35
Herein, a one-step synthesis involving a 15 minute-pyrolysis treatment of N-hydroxyphtalimide produced highly luminescent CQDs, which were then directly integrated intopre-cooled acrylate monomers (24 h at −8 °C). Once completely cooled, the formulation was stored (in the dark and at room temperature) for future use. The addition of a photoinitiator and subsequent UV-induced radical polymerization produced luminescent CQDs@polymer composites, which were then either used as photocurable inks (stamping, stencilling) for potential anti-counterfeiting applications or to print 3D objects.
2. Experimental section
2.1. Materials
Both triethylene glycol diacrylate (DA) (viscosity 10–20 mPa s) and trimethylolpropane triacrylate (TA) (viscosity 100 mPa s) monomers were purchased from Sartomer Company. Inc. N-Hydroxyphtalimide, 2-hydroxy-2-methyl-1-phenyl-propan-1-one and phenylbis(2,4,6-trimethylbenzoyl)phosphine oxide were purchased from Sigma Aldrich and used as received.2.2. Methods and characterization techniques
A 365 nm centered LLC UV-lamp from Heraeus Noblelight America equipped with an H bulb reflector was used to cure all CQDs@polymers at 400 mW cm−2 under air.CQD morphology and size were analysed using transmission electron microscopy (TEM) on an ACCELARM 200 kV cold FEG JEOL instrument.
Various spectrophotometers were used to investigate optical properties, including an Evolution E200 UV-Vis spectrophotometer from Thermo Fisher Scientific to measure absorption spectra; a Horiba Fluoromax 4P fluorimeter equipped with a Quanta-φ integration sphere for steady-state fluorescence, chromaticity and absolute quantum yield measurements and a 6600 JASCO spectrophotometer for Infrared Fourier Transform (FT-IR) analysis, additionally connected by a fiber-optic cable to a 365 nm-centered Hamamatsu Lightningcure LC8 (Hg–Xe L8252) UV-lamp (10 mW cm−2) to evaluate photopolymerization processes.
CQD-loaded formulations were exposed to a 366 nm-centred UV lamp in order to visually evaluate their fluorescence.
X-ray photoelectron spectroscopy (XPS) measurements were performed with a VG Scienta SES 200-2 spectrometer using a monochromatic Al Kα X-ray source. All spectra were measured at normal incidence corresponding to an 8 nm-depth of analysis. The high resolution and wide-scan spectra were recorded with pass energies of 100 eV and 500 eV, respectively. The spectra decomposition into different components was performed with Gaussian–Lorentzian shaped peaks using CasaXPS software after having subtracted a Shirley-type background.
A low force stereolithography printer was used to print 3D fluorescent nanocomposites, by replacing commercially available resins with the developed CQDs-photocurable formulation. Each 100 μm-thick layer was cured with a 405 nm laser delivering 4.5 × 10⁻⁴ mW cm−2.
An Olympus BX51 optical microscope equipped with Olympus ColorView digital camera was used to confirm the layer-by-layer 3D printing method.
3. Results and discussion
3.1. Synthesis and structural characterisations of CQDs@monomer and CQDs@polymer nanocomposites
Following the previously published CQD-synthesis technique by Stan et al.,36 0.3 g of magnetically stirred N-hydroxyphtalimide were initially melted in a three-neck Schlenk flask at 98 °C. The precursor then underwent pyrolysis by increasing the reaction temperature to 550 °C (10 °C min−1) under an inert nitrogen atmosphere for 15 minutes. At this time, 5 g of the previously cooled (24 h, −8 °C) selected monomer solutions, namely DA, TA or DA/TA (50![[thin space (1/6-em)]](https://www.rsc.org/images/entities/char_2009.gif) :
:![[thin space (1/6-em)]](https://www.rsc.org/images/entities/char_2009.gif) 50) co-monomers, were added to the hot flask. The subsequently room-temperature-cooled CQDs@monomer dispersions were obtained and exhibited bright blue photoluminescence when excited at 366 nm (Fig. 1).
50) co-monomers, were added to the hot flask. The subsequently room-temperature-cooled CQDs@monomer dispersions were obtained and exhibited bright blue photoluminescence when excited at 366 nm (Fig. 1).
CQDs@polymer nanocomposites were then obtained using 2-hydroxy-2-methyl-1-phenyl-propan-1-one as a photoinitiator (0.5 wt%) and by depositing a few drops of each monomer/co-monomer solution (with and without CQDs) on unadhesive aluminium substrates, and exposing the samples to a 366 nm UV lamp, delivering a 400 mW cm−2 fluence, for 10 s under air. The same bright blue PL was observed for polymer composites excited at 366 nm (Fig. 1).
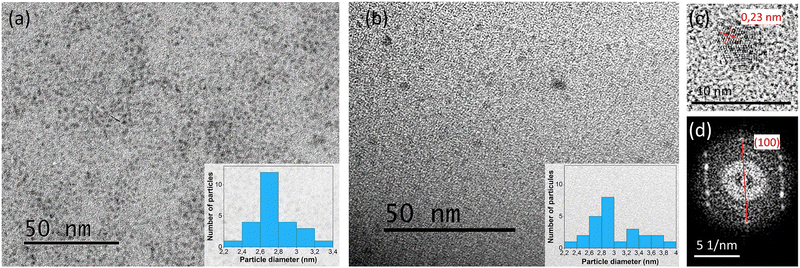
TEM images show the homogeneous distribution of spherical nanoparticles inside the DA physical matrix (Fig. 2(a) and (b)). The CQD size dispersion slightly increased after the photopolymerization process, with average sizes ranging from 2.2 to 2.4 nm and 2.2 to 4 nm for the monomer dispersions and confined photopolymer networks, respectively (Fig. 2 insets). This phenomenon may likely have occurred post-curing, as the polymer chains relax somewhat, or during TEM sample preparation, where the crushed polymers were redispersed in ethanol to decrease the thickness of the film deposited on the copper grid. Clear lattice fringes can be observed in Fig. 2(c), showing interplanar spacings of 0.23 nm, typically corresponding to the (100) plane of graphitic carbon.37 The existence of this particular plane was confirmed by the electron diffraction pattern in Fig. 2(d), indicating the crystalline nature of the CQDs.
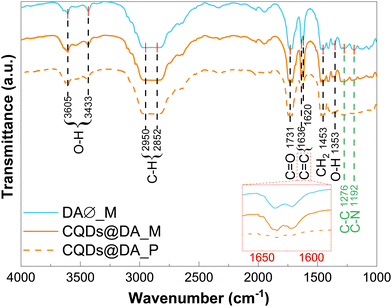
The chemical composition of the DA monomer dispersion and polymer matrix, both with and without CQDs, was investigated by FT-IR analysis. Although nearly identical in terms of absorption band positions (Fig. 3), the polymer spectra showed significantly reduced C![[double bond, length as m-dash]](https://www.rsc.org/images/entities/char_e001.gif) C absorption bands at 1620 and 1635 cm−1, as evidence of the crosslinking process. In a previous paper, Stan et al.36 reported the FT-IR spectrum of the pyrolysis-obtained CQDs dispersed in chloroform. By comparing it with the experimental data in Fig. 3, few absorbance bands can definitively be attributed to the CQDs, with the possible exception of the 1192 and 1276 cm−1 bands, which could be linked to C–N and C–C stretching modes. The structural rearrangement of monomer-stabilized CQDs could explain the observed shift in wavenumbers compared to chloroform-dispersed ones.36 Chemical bonds specific to CQDs were most likely lost amid those of the polymer matrix. Based on the well documented polyethylene glycol diacrylate FT-IR spectrum,38–40 the absorption bands at 1353, 1453 and 1731 cm−1 were assigned to the C–O asymmetric bending, CH2 symmetric bending and C
C absorption bands at 1620 and 1635 cm−1, as evidence of the crosslinking process. In a previous paper, Stan et al.36 reported the FT-IR spectrum of the pyrolysis-obtained CQDs dispersed in chloroform. By comparing it with the experimental data in Fig. 3, few absorbance bands can definitively be attributed to the CQDs, with the possible exception of the 1192 and 1276 cm−1 bands, which could be linked to C–N and C–C stretching modes. The structural rearrangement of monomer-stabilized CQDs could explain the observed shift in wavenumbers compared to chloroform-dispersed ones.36 Chemical bonds specific to CQDs were most likely lost amid those of the polymer matrix. Based on the well documented polyethylene glycol diacrylate FT-IR spectrum,38–40 the absorption bands at 1353, 1453 and 1731 cm−1 were assigned to the C–O asymmetric bending, CH2 symmetric bending and C![[double bond, length as m-dash]](https://www.rsc.org/images/entities/char_e001.gif) O stretching modes, respectively, of the DA matrix. The broad bands in the 2850–2950 and 3400–3600 cm−1 regions were attributed to C–H and OH stretching vibrations, respectively.
O stretching modes, respectively, of the DA matrix. The broad bands in the 2850–2950 and 3400–3600 cm−1 regions were attributed to C–H and OH stretching vibrations, respectively.
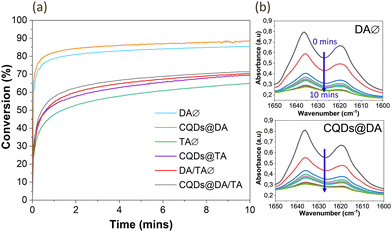
CQD influence on the crosslinking process was then determined by plotting the photopolymerization profiles of monomers, with and without nanoparticles (Fig. 4(a)). Conversion degrees were calculated by measuring the 1635 cm−1 double band area as a function of irradiation time, in oxygen-free conditions (Fig. 4(b)). For all three photosensitive formulations, the final conversion degree is slightly higher for CQD-containing systems, reaching 87%, 69% and 71% for DA, TA and DA/TA respectively. The DA/TA conversion profile is intuitively situated between the DA and TA ones.
Tomal et al.35 observed a similar trend when mixing CQDs (0.2 wt%) and iodonium salts (2.0 wt%) with the TA monomer and subsequently exposing the solution to a 365 nm UV lamp for 800 s, also under oxygen-free conditions. The CQDs efficiently co-initiated the photopolymerization reaction, alongside the iodonium salts. Indeed, CQDs have been investigated as co-initiators to various photosensitizing systems in light-induced free radical polymerizations such as reversible addition fragmentation chain transfer.41–43 In addition, as the TA monomer contains three functional groups, a densely crosslinked network is created at the onset of UV exposure, which reduces the mobility and diffusion of the remaining monomers and accounts for the lower conversion degree compared to the DA system.44
XPS surface analysis of the CQDs@DA monomer dispersion and polymer (Fig. 5) revealed the presence of two main elements, namely carbon and oxygen. The small silicium peaks correspond to the glass substrate. The carbon and oxygen peaks can be further deconvoluted into several components, representing the different chemical bonds. The increasing percentage of C–C bonds from 29% to 45% proves the formation of a crosslinked polymer network. The initial 29% of C–C bonds is probably the result of the monomer's thermal polymerization upon addition to the still-hot CQDs, post-pyrolysis. The additional 45% of C–C bonds, created during the photopolymerization process, enables the overall conversion degree to reach 74%, which is close to that of the FT-IR-measured one (87%). As FT-IR conversion measurements were recorded during a 10 minute UV irradiation at 10 mW cm−2, while those characterized by XPS and shown in Fig. 1 were cured in 10 s at a higher UV-intensity (400 mW cm−2), the XPS-analysed samples probably still contained some monomer fragments, trapped inside the crosslinked network.
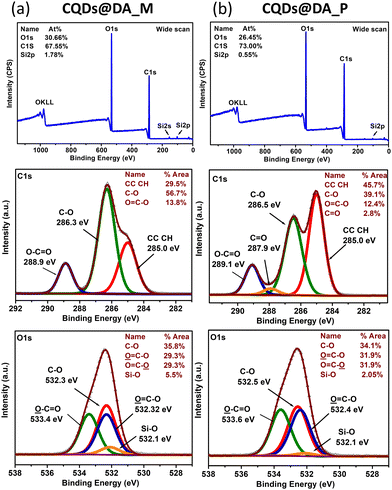 | ||
| Fig. 5 Wide scan and C1s, O1s, Si2p core-level XPS spectra of (a) CQDs@DA monomer and (b) CQDs@DA polymer nanocomposite. | ||
3.2. Optical properties
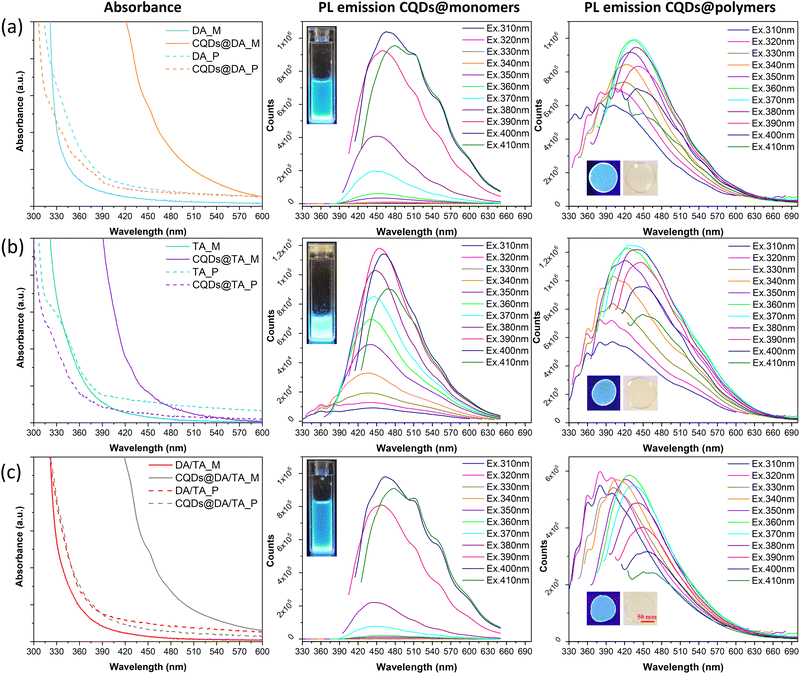
The optical properties of CQD@monomer dispersions and polymers were first characterized in terms of absorption, steady-state photoluminescence (Fig. 6) and photoluminescent quantum yields (PLQY, Tables 1 and 2). The emission spectra were recorded by exciting the samples from 310 to 410 nm, with 10 nm increments as the absorption spectra showed subtle variations in that range (Fig. 6).| Sample (λEx = 400 nm) | CQDs@DA | CQDs@TA | CQDs@DA/TA |
|---|---|---|---|
| Abs. PLQY (%) | 27.81 | 13.88 | 4.0 |
| Abs. PLQY (%) | ||||||
|---|---|---|---|---|---|---|
| Excitation (nm) | 350 | 360 | 370 | 380 | 390 | 400 |
| CQDs@DA | 5.29 | 6.53 | 8.55 | 10.25 | 14.31 | 14.99 |
| CQDs@TA | 5.47 | 7.47 | 11.72 | 16.35 | 36.98 | 64.57 |
| CQDs@DA/TA | 4.19 | 5.73 | 6.97 | 8.87 | 13.03 | 14.58 |
CQDs typically show strong absorption from 200 to 400 nm, where the observed absorption bands are attributed to π–π* or n–π* transitions of the C![[double bond, length as m-dash]](https://www.rsc.org/images/entities/char_e001.gif) C and C
C and C![[double bond, length as m-dash]](https://www.rsc.org/images/entities/char_e001.gif) O bonds, respectively.45 The oxygen-rich monomers allow the easy creation of C
O bonds, respectively.45 The oxygen-rich monomers allow the easy creation of C![[double bond, length as m-dash]](https://www.rsc.org/images/entities/char_e001.gif) O bonds before and after the photopolymerization process, which explains the observed absorption bands around 450 nm and 330–380 nm of the CQDs@monomer dispersions and CQDs@polymers, respectively, as a result of n–π* transitions. The emission peaks were both excitation and matrix-dependent, where the monomer dispersions required a higher excitation wavelength (390–400 nm) than the polymerized samples (360–370 nm) in order to reach the highest emission intensities. As with the conversion profiles in Fig. 4(a), the highest emission peak of the co-monomer/polymer formulations (Fig. 6(c)) was intuitively situated between those of the DA (Fig. 6(a)) and TA (Fig. 6(b)) matrixes (427 nm against 466 and 427–441 nm, respectively). In addition, CQDs confined in the polymer matrixes exhibited much larger Stokes shifts compared to the monomer dispersions, which is mostly in agreement with the PLQY investigation. Indeed, in the case of the TA and copolymer matrixes, the PLQY increased from 13.88 to 64.57% and 4.0 to 14.58%, respectively. The polymerization process thus limited non-radiative recombination pathways, due to possible self-absorption and inner filter effects existing in the monomer dispersions. The opposite phenomenon was observed for the DA matrix, where the PLQY went from 27.81 to 14.99% post-polymerization, which could be linked to the slight aggregation phenomenon observed in the TEM image (Fig. 2(b)).
O bonds before and after the photopolymerization process, which explains the observed absorption bands around 450 nm and 330–380 nm of the CQDs@monomer dispersions and CQDs@polymers, respectively, as a result of n–π* transitions. The emission peaks were both excitation and matrix-dependent, where the monomer dispersions required a higher excitation wavelength (390–400 nm) than the polymerized samples (360–370 nm) in order to reach the highest emission intensities. As with the conversion profiles in Fig. 4(a), the highest emission peak of the co-monomer/polymer formulations (Fig. 6(c)) was intuitively situated between those of the DA (Fig. 6(a)) and TA (Fig. 6(b)) matrixes (427 nm against 466 and 427–441 nm, respectively). In addition, CQDs confined in the polymer matrixes exhibited much larger Stokes shifts compared to the monomer dispersions, which is mostly in agreement with the PLQY investigation. Indeed, in the case of the TA and copolymer matrixes, the PLQY increased from 13.88 to 64.57% and 4.0 to 14.58%, respectively. The polymerization process thus limited non-radiative recombination pathways, due to possible self-absorption and inner filter effects existing in the monomer dispersions. The opposite phenomenon was observed for the DA matrix, where the PLQY went from 27.81 to 14.99% post-polymerization, which could be linked to the slight aggregation phenomenon observed in the TEM image (Fig. 2(b)).
The previously solvent-dispersed CQDs synthesized by Stan et al.35 showed PLQYs ranging from 3 to 70% when excited at 400 nm, the highest PLQYs being recorded for CQDs dispersed in polar aprotic solvents. As the chosen monomers are also polar and aprotic, the significant PLQY difference observed between the monomer dispersions could instead be the result of steric hindrance. Indeed, the co-monomer formulation contains relatively long DA monomers and large TA ones, which could become entangled and ineffectively passivate the CQD surface. Contrarily, the DA monomer can wrap around the nanoparticles more easily than both its TA and co-monomer counterparts. The PLQY order is as follows: DA > TA > DA/TA, which is in agreement with the associated steric effect of each monomer. Enhanced particle stabilization was then achieved in the case of the TA polymer matrix as a result of its high functionality. Indeed the three functional groups create a densely crosslinked network upon photopolymerization, which successfully stabilizes the CQD surface and limits their possible aggregation. On the other hand, both the DA and DA/TA polymer networks afford more CQD mobility, resulting in more particle interaction and thus lower PLQY values.
All emission spectra exhibited multiple shoulders after 500 nm for CQDs@monomer dispersions excited between 370 and 410 nm, and in the 330 to 400 nm range for the polymer-confined CQDs excited between 310 and 340 nm. It is well known that CQD fluorescence is strongly dependent on their surface chemistry, where hybridized carbons and functional groups acts as exciton capture centers, leading to the creation of intragap energy levels. XPS analysis performed by Stan et al.36 on the freeze-dried CQDs revealed the presence of various chemical bonds post-pyrolysis, mainly C![[double bond, length as m-dash]](https://www.rsc.org/images/entities/char_e001.gif) C, C–C/C–H, C–N, C
C, C–C/C–H, C–N, C![[double bond, length as m-dash]](https://www.rsc.org/images/entities/char_e001.gif) O and OH–N. It can be assumed that similar surface chemistry was present herein, before the addition of the monomer solutions. Consequently, the acrylate monomers can interact with the CQD surface via hydrogen and van der Waals bonds.
O and OH–N. It can be assumed that similar surface chemistry was present herein, before the addition of the monomer solutions. Consequently, the acrylate monomers can interact with the CQD surface via hydrogen and van der Waals bonds.
In addition, as the viscosity of the TA monomer was higher than that of the DA one, CQDs are possibly better stabilized and undergo less surface chemistry changes, which could explain the fewer shoulders present in the PL emission spectra. Similarly, once the photopolymerization process ends, CQD-confinement inside the crosslinked networked also prevents surface chemistry variations. The shoulder multiplicity in the 330 to 450 nm region may be linked to the n–π* transitions of the abundant C![[double bond, length as m-dash]](https://www.rsc.org/images/entities/char_e001.gif) O groups, as suggested by Hu et al.46 Indeed, they postulated the creation of new energy levels between bandgaps, caused by an increase in the oxygen content at the CQD surface.
O groups, as suggested by Hu et al.46 Indeed, they postulated the creation of new energy levels between bandgaps, caused by an increase in the oxygen content at the CQD surface.
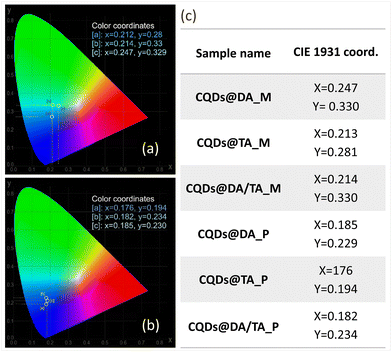
In terms of chromaticity, CIE 1931 coordinates were recorded at maximum PLQY (Fig. 7) and the chromatic parameters were nearly identical for the CQDs@polymers due to the closely situated emission peaks (440 nm CQDs@DA, 451 nm for CQDs@TA and 458 for CQDs@DA/TA).
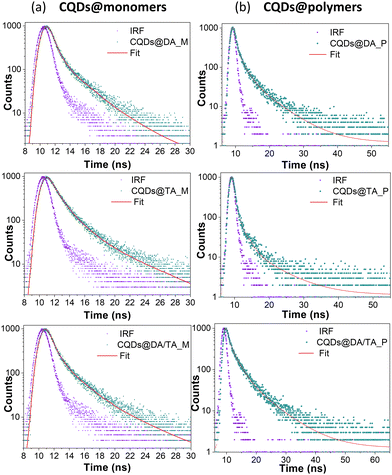
The time-resolved PL traces of CQDs@monomer dispersions and CQDs@polymer nanocomposites (Fig. 8) were fitted with tri-exponential functions, having three distinct lifetime component under 10 ns. This suggests the existence of three emissive processes, namely radiative relaxations within the CQD core or arising from surface traps sites caused by the presence of functional groups and possible defects.
The average lifetimes, calculated using:
| Sample (λEm = 450 nm) | τ 1 (ns) | a 1 (%) | τ 2 (ns) | a 2 (%) | τ 3 (ns) | a 3 (%) | τ avg (ns) | χ 2 |
|---|---|---|---|---|---|---|---|---|
| CQDs@DA_M | 1.02 | 21.26 | 0.28 | 55.81 | 3.60 | 22.93 | 2.69 | 1.12 |
| CQDs@TA_M | 1.33 | 28.29 | 0.22 | 51.58 | 5.20 | 20.12 | 3.89 | 1.15 |
| CQDs@DA/TA_M | 1.36 | 29.71 | 0.24 | 51.21 | 4.80 | 19.08 | 3.44 | 1.15 |
| CQDs@DA_P | 1.71 | 17.43 | 6.51 | 13.62 | 0.04 | 68.95 | 5.17 | 1.09 |
| CQDs@TA_P | 1.75 | 13.79 | 7.46 | 7.35 | 0.10 | 78.85 | 5.18 | 0.97 |
| CQDs@DA/TA_P | 2.39 | 40.17 | 7.49 | 25.01 | 0.30 | 34.81 | 5.56 | 0.96 |
The overall PL results are in accordance with those published by Stan et al.36 and more generally in the literature, with the added benefit of a one-pot, fast and easy to implement synthesis technique for both CQD synthesis and polymerization process. Kalytchuk et al.27 added hydrothermally-obtained (5 h, 200 °C) citric acid-based CQDs to a poly(vinyl alcohol) matrix in order to produce fluorescent inks for anti-counterfeiting application. The printed and dried inks emitted in the 350–550 region (λex = 365 nm), with fluorescence lifetimes between 4 and 6 ns. Bai et al.47 produced a CQD-containing thermoplastic polyurethane elastomer (0.5 wt%) for silver ion detection, showing a broad 470 nm-centered emission when excited at 400 nm, with a 68% PLQY and an average lifetime around 9 ns. The CQDs were also synthesized via the hydrothermal method (3 h, 170 °C) and the composites required a 24 h-long UV curing period.
3.3. Proof of concept applications
Fig. 9 shows proof of concept applications of photocurable CQDs@monomer/co-monomer dispersions such as textile functionalisation (Fig. 9(a)), potential anti-counterfeiting florescent ink applications: stamping and stenciling (Fig. 9(b)), as well as 3D-printed fluorescent objects (Fig. 9(c)) via the stereolithography printing technique, all easily transferable to an industrial scale. The direct addition of the monomers to the pyrolysis-obtained CQDs limits nanoparticle aggregation, while preventing the user from handling volatile nanopowders.Concerning the 3D printed objects, the successive 100 μm-thick photopolymerized layers can clearly be observed in Fig. 9(c). In order to ensure complete and fast photopolymerization in the UV and near visible regions, phenylbis(2,4,6-trimethylbenzoyl)phosphine oxide (2 wt%) was used to initiate the printing process. However, as the natural yellow tint of this particular photoinitiator competes with the blue CQD fluorescence when excited at 366 nm, further tests need to be carried out in order to choose the optimal photoinitiating system and associated amount.
As demonstrated above, CQD-based composites can be synthesized using a variety of photopolymers, and the choice of matrix will depend on the final application. In the case of the polyester textile functionalization (Fig. 9(a)), the CQDs@DA, TA or DA/TA coating provided full substrate coverage, while rigidifying the initially flexible textile. In addition, photopolymer viscosity will have a significant impact on the printed details of 2D and 3D objects.
4. Conclusion
The one-step combination of pyrolysis-obtained CQDs with photocurable acrylate monomers led to the successful synthesis of blue emitting-nanocomposites, having a wide range of possible 2D or 3D applications. The overall process, including CQD formation and confinement inside a polymer matrix, involves short reaction times, commercially available starter materials and atmospheric conditions, all of which are attractive at an industrial level. As the monomers are directly added to the still-hot CQDs, the polymer matrix can be chosen as a function of the desired final properties, provided that no phase segregation occurs during the addition. In addition, this direct integration limits CQD aggregation, since the three developed formulations showed efficiently dispersed and crystalline CQDs, with differing properties in terms of monomer conversion and optical characteristics, depending on the chemical environment of the confined nanoparticles. Typically, a higher conversion degree was reached with the DA monomer but its lower crosslinking degree could explain the lower PLQY (∼15%) of the cured composite, compared to the TA matrix (∼65%). All formulations exhibited bright blue fluorescence, with highest emission peaks in the 425–470 nm region, both excitation and matrix-dependent. In addition, typical lifetimes under 10 ns were recorded for both monomer dispersions and polymers. Among the possible applications, the composites were used for textile functionalization, as fluorescent inks for stamping or stenciling and as curable resins to print 3D objects.Author contributions
Conceptualization, LB; methodology and validation, JP, CSS and LB; investigation, JP, CSS, LB, DZ, CG and SHG; writing – original draft preparation, JP and LB; project administration and funding acquisition LB. All authors have read and agreed with the final manuscript.Conflicts of interest
There are no conflicts to declare.Acknowledgements
This project has benefited from the expertise and the facilities of the Platform MACLE-CVL, which was co-funded by the European Union and Centre-Val de Loire Region (FEDER). The authors JP and LB express their thanks to the Agence Nationale de la Recherche (ANR) for their financial support under contract ANR-21-CE06-0046-04 (LumiTex project).References
- X. Xu, R. Ray, Y. Gu, H. J. Ploehn, L. Gearheart, K. Raker and W. A. Scrivens, J. Am. Chem. Soc., 2004, 126, 12736–12737 CrossRef CAS PubMed.
- Y. Liu, L. Zhou, Y. Li, R. Deng and H. Zhang, Nanoscale, 2017, 9, 491–496 RSC.
- S.-T. Yang, X. Wang, H. Wang, F. Lu, P. G. Luo, L. Cao, M. J. Meziani, J.-H. Liu, Y. Liu, M. Chen, Y. Huang and Y.-P. Sun, J. Phys. Chem. C, 2009, 18110–18114 CrossRef CAS PubMed.
- C.-Y. Chung, Y.-J. Chen, C.-H. Kang, H.-Y. Lin, C.-C. Huang, P.-H. Hsu and H.-J. Lin, Polymers, 2021, 13, 1598 CrossRef CAS PubMed.
- F. Yan, Y. Jiang, X. Sun, Z. Bai, Y. Zhang and X. Zhou, Microchim. Acta, 2018, 185, 424 CrossRef PubMed.
- H. Nie, M. Li, Q. Li, S. Liang, Y. Tan, L. Sheng, W. Shi and S. X.-A. Zhang, Chem. Mater., 2014, 26, 3104–3112 CrossRef CAS.
- F. Yan, Y. Jiang, X. Sun, J. Wei, L. Chen and Y. Zhang, Nano Res., 2020, 13, 52–60 CrossRef CAS.
- A. Khayal, V. Dawane, M. A. Amin, V. Tirth, V. K. Yadav, A. Algahtani, S. H. Khan, S. Islam, K. K. Yadav and B.-H. Jeon, Polymers, 2021, 13, 3190 CrossRef CAS PubMed.
- N. Azam, M. Najabat Ali and T. Javaid Khan, Front. Mater., 2021, 8, 700403 CrossRef.
- Z. Wei, W. Lu, X. Wang, J. Ni, U. H. Prova, C. Wang and G. Huang, J. Mater. Chem. C, 2022, 10, 1932–1967 RSC.
- H. Luo, L. Lari, H. Kim, S. Hérou, L. C. Tanase, V. K. Lazarov and M.-M. Titirici, Nanoscale, 2022, 14, 910–918 RSC.
- X. Feng and Y. Zhang, RSC Adv., 2019, 9, 33789–33793 RSC.
- Y. Wang, X. Chang, N. Jing and Y. Zhang, Anal. Methods, 2018, 10, 2775–2784 RSC.
- P. Zhao, X. Li, G. Baryshnikov, B. Wu, H. Ågren, J. Zhang and L. Zhu, Chem. Sci., 2018, 9, 1323–1329 RSC.
- A. B. Siddique, S. M. Hossain, A. K. Pramanick and M. Ray, Nanoscale, 2021, 13, 16662–16671 RSC.
- J. Wang, Y. Yang and X. Liu, Mater. Adv., 2020, 1, 3122–3142 RSC.
- M. Abdullah Issa and Z. Z. Abidin, Molecules, 2020, 25, 3541 CrossRef PubMed.
- N. B. Erdal and M. Hakkarainen, Biomacromolecules, 2018, 19, 1074–1081 CrossRef CAS PubMed.
- B. Devadas and T. Imae, ACS Sustainable Chem. Eng., 2018, 6, 127–134 CrossRef CAS.
- M. Wang, M. Gao, L. Deng, X. Kang, K. Zhang, Q. Fu, Z. Xia and D. Gao, Microchem. J., 2020, 154, 104590 CrossRef CAS.
- X. Xu, G. Xu, F. Wei, Y. Cen, M. Shi, X. Cheng, Y. Chai, M. Sohail and Q. Hu, J. Colloid Interface Sci., 2018, 529, 568–574 CrossRef CAS PubMed.
- Q. Wu, X. Wang, S. A. Rasaki, T. Thomas, C. Wang, C. Zhang and M. Yang, J. Mater. Chem. C, 2018, 6, 4508–4515 RSC.
- B. Safaei, M. Youssefi, B. Rezaei and N. Irannejad, Smart Sci., 2018, 6, 117–124 CrossRef.
- Z. Tian, D. Li, E. V. Ushakova, V. G. Maslov, D. Zhou, P. Jing, D. Shen, S. Qu and A. L. Rogach, Adv. Sci., 2018, 5, 1800795 CrossRef PubMed.
- Z. Yuan, X. Wu, Y. Jiang, Y. Li, J. Huang, L. Hao, J. Zhang and J. Wang, J. Membr. Sci., 2018, 549, 1–11 CrossRef CAS.
- M. Gastaldi, F. Cardano, M. Zanetti, G. Viscardi, C. Barolo, S. Bordiga, S. Magdassi, A. Fin and I. Roppolo, ACS Mater. Lett., 2021, 3, 1–17 CrossRef CAS.
- S. Kalytchuk, Y. Wang, K. Poláková and R. Zbořil, ACS Appl. Mater. Interfaces, 2018, 10, 29902–29908 CrossRef CAS PubMed.
- K. Jiang, L. Zhang, J. Lu, C. Xu, C. Cai and H. Lin, Angew. Chem., Int. Ed., 2016, 55, 7231–7235 CrossRef CAS PubMed.
- A. J. Ruiz, S. Garg, S. S. Streeter, M. K. Giallorenzi, E. P. M. LaRochelle, K. S. Samkoe and B. W. Pogue, Sci. Rep., 2021, 11, 17135 CrossRef CAS PubMed.
- D. D. Patel, B. Cohen, L. Etgar and S. Magdassi, Mater. Horiz., 2018, 5, 708–714 RSC.
- X. Yang, J. Sun, F. Cui, J. Ji, L. Wang, Y. Zhang and X. Sun, Talanta, 2020, 219, 121343 CrossRef CAS PubMed.
- Z. Mahmud, A. Nasrin, M. Hassan and V. G. Gomes, Polym. Adv. Technol., 2022, 33, 980–990 CrossRef CAS.
- R. Xu, C. Qiao, M. Xia, B. Bai, Y. Li, J. Liu, H. Rong, M. Xu and J. Zhang, J. Mater. Chem. C, 2021, 9, 7194–7199 RSC.
- Y. Zhou, K. Mintz, C. Oztan, S. Hettiarachchi, Z. Peng, E. Seven, P. Liyanage, S. De La Torre, E. Celik and R. Leblanc, Polymers, 2018, 10, 921 CrossRef PubMed.
- W. Tomal, T. Świergosz, M. Pilch, W. Kasprzyk and J. Ortyl, Polym. Chem., 2021, 12, 3661–3676 RSC.
- C. S. Stan, P. Gospei Horlescu, L. E. Ursu, M. Popa and C. Albu, J. Mater. Sci., 2017, 52, 185–196 CrossRef CAS.
- M. Lei, Y. Xie, L. Chen, X. Liu, Y. Yang, J. Zheng and Q. Li, RSC Adv., 2022, 12, 27431–27441 RSC.
- W. Florkiewicz, D. Słota, A. Placek, K. Pluta, B. Tyliszczak, T. Douglas and A. Sobczak-Kupiec, J. Funct. Biomater., 2021, 12, 21 CrossRef CAS PubMed.
- T. N. Dharmapriya, D.-Y. Lee and P.-J. Huang, Sci. Rep., 2021, 11, 19577 CrossRef CAS PubMed.
- T. N. Dharmapriya, H.-Y. Shih and P.-J. Huang, Polymers, 2022, 14, 1442 CrossRef CAS PubMed.
- J. Jiang, G. Ye, Z. Wang, Y. Lu, J. Chen and K. Matyjaszewski, Angew. Chem., Int. Ed., 2018, 57, 12037–12042 CrossRef CAS PubMed.
- C. Kütahya, P. Wang, S. Li, S. Liu, J. Li, Z. Chen and B. Strehmel, Angew. Chem., Int. Ed., 2020, 59, 3166–3171 CrossRef PubMed.
- C. Kütahya, Y. Zhai, S. Li, S. Liu, J. Li, V. Strehmel, Z. Chen and B. Strehmel, Angew. Chem., Int. Ed., 2021, 60, 10983–10991 CrossRef PubMed.
- M. Wen, L. V. Ng, J. A. Payne, L. F. Francis, L. E. Scriven and A. V. McCormick, Mater. Sci., 2000, 6, 564–569 Search PubMed.
- Q. Zhang, R. Wang, B. Feng, X. Zhong and K. K. Ostrikov, Nat. Commun., 2021, 12, 6856 CrossRef CAS PubMed.
- S. Hu, A. Trinchi, P. Atkin and I. Cole, Angew. Chem., Int. Ed., 2015, 54, 2970–2974 CrossRef CAS PubMed.
- J. Bai, W. Ren, Y. Wang, X. Li, C. Zhang, Z. Li and Z. Xie, High Perform. Polym., 2020, 32, 857–867 CrossRef CAS.
| This journal is © The Royal Society of Chemistry 2023 |


