 Open Access Article
Creative Commons Attribution 3.0 Unported Licence
Transport phenomena of TiCoSb: defect induced modification in the structure and density of states†
S.
Mahakal
a,
Diptasikha
Das
b,
Pintu
Singha
c,
Aritra
Banerjee
c,
S. C.
Das
d,
Santanu K.
Maiti
e,
S.
Assa Aravindh
f and
K.
Malik
 *a
*a
aDepartment of Physics, Vidyasagar Metropolitan College, Kolkata-700006, India. E-mail: kartick.phy09@gmail.com
bDepartment of Physics, ADAMAS University, Kolkata-700126, India
cDepartment of Physics, University of Calcutta, Kolkata-700009, India
dDepartment of Physics, Tamkang University, New Taipei City-251301, Taiwan
ePhysics and Applied Mathematics Unit, Indian Statistical Institute, 203 Barrackpore Trunk Road, Kolkata-700 108, India
fNano and Molecular Systems Research Unit (NANOMO), University of Oulu, Oulu, FIN-90014, Finland
First published on 8th August 2023
Abstract
TiCoSb1+x (x = 0.0, 0.01, 0.02, 0.03, 0.04, and 0.06) samples have been synthesized, employing solid state reaction method followed by arc melting. Theoretical calculations, using density functional theory (DFT), have been performed to estimate the band structure and density of states (DOS). Further, energetic calculations using first principles have been carried out to reveal the formation energy for vacancy, interstitial and anti-site defects. A detailed structural calculation, employing Rietveld refinement, reveals the presence of embedded phases, vacancies, and interstitial atoms, which is also supported by theoretical calculations. Lattice strain, crystalline size, and dislocation density have been estimated by Williamson–Hall and modified Williamson–Hall methods. Thermal variation of resistivity [ρ(T)] and thermopower [S(T)] have been explained using the Mott equation and density of states (DOS) modification near the Fermi surface due to a Co vacancy and embedded phases. Figure of merit (ZT) has been calculated and a ZT for TiCoSb 4 to 5 times higher than earlier reported values was obtained at room temperature.
I. Introduction
Half-Heusler (HH) alloys are drawing the attention of researchers for their fascinating and unconventional physical properties along with their non-toxicity, good thermal stability, and high mechanical strength.1–6 Research studies have been conducted to harness the interesting multinary properties with the unusual electronic and magnetic behaviour of HH alloys inside device applications.4,7–9 HH compounds are extensively studied for their potential use in thermoelectric (TE) devices. HH alloys are attractive as mid-temperature TE materials for industrial waste heat recovery. Mid-temperature waste heat in industrial processes or automotive exhausts may be harnessed to convert heat into electricity using thermoelectric generators (TEGs) based on HH compounds.10–14 HH alloy-based TE materials are used to scavenge energy from ambient heat in portable power, viz., wearable devices or remote sensors.15,16 Zhu et al. have revealed that TE devices, made from HH alloys, are potential materials for TE cooling with high power density.17 TE materials are used in aerospace for power generation or thermal management in space missions and unmanned aerial vehicles (UAVs) in the absence of traditional power sources.18–20 HH alloy-based materials viz., NiMnSb, CoMnSb, and FeMnSb based compounds also exhibit magnetic properties and suitable for applications in magnetic storage devices, spintronics, and magnetic sensors.21–23 HH compound-based novel materials are not only used in TE power generation and spintronic devices but are also being explored as absorber layers in solar cells or as intermediate band materials to enhance the efficiency of photovoltaic devices.24 Vacancies, present in the Heusler compound and valence electron count (VEC) are solely responsible for the novel electronic and magnetic properties of this group of materials. The crystal structure of the HH alloys depends on the constituent elements and changes with composition viz., ZrNiSb, HfNiSb, and ScCoSb.25,26 MCoSb [M = Ti, Zr, Hf] HH alloys are inter-metallic and crystallize as a MgAgAs cubic structure with space group F![[4 with combining macron]](https://www.rsc.org/images/entities/char_0034_0304.gif) 3m.27–31 It may be considered as three inter penetrating face-centered cubic (fcc) lattice of almost identical unit cell volume. MCoSb is in the category of XYZ type HH alloy, where X is more electropositive than transition metal Y and main group Z element.30 For MCoSb, one sublattice consists of a lower valence transition metal, M, along with Sb sp atoms, and another one has been formed by a higher valence transition metal, Co, and vacancies. The materials exhibit semiconducting character in spite of the constituent element being metal.29,30 The structure may be considered as an FCC lattice with X at the octahedral site (4a = (0, 0, 0)). The structure is a combination of rock salt (XZ) and zinc blende (YZ) sub-lattice with Y at 4c (¼, ¼, ¼) and Z at 4b (½, ½, ½).30 The 4d (¾, ¾, ¾) site in F
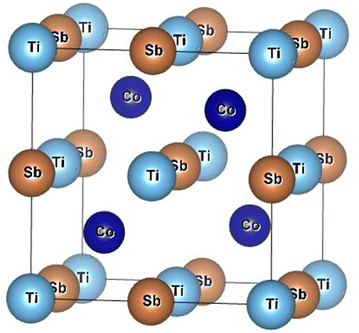
3m.27–31 It may be considered as three inter penetrating face-centered cubic (fcc) lattice of almost identical unit cell volume. MCoSb is in the category of XYZ type HH alloy, where X is more electropositive than transition metal Y and main group Z element.30 For MCoSb, one sublattice consists of a lower valence transition metal, M, along with Sb sp atoms, and another one has been formed by a higher valence transition metal, Co, and vacancies. The materials exhibit semiconducting character in spite of the constituent element being metal.29,30 The structure may be considered as an FCC lattice with X at the octahedral site (4a = (0, 0, 0)). The structure is a combination of rock salt (XZ) and zinc blende (YZ) sub-lattice with Y at 4c (¼, ¼, ¼) and Z at 4b (½, ½, ½).30 The 4d (¾, ¾, ¾) site in F![[4 with combining macron]](https://www.rsc.org/images/entities/char_0034_0304.gif) 3m is filled for the XY2Z Heusler alloy.30 The tetrahedral site 4d may be referred to as the interstitial site for the XYZ structure. A typical schematic diagram of a TiCoSb unit cell is presented in Fig. 1. The Wyckoff position of Ti, Co and Sb may also be considered at 4c (¼, ¼, ¼), 4a (0,0,0), 4d (¾, ¾, ¾), and vacant 4b (½, ½, ½) for the MgAgAs type structure.32 The TiCoSb unit cell structure with vacant 4d is more stable.32 However, the constituent atoms and structure strongly corroborated with the electronic and transport properties of HH alloy. MCoSb is an 18 VEC-type material, and the Fermi level is just above the valence band.2,33–35 Semiconducting properties in 18 VEC HH alloy arise due to the transfer of electron from the most electro positive X to the less electro positive Y and Z elements.30 However, HH alloys having VEC = 18 may be understood from the Zintal chemistry framework. Close valence cell configuration is satisfied due to the transfer of valence electron from electro positive Xn+ to covalent YZn− sub-lattice.30 It is crucial to point out that electro negativity of X, Y, and Z site atoms lies in the range 1.2–1.7, 1.8–2.4, and 1.7–2.2, respectively.36 A close cell configuration for the Y and Z atoms, i.e., d10 and s2p6 is achieved for the HH alloys.
3m is filled for the XY2Z Heusler alloy.30 The tetrahedral site 4d may be referred to as the interstitial site for the XYZ structure. A typical schematic diagram of a TiCoSb unit cell is presented in Fig. 1. The Wyckoff position of Ti, Co and Sb may also be considered at 4c (¼, ¼, ¼), 4a (0,0,0), 4d (¾, ¾, ¾), and vacant 4b (½, ½, ½) for the MgAgAs type structure.32 The TiCoSb unit cell structure with vacant 4d is more stable.32 However, the constituent atoms and structure strongly corroborated with the electronic and transport properties of HH alloy. MCoSb is an 18 VEC-type material, and the Fermi level is just above the valence band.2,33–35 Semiconducting properties in 18 VEC HH alloy arise due to the transfer of electron from the most electro positive X to the less electro positive Y and Z elements.30 However, HH alloys having VEC = 18 may be understood from the Zintal chemistry framework. Close valence cell configuration is satisfied due to the transfer of valence electron from electro positive Xn+ to covalent YZn− sub-lattice.30 It is crucial to point out that electro negativity of X, Y, and Z site atoms lies in the range 1.2–1.7, 1.8–2.4, and 1.7–2.2, respectively.36 A close cell configuration for the Y and Z atoms, i.e., d10 and s2p6 is achieved for the HH alloys.
Research in thermoelectric (TE) materials is emerging as a fascinating topic due to the potential alternative source of energy and peculiar physics involved in the technology.4,5 Thermoelectricity converts thermal energy into electrical energy and vice versa. Until now, several systems have been studied as highly efficient TE materials viz., PbTe based materials (ZT ∼ 1.5), chalcogenides [Bi2Te3 (ZT ∼ 1), Sb2Te3 (ZT ∼ 1)], Mg2Si (ZT ∼ 1.4), and oxide TE materials (ZT ∼ 2.7).30,37–39 However, applications are limited by poor chemical, mechanical strength, and thermal stability.30TiCoSb is a potential TE material at mid-temperature.40 MCoSb [M = Ti, Co, Sb] is a potential p-type TE material and efforts are on to enhance the efficiency by reducing thermal conductivity (κ).27 Large Seebeck coefficient (S(T)) and electrical conductivity (σ) due to d–d bonding near the Fermi surface make them attractive and a potential TE material. TiCoSb is paramagnetic and temperature independent.41 Terada et al. have reported that it shows ferromagnetic behaviour due to different ferroelectric phase precipitations in the HH alloy matrix.41 However, Iso-electronic alloying, defects, and disorder in the structure influence the electronic and transport properties, and concomitantly, the TE properties of the HH alloy.42 TiCoSb shows a lower band gap of ∼0.95 eV amid the other iso-electronic alloys, ZrCoSb and HfCoSb.43 Introduction of point defect at the X site and reduction of κ enhances the ZT ∼ 1 for n-type and p-type (MNiSn and MCoSb) HH Alloys.44 Nano inclusion and complex iso-electronic alloying are also important routes to enhance the efficiency of a TE material.27,45 Further, κ may be significantly reduced by point defects and disorder through phonon scattering. Iso-electronic alloying not only modifies electronic structure but also reduces κ by introducing point defects in the HH structure.45 However, a nominal amount of impurities with 19 VEC HH alloy strongly affects the TE properties of the HH alloy.46 But, scattering of a carrier with defects and disorder concomitantly reduces σ.47 Xia et al. have described that short range order along with long rage periodicity significantly enhance carrier conductivity accompanying the low κ.48 Further, disorder also strongly affects the band structure of n-type MNiSn based HH alloy.49–51 Effect of iso-electronic alloying and nano-inclusion in TE properties have been widely studied.27,40,45,52 However, investigations on consequences of defect and disorder on crystal, electronic structure, and transport properties of TiCoSb are limited.53
Phase segregation in the HH alloy matrix is one of the important aspects of the TE study. In order to avoid the presence of second phases and defects, several methods have been implemented to synthesize TiCoSb HH alloy.54–56 Sometimes, defects are favourable to enhance TE properties through modification in electrical and thermal transport properties.54,55 However, ZT has been reduced due to segregation of the secondary phase viz., CoSb in TiCoSb matrix.56 M. Assad et al. have reported that embedded phases in doped TiCoSb enhance the ZT due to a reduction in κL.54 C. S. Birkel et al. have synthesized TiCoSb in two different ways, mechanical alloying, and microwave synthesis. It has been observed that the second phase causes a reduction in TE properties.55 Arc melting is one of the common techniques to synthesize HH or FH alloys. But the difference in melting points of constituent elements in the stoichiometry causes a source of defect/segregation in the HH alloy.54,56 In order to avoid loss due to evaporation, there are instances of using extra Sb in TiCoSb stoichiometry.57 However, the role of defects and second phases on the TE properties of TiCoSb requires a systematic study. There is no meticulous investigation for the inclusion of extra Sb during the synthesis of TiCoSb and effect on TE properties due to the complex interplay of vacancies and embedded phases. Furthermore, this study may enlighten the source of defects, embedded phases in the synthesized matrix, and correlation with the transport properties of TiCoSb HH alloy.
Here we have reported the role of defects and precipitated phase on electronic structure and transport properties of polycrystalline TiCoSb alloy synthesized by solid state reaction followed by arc melting. In-depth structural characterizations have been performed using Rietveld refinement method from the X-ray diffraction (XRD) data. Occupancy and precipitated phase have been revealed from XRD. Vacancy in the synthesized materials has been shown schematically. Further, electronic band structure, DOS, and formation energy of TiCoSb have been estimated using density functional theory (DFT) calculation, considering the super cell structure. Effects of vacancy, interstitial defect, and anti-site defects have also been included in DFT calculations. Temperature dependent resistivity (ρ(T)) and S(T) measurements have been carried out at low temperatures down to 10 K. Electron–electron (e–e) and electron–phonon (e–ph) coefficients have been estimated from the thermal variation of ρ(T) and S(T) data. The first time in-depth structural study using the refinement and correlation with low temperature transport properties has been presented in this article. Further, attempts have been made for theoretical calculation of band structure, density of states (DOS), and total energy per atom. Bipolar conduction has been found, according to the results obtained from transport properties and correlated with the structural parameters evaluated using Rietveld refinement. DOS has been tuned by modification in structural parameters and correlation with ρ(T), S(T) data have been elucidated, using the Mott equation. Theoretical and experimental data along with the estimated parameters have been corroborated in this endeavour.
In our present work, we have considered TiCoSb as a functional element for suitable energy conversion. TiCoSb1+x (x = 0.0, 0.01, 0.02, 0.03, 0.04, 0.06) has been synthesized to study the role of defects and embedded phases in structural, transport, and electronic properties. The key findings of the present study are (i) Co vacancies in TiCoSb unit cell increase with Sb concentration, (ii) minute amount of CoTi and CoSb embedded phases have been revealed and supported by theoretical study, (iii) embedded phases, dislocation density, and strain are minimum, correspondingly maximum TiCoSb phase has been observed in TiCoSb1.02, (iv) modification in thermal variation of resistivity and thermopower is related with DOS due to Co vacancies, (v) inclusion of 2% extra Sb in TiCoSb stoichiometry during synthesis is sufficient to compensate the weight loss, and (vi) 4 to 5 times higher ZT than previously divulged for TiCoSb at room temperature has been obtained.
This paper is organized as follows. Section II describes precise steps for sample synthesis and characterizations to analyse the experimental results. Computational details for theoretical calculations have been presented in Section III. All the theoretical and experimental results have been critically scrutinized and discussed in Section IV. Finally, conclusion and correlation have been drawn on the basis of theoretical and experimental results in Section V.
II. Experimental details
Polycrystalline TiCoSb1+x (x = 0, 0.01, 0.02, 0.03, 0.04, 0.06) samples were synthesized by solid state reaction. Weighted Ti (purity 99.998%; Alfa Aesar, UK), Co, and Sb (each of purity 99.99%; Alfa Aesar, UK) were arc melted at Argon atmosphere, and ingots were melted several times to obtain homogeneous alloy. The arc melted ingots were sealed in a quartz ampoule under pressure 10−3 mbar for further treatment. Evacuated quartz ampoules were annealed at 1173 K for five days and then cooled down to room temperature at a cooling rate 10 °C hour−1. The prepared ingots were cut in rectangular shapes of dimension (1.5 mm × 2 mm × 5 mm) for measurement of transport properties. In order to carry out XRD measurements, prepared ingots were pulverised into fine powder. Structural characterization of the synthesized host phases, i.e., TiCoSb, TiCoSb1.01, TiCoSb1.02, TiCoSb1.03, TiCoSb1.04, and TiCoSb1.06 have been carried out by XRD using Diffractometer model: X’Pert Powder, PANalytical using Cu-Kα radiation of wavelength 0.15406 nm. XRD has been carried out at room temperature in the range 20° ≤ θ ≤ 80° in θ–2θ geometry. The Williamson–Hall and Modified Williamson–Hall methods have been employed to estimate lattice strain (ε), crystal size (d), and dislocation densities (ND) of the synthesized samples using the XRD data.58,59 Further, in-depth structural analysis has been carried out by the Rietveld refinement technique using FullProf software.60 Refinement analysis of the Bragg scattered TiCoSb1+x phases have provided exhaustive information on the long-range order in the host phase along with defects and disorder in the synthesized HH alloy structure. Further, mix-phase has been introduced during Rietveld refinements to investigate the presence of defects and embedded phases in the TiCoSb matrix. ρ(T) measurements of the synthesized polycrystalline alloys have been carried out using the conventional four probe method down to 10 K. S(T) measurements have been performed down to 20 K, employing standard differential technique.61–63 TiCoSb is a HH alloy with a vacant 4d (3/4, 3/4, 3/4) and prone to antisite/interstial defects. The defects have also been correlated with transport properties through modifications in the DOS of the synthesized samples. Embedded phases and defects in TiCoSb significantly alter the transport properties through carrier scattering and modification in electronic structure.In order to corroborate the experimental findings, DFT calculations have been carried out using the plane wave pseudopotential code Vienna Ab initio Simulation Package (VASP).64
III. Computational details
We have carried out DFT calculations for TiCoSb using the plane wave pseudopotential code VASP.64 To expand the plane waves included in the basis set, kinetic energy cut-off of 520 eV has been used. A generalized gradient approximation (GGA) has been employed in the Perdew Burke Erzenhof (PBE) formalism.65,66 The atomic positions have been relaxed using energy and force tolerance of 10−6 eV and 0.001 eV A−1, respectively, to minimize the Hellmann–Feynmann forces. An fcc unit cell of TiCoSb has been optimized, and a relaxed lattice parameter of 5.88 Å has been found. A Monkhorst Pack K grid of 4 × 4 × 4 has been utilized for the Brillouin zone integration.IV. Results and discussion
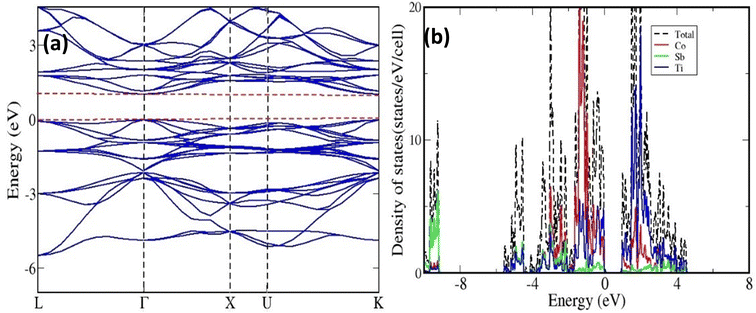
The band structure and DOS have been presented in Figs. 2(a) and (b), respectively. A direct band gap of about 1.03 eV at the gamma point has been obtained. The DOS calculation has shown that the valence band maximum and conduction band minimum have mainly constituted from the contribution of Co and Ti orbitals, respectively.We have simulated a super-cell of TiCoSb, containing 48 atoms using the optimized lattice parameter of the unit cell. In this super-cell, vacancies, interstitials, and anti-sites have been introduced. The total energy per atom of these super-cells is presented in Table 1. The energetic calculations have shown that the super-cell containing Co vacancy is more stable than that of Ti and Sb. Further, the system with Ti in the interstitial position is more stable than Co and Sb. We have also carried out calculations by introducing Co and Sb in the Ti position and found that the latter is more stable. The total energy per atom, calculated for the TiCoSb super-cell with 48 atoms, has also been shown for comparison. It is shown that having an interstitial Ti atom is closer in stability to the perfect structure.
| TiCoSb | Vacancy | Interstial | Antisite | ||||||
|---|---|---|---|---|---|---|---|---|---|
| Energy (eV) | −6.96 | VTi | VCo | VSb | Ti | Co | Sb | Ti–Co | Ti–Sb |
| −6.72 | −6.77 | −6.76 | −6.94 | −6.93 | −6.78 | −6.82 | −6.86 | ||
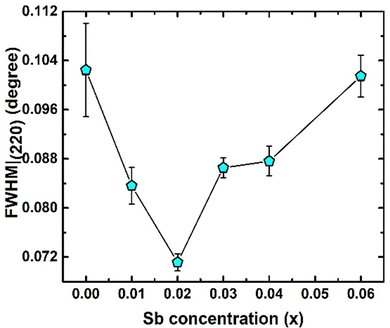
Fig. 3 represents the XRD pattern of TiCoSb1+x (x = 0.0, 0.01, 0.02, 0.03, 0.04, 0.06) samples synthesized by solid state reaction method. XRD has shown that the bulk matrices of the synthesized samples have crystallised in a cubic MgAgAs type structure. All the diffraction peaks have been indexed to the corresponding structure and space group (F![[4 with combining macron]](https://www.rsc.org/images/entities/char_0034_0304.gif) 3m, No. 216) (Fig. 3). The effect of Sb concentrations on the most intense peak (220) has been demonstrated in Fig. 3 (inset) (220). XRD peaks shift towards a higher 2θ angle for 0 ≤ x ≤ 0.04, indicating a reduction in unit cell volume. However, a large shift of the (220) peak towards a lower angle has been observed for x = 0.06. Any extra impurity peak has not been found in the XRD detection level. The full width at half maxima (FWHM) of (220) peaks has been estimated and presented in Fig. 4. FWHM of the synthesized samples decreases for 0 ≤ x ≤ 0.02, indicating enhancement of crystal quality as HH alloy. An increase in Sb, i.e., for 0.02 ≤ x ≤ 0.06, increase in FWHM represents degradation of crystal quality. However, structural disorder, defects, and degradation of crystal quality may arise owing to the inherent off-stoichiometry and embedded phase.
3m, No. 216) (Fig. 3). The effect of Sb concentrations on the most intense peak (220) has been demonstrated in Fig. 3 (inset) (220). XRD peaks shift towards a higher 2θ angle for 0 ≤ x ≤ 0.04, indicating a reduction in unit cell volume. However, a large shift of the (220) peak towards a lower angle has been observed for x = 0.06. Any extra impurity peak has not been found in the XRD detection level. The full width at half maxima (FWHM) of (220) peaks has been estimated and presented in Fig. 4. FWHM of the synthesized samples decreases for 0 ≤ x ≤ 0.02, indicating enhancement of crystal quality as HH alloy. An increase in Sb, i.e., for 0.02 ≤ x ≤ 0.06, increase in FWHM represents degradation of crystal quality. However, structural disorder, defects, and degradation of crystal quality may arise owing to the inherent off-stoichiometry and embedded phase.
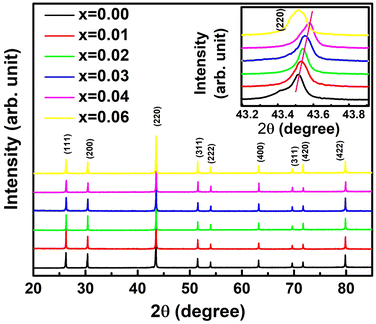 | ||
| Fig. 3 X-ray diffraction pattern of synthesized TiCoSb1+x (x = 0.0, 0.01, 0.02, 0.03, 0.04, 0.06) polycrystalline materials (Insets shows position of highest intense (220) peak). | ||
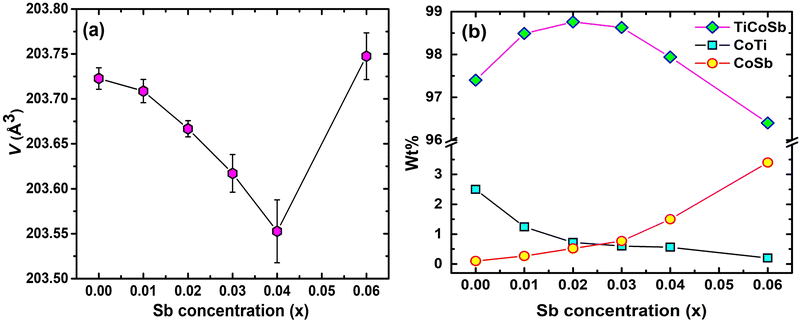
In order to estimate in-depth structural parameters, Rietveld refinement analysis has been carried out using Fullprof software.60 Further, the presence of embedded phases has been revealed by introducing a mix-phase Rietveld analysis. The CoTi and CoSb phases have been incorporated during Rietveld refinement, which improves the fitting quality, and reduces χ2 (goodness of fit). However, reports on in-depth structural analysis of TiCoSb using Rietveld analysis are limited. But till date, no effort has been made to reveal the effect of Sb on structural and transport properties of the TiCoSb alloy using mix-phase Rietveld refinement. The experimental XRD patterns along with the theoretical fitted curve after Rietveld analysis are given in Fig. S1 (ESI†). Lattice parameter ‘a’ of the synthesized samples has been estimated, and a ∼ 0.5883 nm has been obtained for TiCoSb1+x (0 ≤ x ≤ 0.06) samples. Value of ‘a’ parameter is in good agreement with the theoretically obtained value. A similar value of ‘a’ parameter has also been reported by Webster and Ziebeck (a = 0.5884 nm).67 Unit cell volumes of the synthesized samples have been estimated and presented in Fig. 5(a). Unit cell volume gradually decreases with increasing Sb concentration for 0 ≤ x ≤ 0.04 and increases for x = 0.06, corroborated with (220) peak shift in the XRD pattern (Inset Fig. 3).
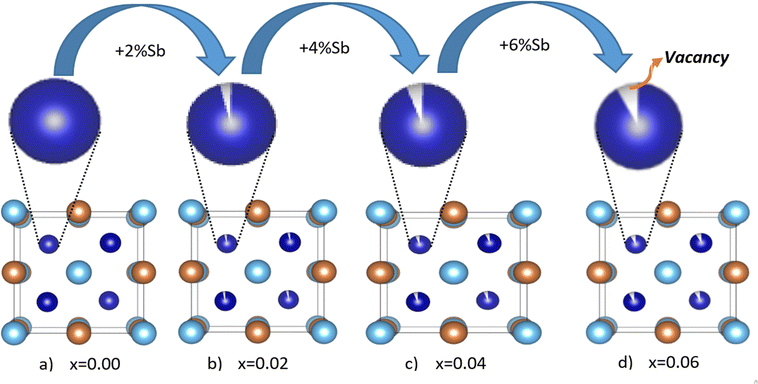
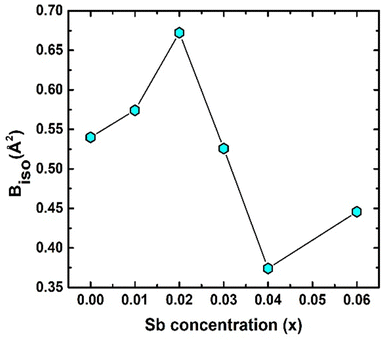
In-depth mix phase Rietveld analysis has revealed the presence of a minute amount of CoTi and CoSb phases in the synthesized TiCoSb1+x matrix. Sb concentration-dependent weight percentage (wt%) of all the existing phases in the synthesized TiCoSb samples are depicted in Fig. 5(b). wt% of CoTi phase decreases and CoSb phase increases gradually with Sb concentration in TiCoSb samples. A maximum TiCoSb phase as high as ∼99% has been achieved for x = 0.02. Phase segregations have been frequently observed in ternary, intermetallic TiCoSb-based HH alloys due to large differences in specific gravity and boiling points (Sb: 1587 °C, Ti: 1668 °C, Co: 1495 °C) of the constituent elements.44 Evaporation of Sb during the arc melting of weighted elements in TiCoSb samples is one of the key reasons for the segregation of phases in the HH alloy host matrix.68 Deviation from the chemical composition of TiCoSb during synthesis may lead to the presence of CoTi-embedded phases and structural disorder in the prepared samples.68 A meticulous investigation has revealed that the variation of wt% of TiCoSb, CoTi, and CoSb phases with Sb concentration is associated with a slope change at x = 0.02. wt% of the host phase TiCoSb rapidly decreases after x = 0.02. Further, systematic Co vacancy in the synthesized TiCoSb samples has been revealed using the Rietveld refinement and a schematic representation is provided in Fig. 6 by employing Vesta software.69 Co vacancy gradually increases with Sb concentration in TiCoSb1+x (0 ≤ x ≤ 0.06). The decrease in lattice volume of the synthesized sample may be related to (0 ≤ x ≤ 0.04) increasing Co vacancy in the system. Das et al. have reported that Te vacancy-mediated point defects in Sb2Te3 TE material cause a decrease in unit cell volume.70 However, a jump in lattice volume for the TiCoSb1.06 sample has been observed. Primarily, Co vacancies have been created in the TiCoSb system as observed from Rietveld refinement analysis, and CoSb phases have formed in reaction with extra Sb. Further, the increase of Sb in TiCoSb may cause the presence of interstitial atoms and anti-site defects simultaneously. There are two possibilities arising due to the increase of Sb in TiCoSb; Sb atom either goes into the interstitial site, i.e., 4d (¾, ¾, ¾,) or simultaneously, Ti atom goes into the interstitial vacant 4d (¾, ¾, ¾) position and Sb atom occupies Ti site, i.e., Sb–Ti(SbTi) anti-site defect. According to the theoretical calculations, Ti at the interstitial position is more favourable than other configurations, and SbTi anti-site is more stable than other anti-site defects. Interstitial Ti atoms in the TiCoSb unit cell causes an increase in lattice volume for x = 0.06 and decrease in CoTi embedded phases in the TiCoSb matrix (Fig. 5). This result has been also corroborated with the peak shift in the XRD pattern in Fig. 3. XRD peak (220) shifts towards a higher angle for 0 ≤ x ≤ 0.04 compared to the TiCoSb sample [Fig. 3(inset)] owing to the collective diffraction from the embedded (segregated) phases and decreasing disorder, suggesting that the lattice constant has contracted. Whereas (220) peak shifts towards a lower angle for x = 0.06 and is related to an increase in unit cell volume due to interstitial Ti atoms. Further, Rietveld refinement has been employed to estimate the Debye–Waller factor (Biso) related to positional disorder. The effect of extra Sb on Biso of the synthesized samples (TiCoSb1+x) is presented in Fig. 7. A non-monotonic variation of Biso with Sb concentration has been observed and anomaly for x = 0.02 has been corroborated with other structural data viz., FWHM of the XRD peak, unit cell volume, and estimated wt% of embedded phases. The Debye equation may be applied to estimate Debye temperature (θD) if the harmonic approximation, i.e., the cubic and monoatomic structure is considered. θD and Biso are related with the following equation within harmonic approximation71
 | (1) |
| Sb concentration (x). | B iso (Å2) | θ D (K) | κ e (W m−1 K−1) | κ tot (W m−1 K−1) | ρ 300K (μΩ m) | S 300K (μV K−1) | ZT 300K |
|---|---|---|---|---|---|---|---|
| 0.00 | 0.53 | 287 | 0.01339 | 4.945 | 536.54 | −4.5 | 9.6 × 10⁻⁶ |
| 0.01 | 0.57 | 378 | 0.02308 | 4.6185 | 283.42 | −44.5 | 8 × 10⁻⁴ |
| 0.02 | 0.68 | 356 | 0.10422 | 3.94279 | 58.34 | −76 | 0.025 |
| 0.03 | 0.52 | 391 | 0.01078 | 5.09605 | 517.718 | −116.6 | 0.00723 |
| 0.04 | 0.37 | 447 | 0.00767 | 7.605 | 704.5 | −129.4 | 0.00313 |
| 0.06 | 0.44 | 417 | 0.02725 | 6.1972 | 535.22 | −95.8 | 0.00691 |
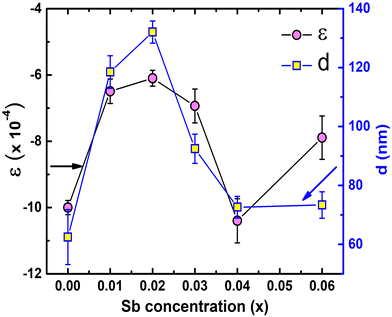
Non-monotonic variation of ε and d of the synthesized samples is depicted in Fig. 8. The Williamson–Hall method has been employed to estimate ε and d using the relation58
 | (2) |
Estimated ε for all TiCoSb1+x (x = 0, 0.01, 0.02, 0.03, 0.04, 0.06) samples is negative in nature, indicating compressive strain74 (Please find supplementary Fig. S2 for Williamson–Hall plot, ESI†). The variations of ε and d with the Sb concentration of the synthesized samples are dissimilar in nature. The magnitude of ε is minimum and d is maximum for x = 0.02 amid TiCoSb1+x (x = 0, 0.01, 0.02, 0.03, 0.04, 0.06) synthesized samples. It may arise due to the lowest wt% of embedded phases viz., CoTi, CoSb, and maximum TiCoSb phase in TiCoSb1.02. However, the highest d for the TiCoSb1.02 sample may be explained in light of the well-known Hall–Petch formula. According to the Hall–Petch formula, the strengthening effect of grain boundaries may be described as75–77
| σGB = kyd−1/2 | (3) |
 | (4) |
K [= 2![[thin space (1/6-em)]](https://www.rsc.org/images/entities/char_2009.gif) sin
sin![[thin space (1/6-em)]](https://www.rsc.org/images/entities/char_2009.gif) θB/λ] and ΔK [= Δ(2θB)cos
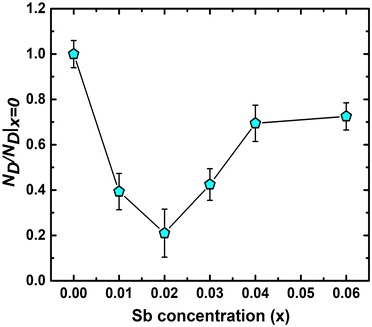
θB/λ] and ΔK [= Δ(2θB)cos![[thin space (1/6-em)]](https://www.rsc.org/images/entities/char_2009.gif) θB/λ] parameters have been estimated from XRD data, where θB is the Bragg angle, Δ(2θB) is the FWHM of the corresponding diffraction peak at θB and λ (= 0.15406 nm) is the wavelength of Cu-Kα X-ray. ND has been obtained from the slope of ‘ΔK versus K2C’ curve, where C is average dislocation contrast factor. The ‘ΔK versus K2C’ plots of the synthesized TiCoSb1+x (x = 0.0, 0.01, 0.02, 0.03, 0.04, 0.06) samples have been given in the ESI† (Fig. S3). Further, XRD data may be employed to estimate the dislocation density (ND) in the synthesized materials. The ND of the synthesized samples (TiCoSb1+x; x = 0.0, 0.01, 0.02, 0.03, 0.04, 0.06) has been estimated with respect to the TiCoSb (i.e., x = 0.00) sample. Non-monotonic behaviour of relative dislocation density (ND/ND|x=0) as a function of Sb concentration (x) has been depicted in Fig. 9. ND increases on either side of the point x = 0.02, and the lowest ND has been observed for the TiCoSb1.02 sample. This is in agreement with the previous analysis that the presence of a minimum embedded phase with good crystal quality has been observed for the TiCoSb1.02 sample amid synthesized samples (TiCoSb1+x; x = 0.0, 0.01, 0.02, 0.03, 0.04, 0.06). An increase in the wt% of embedded phases in the synthesized samples may enhance the lattice mismatch at the grain boundary, causing an increment in ND.
θB/λ] parameters have been estimated from XRD data, where θB is the Bragg angle, Δ(2θB) is the FWHM of the corresponding diffraction peak at θB and λ (= 0.15406 nm) is the wavelength of Cu-Kα X-ray. ND has been obtained from the slope of ‘ΔK versus K2C’ curve, where C is average dislocation contrast factor. The ‘ΔK versus K2C’ plots of the synthesized TiCoSb1+x (x = 0.0, 0.01, 0.02, 0.03, 0.04, 0.06) samples have been given in the ESI† (Fig. S3). Further, XRD data may be employed to estimate the dislocation density (ND) in the synthesized materials. The ND of the synthesized samples (TiCoSb1+x; x = 0.0, 0.01, 0.02, 0.03, 0.04, 0.06) has been estimated with respect to the TiCoSb (i.e., x = 0.00) sample. Non-monotonic behaviour of relative dislocation density (ND/ND|x=0) as a function of Sb concentration (x) has been depicted in Fig. 9. ND increases on either side of the point x = 0.02, and the lowest ND has been observed for the TiCoSb1.02 sample. This is in agreement with the previous analysis that the presence of a minimum embedded phase with good crystal quality has been observed for the TiCoSb1.02 sample amid synthesized samples (TiCoSb1+x; x = 0.0, 0.01, 0.02, 0.03, 0.04, 0.06). An increase in the wt% of embedded phases in the synthesized samples may enhance the lattice mismatch at the grain boundary, causing an increment in ND.
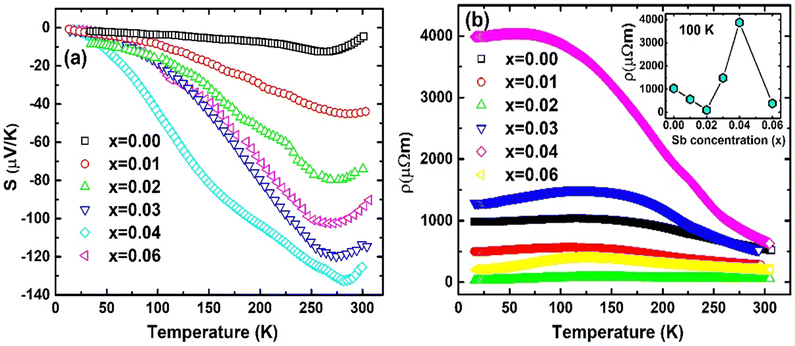
Temperature dependent S(T) has indicated all the synthesized samples (Fig. 10(a)) TiCoSb1+x (x = 0.0, 0.01, 0.02, 0.03, 0.04, 0.06) are n-type in nature. The negative value of S(T) has indicated a majority of carriers are electrons. However, pristine TiCoSb should have shown positive S(T), i.e., p-type in nature.79,80 Synthesized samples have shown an n-type nature as Fermi surfaces have been modified due to embedded phases and defects. The magnitude of S(T) values is different than the previously reported.43,81,82 However, Sekimoto et al. have also reported a similar S(T) value of TiCoSb ∼−150 μV K−1 at 350 K.68 An increase in S(T) data beyond 275 K may be attributed to thermal excitation of minority carriers at high temperatures.83 It has been found that S(T) for TiCoSb (i.e., x = 0.00) is nearly zero. |S(T)| of the synthesized samples, TiCoSb1+x (0 < x ≤ 0.04) increases with increasing Sb concentration. However, |S(T)| slightly reduces for TiCoSb1.06.
The non-monotonic behavior of S(T) with Sb concentration may be attributed to the band structure modification owing to the presence of defects (vacancy, interstetial, and antisite) and embedded phases (CoTi and CoSb). The thermopower of a semiconductor may be written as45,84
 | (5) |
Here, Sn/Sp (Sn,p) and σn/σp (σn,p) are the Seebeck coefficients and the electrical conductivities due to n-type and p-type carriers, respectively. It has been assumed that both types of charge carriers are involved in the conduction process. However, Sn,p may be written as, according to the Mott expression85,86
 | (6) |
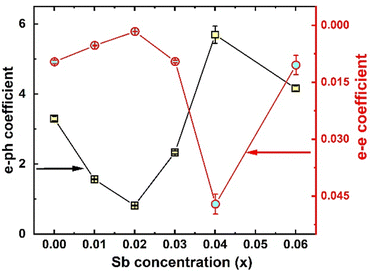
ρ(T) of all the synthesized samples, TiCoSb1+x (x = 0.0, 0.01, 0.02, 0.03, 0.04, 0.06) has been depicted in Fig. 10(b). Non-monotonic thermal variations of ρ(T) indicate that the synthesized TiCoSb1+x (x = 0.0, 0.01, 0.02, 0.03, 0.04, 0.06) samples are semiconducting in nature. ρ(T) decreases with increasing Sb concentration for 0 ≤ x ≤ 0.02. However, further increase of extra Sb causes increase in ρ(T) (0.02 ≤ x ≤ 0.04) and the highest ρ(T) is observed for the x = 0.04 sample. ρ(T) at 300 K of the synthesized samples has been presented in Table 2. ρ(T) of TiCoSb1.02 is similar to the previously reported value for pristine TiCoSb.68 Increase in ρ(T) with Sb concentration for TiCoSb1+x samples may be related to the inherent Co vacancy in the synthesized samples. In the preceding discussion, it has been observed that Co vacancy may lead to a decrease in σtot (= σn + σp) due to a change in DOS at the valence band. However, embedded phases, defects, and disorder also play crucial roles in the conduction of carrier.88,89 Embedded phases in the TiCoSb host phases may act as scattering centre during the conduction processes. In order to get insight into scattering, e–e and e–ph scattering coefficients have been estimated from the ρ(T) data. The ρ(T) data has been fitted with equation ρ(T) = ρ0 + AT + BT2 at low temperature (T < 150 K), where A and B represent e–ph and e–e scattering coefficients, respectively.77,90 Non-monotonic variation of e–e and e–ph have been presented in Fig. 11. e–e and e–ph coefficients have decreased for 0 ≤ x ≤ 0.02 in TiCoSb1+x samples, and a sudden drop has been observed for the TiCoSb1.02 sample. It is important to mention that the maximum wt% of the TiCoSb phase is obtained for TiCoSb1.02 and crystal quality increases for the TiCoSb1.02 sample. The decrease in wt% of TiCoSb phase and increase in Co vacancy along with embedded phases increase the scatttering center of the synthesized samples TiCoSb1+x (0.02 ≥ x > 0 and 0.02 ≤ x ≤ 0.04). The highest wt% of the TiCoSb phase has been obtained for the TiCoSb1.02 sample, and correspondingly lowest ρ(T) has been observed. Embedded phases and Co vacancy increase for x = 0.03 and 0.04, which corroborated with the increase in ρ(T). A sudden drop in ρ(T) for TiCoSb1.06 may be related to the change in the band structure and formation of the impurity band, owing to excessive impurity phases and interstitial atoms.
The power factor, PF (S2σ) of the synthesized samples has been estimated using S–T and ρ–T data. ‘PF versus temperature’ data of TiCoSb1+x are depicted in Fig. S4 (ESI†). Non-monotonic thermal variation of power factor is observed. The highest power factor is obtained for TiCoSb1.02 at 300 K.
In order to get the flavour of change in ZT due to embedded phases and defects, thermal conductivity κ (κ = κe + κL, κe = electronic thermal conductivity and κL = lattice thermal conductivity) has been estimated. κe has been estimated using the well-known Wiedemann Franz law, κe = LσT (L is the Lorenz number). Further, L has been calculated from the temperature dependent S(T) data, employing the relation L = [1.5 + exp(−|S|/116)] × 10−8.91κL is directly related to the phonon scattering mechanism viz., phonon–phonon scattering due to defects. Heat conduction has been performed by acoustic phonons, and the Umklapp process is dominant in the phonon scattering at high temperature. However, according to Slack, κL may be written in the limit Umklapp scattering processes92
 | (7) |
![[M with combining macron]](https://www.rsc.org/images/entities/i_char_004d_0304.gif) , δ3 and n are the average atomic mass in the unit cell, volume per atom, and number of atoms in the primitive cell, respectively. There are 12 atoms per unit cell of TiCoSb, i.e., n = 12 and Λ ∼ 3.1 × 10⁻⁶ (a physical constant). The value of the Gruneisen parameter γG of pristine TiCoSb has been considered to estimate κL of the synthesized samples using eqn (7). It is important to note that γG is almost temperature independent and depends on the stoichiometry of the constituent elements. In this study, we are dealing with TiCoSb material with a very small variation of Sb in stoichiometry. Hence, γG of TiCoSb, i.e., 2.13, has been considered for calculation of κL using eqn (7).32ZT of the synthesized samples has been estimated using equation ZT = S2σT/κ. The value of θD, estimated using Rietveld refinement and κL of the synthesized samples have been presented in Table 2. Fig. 12 represents the dependency of ZT on extra Sb concentration in TiCoSb1+x at room temperature. It is crucial to mention that a drastic change in ZT has been observed for the TiCoSb1.02 sample. Maximum ZT ∼ 0.025 has been observed for the TiCoSb1.02 sample, which is nearly 4 to 5 times higher than the previously reported values for the pristine TiCoSb at room temperature.40,42,54–56
, δ3 and n are the average atomic mass in the unit cell, volume per atom, and number of atoms in the primitive cell, respectively. There are 12 atoms per unit cell of TiCoSb, i.e., n = 12 and Λ ∼ 3.1 × 10⁻⁶ (a physical constant). The value of the Gruneisen parameter γG of pristine TiCoSb has been considered to estimate κL of the synthesized samples using eqn (7). It is important to note that γG is almost temperature independent and depends on the stoichiometry of the constituent elements. In this study, we are dealing with TiCoSb material with a very small variation of Sb in stoichiometry. Hence, γG of TiCoSb, i.e., 2.13, has been considered for calculation of κL using eqn (7).32ZT of the synthesized samples has been estimated using equation ZT = S2σT/κ. The value of θD, estimated using Rietveld refinement and κL of the synthesized samples have been presented in Table 2. Fig. 12 represents the dependency of ZT on extra Sb concentration in TiCoSb1+x at room temperature. It is crucial to mention that a drastic change in ZT has been observed for the TiCoSb1.02 sample. Maximum ZT ∼ 0.025 has been observed for the TiCoSb1.02 sample, which is nearly 4 to 5 times higher than the previously reported values for the pristine TiCoSb at room temperature.40,42,54–56
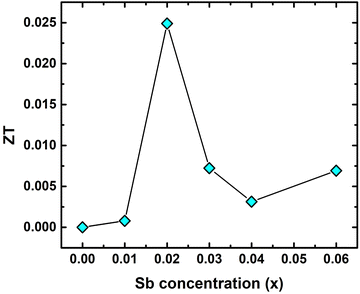 | ||
| Fig. 12 Room temperature ZT of TiCoSb1+x (x = 0.0, 0.01, 0.02, 0.03, 0.04, 0.06) half-Heusler alloy. | ||
To make the present communication a self-contained one, here, we make a brief comparison of our results with the previously reported TE responses and some possible functional elements that can be utilized for energy conversion. For instance, we want to highlight ZrNiSb, HfNiSb, and ScCoSb alloys.25 These are metallic and crystallize in the TiNiSi structure type. ScCoSb and ZrNiSb show no band gap in the vicinity of the Fermi level, whereas TiCoSb exhibits Eg ∼ 1.03 eV. TE studies are not reported for HfNiSb and ZrNiSb alloys, to date, to the best of our concerns. However, it seems that materials may show poor TE performance related to TiCoSb due to their metallic nature. ZT ∼ 0.009 is reported for ScCoSb HH alloy at 380 K,93 and our synthesized sample shows better TE performance and almost 2.6 times higher value is reported in the current work. Asaad et al. have reported ZT ∼ 0.01 for TiCoSb-based HH alloy at room temperature.54ZT∼ 0.005 is reported by Birkel et al. for TiCoSb HH alloy at room temperature, prepared by arc-melting.55 Comparing the earlier results, we can safely argue that our functional element is quite superior for energy conversion.
V. Conclusion
In conclusion, the effect of embedded phases and defects on structural, resistive, and thermopower of TiCoSb HH polycrystalline material have been reported. Theoretical calculations have been employed to estimate the DOS, band structure, and formation energy for the vacancy, anti-site, and interstitial defects. Six samples of TiCoSb1+x (x = 0.0, 0.01, 0.02, 0.03, 0.04, 0.06) have been synthesized using solid state reaction method, followed by arc-melting. Excess Sb has been added to TiCoSb stoichiometry to compensate for the evaporated Sb and create vacancies and embedded phases during the arc melting of the constituent elements. Mix-phase Rietveld refinement analysis of the XRD data clearly reveals the presence of CoTi and CoSb phases. Optimization of CoTi and CoSb phases and maximum wt% of TiCoSb are observed for TiCoSb1.02. A distinct slope change is observed at 2% extra Sb concentration for ‘wt% of TiCoSb’ versus the ‘Sb concentration’ graph. Co vacancy increases with Sb concentration obtained from Rietveld refinement and schematically presented using VESTA software. θD employing Biso, obtained from XRD data of the synthesized samples has been estimated and θD of TiCoSb1.02 matches with reported value. Lattice strain (ε) and grain size (d) have been estimated by Williamson–Hall plots. Minimum ε and maximum d are obtained for 2% extra Sb contained sample due to improved crystal quality and maximum TiCoSb phase. It also supports the minimum ND for the TiCoSb1.02 sample. S(T) and ρ(T) are related to the modification of DOS owing to the Co vacancy and embedded phases, explained by the Mott equation. The e–e and e–ph scattering coefficients are correlated with the defects and the embedded phases. PF has been estimated using ρ(T) and S(T) data. In order to get the flavour of ZT, κL and κe are calculated from XRD and resistivity data using temperature dependent Lorentz number obtained from S(T). However, the final conclusion may be drawn after the detailed analysis of the experimental data of κ. ZT of TiCoSb strongly depends on extra Sb added to stoichiometry during synthesis. It has been observed that the ZT of the TiCoSb1.02 sample is 4 to 5 times greater than previously reported values for TiCoSb at room temperature. Corroborated structural and transport data reveal that the best pristine phase of TiCoSb and greater TE properties of TiCoSb is obtained for 2% extra Sb contained sample. Hence, 2% extra Sb in TiCoSb stoichiometry is sufficient to compensate the loss of Sb during synthesis. The resistivity and thermopower of TiCoSb are influenced due to the modification in DOS near the Fermi surface by defects and embedded phases.Conflicts of interest
There are no conflicts to declare.Acknowledgements
This work is supported by the Science and Engineering Research Board (SERB), Government of India, in the form of sanctioning research project (File Number: EEQ/2018/001224). We acknowledge UGC DAE CSR, Kolkata, for providing arc melting facilities. Author SM is thankful to CSIR, India for providing Research Fellowships (File Number: 08/463(0002)/2019-EMR-I).References
- F. Zelenka, P. Brož, J. Vřešťál, J. Buršík, A. Zemanová, G. Rogl and P. Rogl, CALPHAD, 2021, 74, 102292 CrossRef CAS.
- P. Larson, S. D. Mahanti and M. G. Kanatzidis, Phys. Rev. B: Condens. Matter Mater. Phys., 2000, 62, 12754 CrossRef CAS.
- S.-Y. Lin, M. Chen, X.-B. Yang, Y.-J. Zhao, S.-C. Wu, C. Felser and B. Yan, Phys. Rev. B: Condens. Matter Mater. Phys., 2015, 91, 094107 CrossRef.
- W. Al-Sawai, H. Lin, R. S. Markiewicz, L. A. Wray, Y. Xia, S. Y. Xu, M. Z. Hasan and A. Bansil, Phys. Rev. B: Condens. Matter Mater. Phys., 2010, 82, 125208 CrossRef.
- H. Shi, W. Ming, D. S. Parker, M.-H. Du and D. J. Singh, Phys. Rev. B, 2017, 95, 195207 CrossRef.
- S. Chadov, X. Qi, J. Kübler, G. H. Fecher, C. Felser and S. C. Zhang, Nat. Mater., 2010, 9, 541 CrossRef CAS PubMed.
- Z. Hou, W. Wang, G. Xu, X. Zhang, Z. Wei, S. Shen, E. Liu, Y. Yao, Y. Chai and Y. Sun, et al. , Phys. Rev. B: Condens. Matter Mater. Phys., 2015, 92, 235134 CrossRef.
- N. S. Chauhan, S. Bathula, A. Vishwakarma, R. Bhardwaj, K. K. Johari, B. Gahtori and A. Dhar, J Materiomics, 2019, 5, 94 CrossRef.
- H. Lin, L. A. Wray, Y. Xia, S. Xu, S. Jia, R. J. Cava, A. Bansil and M. Z. Hasan, Nat. Mater., 2010, 9, 546 CrossRef CAS PubMed.
- S. LeBlanc, Sustain. Mater. Technol., 2014, 1–2, 26 Search PubMed.
- S. Bentouba, N. Zioui, P. Breuhaus and M. Bourouis, Energies, 2023, 16, 5193 CrossRef.
- R. J. Quinn and J.-W. G. Bos, Mater. Adv., 2021, 2, 6246 RSC.
- S. J. Poon, D. Wu, S. Zhu, W. Xie, T. M. Tritt, P. Thomas and R. Venkatasubramanian, J. Mater. Res., 2011, 26, 2795 CrossRef CAS.
- S. Populoh, O. C. Brunko, K. Gałązka, W. Xie and A. Weidenkaff, Materials, 2013, 6, 1326 CrossRef CAS PubMed.
- Y. Sargolzaeiaval, V. Padmanabhan Ramesh, T. V. Neumann, V. Misra, D. Vashaee, M. D. Dickey and M. C. Öztürk, Appl. Energy, 2020, 262, 114370 CrossRef CAS.
- M. Hyland, H. Hunter, J. Liu, E. Veety and D. Vashaee, Appl. Energy, 2016, 182, 518 CrossRef.
- H. Zhu, W. Li, A. Nozariasbmarz, N. Liu, Y. Zhang, S. Priya and B. Poudel, Nat. Commun., 2023, 14, 3300 CrossRef CAS PubMed.
- Y. Li, J. Li, J. Du, C. Zhang, X. Wang, Q. Xiang and C. Zhang, Nucl. Instrum. Methods Phys. Res., Sect. B, 2020, 479, 55 CrossRef CAS.
- J. Yang and T. Caillat, MRS Bull, 2006, 31, 224 CrossRef CAS.
- A. Witze, Nature, 2014, 515, 484 CrossRef CAS PubMed.
- K. Elphick, W. Frost, M. Samiepour, T. Kubota, K. Takanashi, H. Sukegawa, S. Mitani and A. Hirohata, Sci. Technol. Adv. Mater., 2021, 22, 235 CrossRef CAS PubMed.
- M. P. Ghimire, Sandeep, T. P. Sinha and R. K. Thapa, J. Alloys Compd., 2011, 509, 9742 CrossRef CAS.
- V. Ksenofontov, G. Melnyk, M. Wojcik, S. Wurmehl, K. Kroth, S. Reiman, P. Blaha and C. Felser, Phys. Rev. B: Condens. Matter Mater. Phys., 2006, 74, 134426 CrossRef.
- F. Casper, T. Graf, S. Chadov, B. Balke and C. Felser, Semicond. Sci. Technol., 2012, 27, 063001 CrossRef.
- H. Kleinke and C. Felser, J. Solid State Chem, 1999, 144, 330 CrossRef CAS.
- H. Kleinke and Z. Anorg Allg, Chem, 1998, 624, 1771 CAS.
- M. Zhou, L. Chen, C. Feng, D. Wang and J.-F. Li, J. Appl. Phys, 2007, 101, 113714 CrossRef.
- P. Qiu, X. Huang, X. Chen and L. Chen, J. Appl. Phys, 2009, 106, 103703 CrossRef.
- K. Xia, P. Nan, S. Tan, Y. Wang, B. Ge, W. Zhang, S. Anand, X. Zhao, G. J. Snyder and T. Zhu, Energy Environ. Sci., 2019, 12, 1568 RSC.
- T. Graf, C. Felser and S. S. P. Parkin, Prog. Solid. State Ch., 2011, 39, 1 CrossRef CAS.
- P. Paufler, Cryst. Res. Technol., 1987, 22, 1436 CrossRef.
- H. Joshi, D. P. Rai, A. Laref and R. K. Thapa, Mater. Res. Express, 2019, 6, 066307 CrossRef CAS.
- J. Tobola, J. Pierre, S. Kaprzyk, R. V. Skolozdra and M. A. Kouacou, J. Phys.: Condens. Matter, 1998, 10, 1013 CrossRef CAS.
- S. Öğüt and K. M. Rabe, Phys. Rev. B: Condens. Matter Mater. Phys., 1995, 51, 10443 CrossRef PubMed.
- J. Toboła and J. Pierre, J. Alloys Compd., 2000, 296, 243 CrossRef.
- S. Anand, K. Xia, V. I. Hegde, U. Aydemir, V. Kocevski, T. Zhu, C. Wolverton and G. J. Snyder, Energy Environ. Sci., 2018, 11, 1480 RSC.
- H. Beyer, J. Nurnus, H. Böttner, A. Lambrecht, E. Wagner and G. Bauer, Physica E Low Dimens. Syst. Nanostruct., 2002, 13, 965 CrossRef CAS.
- M. Tan, L. Hao, H. Li, C. Li, X. Liu, D. Yan, T. Yang and Y. Deng, Sci. Rep., 2020, 10, 5978 CrossRef CAS PubMed.
- V. K. Zaitsev, M. I. Fedorov, E. A. Gurieva, I. S. Eremin, P. P. Konstantinov, A. Y. Samunin and M. V. Vedernikov, Phys. Rev. B: Condens. Matter Mater. Phys., 2006, 74, 045207 CrossRef.
- M. Zhou, C. Feng, L. Chen and X. Huang, J. Alloys Compd., 2005, 391, 194 CrossRef CAS.
- M. Terada, K. Endo, Y. Fujita and R. Kimura, J. Phys. Soc. Jpn., 1972, 32, 91 CrossRef CAS.
- T. Sekimoto, K. Kurosaki, H. Muta and S. Yamanaka, J. Alloys Compd., 2006, 407, 326 CrossRef CAS.
- H. Joshi, D. P. Rai, L. Hnamte, A. Laref and R. K. Thapa, Heliyon, 2019, 5, e01155 CrossRef PubMed.
- S. Chen and Z. Ren, Mater. Today, 2013, 16, 387 CrossRef CAS.
- T. Wu, W. Jiang, X. Li, Y. Zhou and L. Chen, J. Appl. Phys, 2007, 102, 103705 CrossRef.
- Y. Stadnyk, Y. Gorelenko, A. Tkachuk, A. Goryn, V. Davydov and O. Bodak, J. Alloys Compd., 2001, 329, 37 CrossRef CAS.
- B. Dongre, J. Carrete, S. Wen, J. Ma, W. Li, N. Mingo and G. K. H. Madsen, J. Mater. Chem. A, 2020, 8, 1273 RSC.
- K. Xia, Y. Liu, S. Anand, G. J. Snyder, J. Xin, J. Yu, X. Zhao and T. Zhu, Adv. Funct. Mater., 2018, 28, 1705845 CrossRef.
- F. Aliev, N. Brandt, V. Kozyr’Kov, V. Moshchalkov, R. Skolozdra, Y. V. Stadnyk and V. Pecharskii, JETP Lett, 1987, 45, 684 Search PubMed.
- F. G. Aliev, N. B. Brandt, V. V. Moshchalkov, V. V. Kozyrkov, R. V. Skolozdra and A. I. Belogorokhov, Z. Phys. B: Condens. Matter, 1989, 75, 167 CrossRef CAS.
- P. Qiu, J. Yang, X. Huang, X. Chen and L. Chen, Appl. Phys. Lett, 2010, 96, 152105 CrossRef.
- L. Chen, X. Zeng, T. M. Tritt and S. J. Poon, J. Electron. Mater., 2016, 45, 5554 CrossRef CAS.
- Q. Wang, X. Xie, S. Li, Z. Zhang, X. Li, H. Yao, C. Chen, F. Cao, J. Sui and X. Liu, et al. , J. Materiomics, 2021, 7, 756 CrossRef.
- M. Asaad, J. Buckman and J.-W. G. Bos, Metals, 2018, 8, 935 CrossRef CAS.
- C. S. Birkel, W. G. Zeier, J. E. Douglas, B. R. Lettiere, C. E. Mills, G. Seward, A. Birkel, M. L. Snedaker, Y. Zhang and G. J. Snyder, et al. , Chem. Mater., 2012, 24, 2558 CrossRef CAS.
- S.-C. Ur, Korean J. Mater. Res., 2011, 21, 542 CAS.
- Y. Xia, V. Ponnambalam, S. Bhattacharya, A. L. Pope, S. J. Poon and T. M. Tritt, J. Phys.: Condens. Matter., 2001, 13, 77 CrossRef CAS.
- V. D. Mote, Y. Purushotham and B. N. Dole, J. Theor. Appl. Phys., 2012, 6, 6 CrossRef.
- S. Das, P. Singha, V. A. Kulbachinskii, V. G. Kytin, G. Das, S. Janaky, A. K. Deb, S. Mukherjee, A. Maignan and S. Hebert, et al. , J Materiomics, 2021, 7, 545 CrossRef.
- J. Rodríguez-Carvajal, Phys. B, 1993, 192, 55 CrossRef.
- S. Mahakal, D. Das, A. Jana, A. Banerjee and K. Malik, J. Phys. Conf. Ser., 2020, 012020 CrossRef CAS.
- W. H. Kettler, R. Wernhardt and M. Rosenberg, Rev. Sci. Instrum, 1986, 57, 3053 CrossRef CAS.
- S. Skipidarov and M. Nikitin, Thermoelectrics for Power Generation, IntechOpen, Rijeka, 2016 Search PubMed.
- G. Kresse and J. Furthmüller, Comput. Mater. Sci., 1996, 6, 15 CrossRef CAS.
- J. P. Perdew, K. Burke and M. Ernzerhof, Phys. Rev. Lett., 1996, 77, 3865 CrossRef CAS PubMed.
- P. E. Blöchl, Phys. Rev. B: Condens. Matter Mater. Phys., 1994, 50, 17953 CrossRef PubMed.
- P. J. Webster and K. R. A. Ziebeck, J. Phys. Chem. Solids, 1973, 34, 1647 CrossRef CAS.
- T. Sekimoto, K. Kurosaki, H. Muta and S. Yamanaka, J. Alloys Compd., 2005, 394, 122 CrossRef CAS.
- K. Momma and F. Izumi, J. Appl. Crystallogr., 2008, 41, 653 CrossRef CAS.
- D. Das, K. Malik, S. Das, P. Singha, A. K. Deb, V. A. Kulbachinskii, R. Basu, S. Dhara, A. Dasgupta and S. Bandyopadhyay, et al. , AIP Adv., 2018, 8, 125119 CrossRef.
- P. Fischer, I. Sosnowska and M. Szymanski, J. Phys. C: Solid State Phys, 1978, 11, 1043 CrossRef CAS.
- I. Skovsen, L. Bjerg, M. Christensen, E. Nishibori, B. Balke, C. Felser and B. B. Iversen, Dalton Trans, 2010, 39, 10154 RSC.
- T. Sekimoto, K. Kurosaki, H. Muta and S. Yamasaka, in ICT 2005. 24th International Conference on Thermoelectrics, 2005.2005), pp. 347.
- A. Vishwakarma, N. S. Chauhan, R. Bhardwaj, K. K. Johari, S. R. Dhakate, B. Gahtori and S. Bathula, Intermetallics, 2020, 125, 106914 CrossRef CAS.
- E. O. Hall, Proc. Phys. Soc. B, 1951, 64, 747 CrossRef.
- N. J. Petch, J. Iron Steel Res. Int., 1953, 174, 4 Search PubMed.
- S. Mahakal, D. Das, P. Singha, N. Rana, S. Mukherjee, A. Banerjee and K. Malik, J. Phys.: Conf. Ser., 2022, 2349, 012022 CrossRef.
- T. Ungár, S. Ott, P. G. Sanders, A. Borbély and J. R. Weertman, Acta Mater, 1998, 46, 3693 CrossRef.
- A. K. Verma, K. K. Johari, P. Dubey, D. K. Sharma, S. Kumar, S. R. Dhakate, C. Candolfi, B. Lenoir and B. Gahtori, ACS Appl. Mater. Interfaces, 2023, 15, 942 CrossRef CAS PubMed.
- F. Serrano-Sanchez, M. Yao, B. He, D. Chen, A. Gloskovskii, A. Fedorov, G. Auffermann, E. Liu, U. Burkhardt and G. H. Fecher, et al. , Nanoscale, 2022, 14, 10067 RSC.
- J. L. Baker, R. S. Kumar, C. Park, N. Velisavljevic and A. Cornelius, Intermetallics, 2018, 95, 137 CrossRef CAS.
- T. Wu, W. Jiang, X. Li, S. Bai, S. Liufu and L. Chen, J. Alloys Compd., 2009, 467, 590 CrossRef CAS.
- P. Singha, S. Das, V. A. Kulbachinskii, V. G. Kytin, A. S. Apreleva, D. J. Voneshen, T. Guidi, A. V. Powell, S. Chatterjee and A. K. Deb, et al. , J. Appl. Phys., 2021, 129, 055108 CrossRef CAS.
- J. Yang, D. T. Morelli, G. P. Meisner, W. Chen, J. S. Dyck and C. Uher, Phys. Rev. B: Condens. Matter Mater. Phys., 2003, 67, 165207 CrossRef.
- R. Moshwan, L. Yang, J. Zou and Z.-G. Chen, Adv. Funct. Mater., 2017, 27, 1703278 CrossRef.
- M. Cutler and N. F. Mott, Phys. Rev., 1969, 181, 1336 CrossRef CAS.
- W. Ding, J. Zeng, W. Qin, P. Cui and Z. Zhang, Phys. Rev. Lett., 2020, 124, 027002 CrossRef CAS.
- K. W. Böer and U. W. Pohl, in Semiconductor Physics, ed. K. W. Böer, and U. W. Pohl, Springer International Publishing, Cham, 2018, pp. 1053 Search PubMed.
- T. Leijtens, G. E. Eperon, A. J. Barker, G. Grancini, W. Zhang, J. M. Ball, A. R. S. Kandada, H. J. Snaith and A. Petrozza, Energy Environ. Sci., 2016, 9, 3472 RSC.
- M. M. Mallick and S. Vitta, J. Alloys Compd., 2017, 710, 191 CrossRef CAS.
- H.-S. Kim, Z. M. Gibbs, Y. Tang, H. Wang and G. J. Snyder, APL Mater., 2015, 3, 041506 CrossRef.
- G. A. Slack, Solid State Phys, 1979, 34, 1 CAS.
- A. V. Morozkin and V. N. Nikiforov, J. Alloys Compd., 2005, 400, 62 CrossRef CAS.
Footnote |
| † Electronic supplementary information (ESI) available. See DOI: https://doi.org/10.1039/d3ma00323j |
| This journal is © The Royal Society of Chemistry 2023 |

