 Open Access Article
Creative Commons Attribution 3.0 Unported Licence
Retracted Article: Influence of carbon additions on microstructures and mechanical properties in additive manufactured superalloys
Mingjun
Xie
 a,
Yan
Zhao
*a,
Jianjun
Guan
a,
Yanhong
Yang
*b and
Yuting
Fu
a
a,
Yan
Zhao
*a,
Jianjun
Guan
a,
Yanhong
Yang
*b and
Yuting
Fu
a
aSchool of Mechanical Engineering, Liaoning Petrochemical University, Fushun 113001, China. E-mail: zhaoyan@lnpu.edu.cn
bInstitute of Metal Research, Chinese Academy of Sciences, Shenyang 110016, China. E-mail: yhyang@imr.ac.cn
First published on 30th August 2023
Abstract
Combined with scanning electron microscopy, transmission electron microscopy, electron backscatter diffraction and mechanical properties, the effects of three different carbon contents on mechanical structure–properties of nickel superalloys fabricated by laser metal deposition (LMD) were studied. The grains exhibited a preferred orientation and strong texture along the {001} plane. Meanwhile, it was confirmed that C exists in the form of MC and M6C carbides in the C-containing alloys. Moreover, C addition reduced the residual stress but had little impact on microstructures. Additionally, the rupture life (760 °C/780 MPa) was remarkably improved as the C content was increased to 0.01 wt%. The improvement of stress rupture properties mainly contributed to the combined strengthening effect of MC and M23C6. However, with the excessive addition of C, the stress rupture properties were reduced significantly, as a high carbon content may cause stress concentration, making the material more prone to pore and crack formation under stress.
1. Introduction
Ni-based superalloys have garnered significant attention in the aerospace industry due to their exceptional strength and cost-effectiveness.1 Recently, the Institute of Metal Research, Chinese Academy of Science, has designed a novel alloy based on a second-generation superalloy by adding grain boundary strengthening elements C and B. The significance of trace element additions to the mechanical properties of Ni-based superalloys has been widely acknowledged in recent literature.2 Studies have reported that the inclusion of trace elements such as carbon and zirconium enhances the stress fracture properties of these superalloys.3 Reed discovered that by controlling the concentrations of elements that encourage the precipitation of the γ phase and incorporating grain boundary strengthening metalloids like carbon and boron,4 the solidification range can be restricted, thereby improving processability; however, this may adversely affect creep properties at elevated temperatures. Wei conducted a comprehensive investigation into the profound influence of carbon content on the microstructure and high-temperature tensile strength of the fine-grained CM-681LC superalloy.5 The research revealed that an increase in carbon content from 0.11 wt% to 0.15 wt% significantly augments the total area fraction of carbides, although the carbide shapes and sizes remain analogous between alloys containing 0.11 wt% and 0.15 wt% carbon content.The carbon content in superalloys not only influences the morphology, size, and distribution of carbides but also has a profound impact on their mechanical properties. Fine-grained carbides serve to obstruct grain boundary slip and dislocations, which are considered the primary contributors to the enhanced creep properties of alloys. Nevertheless, coarse or continuous carbides can be detrimental, as they are predisposed to becoming an initiation zone for cracks.6,7 The incorporation of trace elements has been associated with a range of potential strengthening mechanisms, such as decreasing grain boundary diffusivity,8–10 augmenting interfacial strength at grain boundaries,9 altering the morphology of γ′ precipitates or carbides,11,12 and sequestering impurity elements through precipitation into stable compounds.13 A recent investigation by Smith14 indicated that with increasing carbon content, the genesis and prevalence of MC carbides intensify, leading to a reduction in the grain boundary stabilizing δ phase and potentially affecting the strengthening γ′ and γ′′ phases. Furthermore, higher amounts of MC carbides resulting from increased carbon content resulted in reduced tensile strength.
Additive manufacturing is based on the traditional digital 3D model and generates 3D parts through the continuous superposition of forming materials and without molds.15 Among AM methods, laser metal deposition (LMD) is particularly notable for its use of high laser power and large laser beam size, resulting in remarkable build efficiency. LMD exhibits a high temperature gradient (105–107 K m−1) and a rapid cooling rate (103–105 K s−1), making it well-suited for fabricating nickel-based superalloy components with minimal element segregation.16 In recent years, numerous domestic and international studies have focused on the additive manufacturing of superalloys.16–18 However, superalloys with an (Al + Ti) content exceeding 4% pose challenges in weldability, often leading to extensive cracking during the AM process.19–21 In this study, we developed a novel alloy with an (Al + Ti) content of 8%. By optimizing the process parameters, we employed LMD technology to manufacture nickel-based superalloys. An in-depth comparative analysis was conducted to investigate the influence of the carbon content on the microstructure and mechanical performance, specifically tensile and rupture properties.
2. Materials and methods
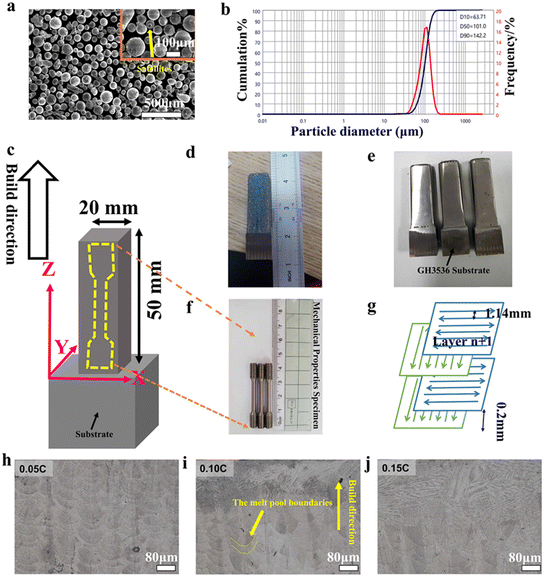
The Ni-based superalloy powder used for LMD additive manufacturing was synthesized by vacuum argon gas atomization. It combines the benefits of argon gas atomization with a vacuum environment to minimize contamination and oxidation. The process can produce high-quality metal powders with excellent properties, such as a narrow particle size distribution, high sphericity, and low oxygen content. The compositions of the powder are presented in Table 1, with carbon content ascertained using a CS-444LS carbon–sulfur measurement instrument and the remaining elements verified via an inductively coupled plasma atomic emission spectrometer (ICP-AES). The compositional data can be found in Table 1. As illustrated in Fig. 1a, the powder particles exhibit a predominantly spherical morphology, accompanied by satellite powder adhering to the surface. The particle size distribution spans from 80 to 150 μm, with a mean particle size of 101.0 μm, as depicted in Fig. 1b.| No. | C | Co | Mo | W | Al | Ti | Ta | Cr | B | Ni | |
|---|---|---|---|---|---|---|---|---|---|---|---|
| 1 0.05C | (Nominal) powder | 0.05 | 8 | 2 | 8 | 5.5 | 0.7 | 6 | 8 | 0.015 | Bal. |
| (Actual) powder | 0.05 | 7.98 | 2 | 7.99 | 5.4 | 0.7 | 6.05 | 7.95 | 0.015 | ||
| (Actual) after AM | 0.06 | 7.78 | 1.98 | 7.98 | 5.3 | 0.68 | 5.85 | 7.85 | 0.014 | ||
| 2 0.10C | (Nominal) powder | 0.10 | 8 | 2 | 8 | 5.5 | 0.7 | 6 | 8 | 0.015 | Bal. |
| (Actual) powder | 0.087 | 7.94 | 2.01 | 7.93 | 5.42 | 0.71 | 6.02 | 8.38 | 0.010 | ||
| (Actual) after AM | 0.098 | 7.85 | 1.95 | 7.90 | 5.50 | 0.75 | 6.01 | 8.28 | 0.012 | ||
| 3 0.15C | (Nominal) powder | 0.15 | 8 | 2 | 8 | 5.5 | 0.7 | 6 | 8 | 0.015 | Bal. |
| (Actual) powder | 0.14 | 8.03 | 2.02 | 7.98 | 5.47 | 0.72 | 6.06 | 7.99 | 0.011 | ||
| (Actual) after AM | 0.16 | 7.97 | 2.01 | 7.95 | 5.37 | 0.71 | 5.99 | 7.88 | 0.013 | ||
The LMD additive manufacturing procedure employed a laser deposition CNC machine tool, courtesy of the Institute of Metal Research, Chinese Academy of Sciences. The process parameters implemented included: a spot diameter of 2 mm, a hatch spacing of 1.14 mm, a layer thickness of 0.2 mm (Fig. 1g), an overlap rate of 43%, a laser power of 1700 W, a powder feed rate of 12 g min−1, a scan velocity of 1300 mm min−1, and a Z-axis increment of 20 μm (Fig. 1c). The chosen substrate comprised a cast polycrystalline GH3536 alloy (Fig. 1e), with its composition detailed in Table 2. The substrate was sectioned into 20 × 20 × 10 mm3 pieces using wire cutting. Subsequently, the oxide scale was removed by polishing with #50 sandpaper, followed by ultrasonic cleaning using 98% alcohol. It needs to be vacuumed and then inert argon protection before the AM process.
| Composition | Si | Mn | B | Cr | C | Mo | Co | Fe | W | Ni |
|---|---|---|---|---|---|---|---|---|---|---|
| 0.02 | 0.02 | 0.003 | 21.87 | 0.056 | 9.12 | 1.23 | 18.2 | 0.49 | Bal. |
Fig. 1(h–j) shows distinct “layer-to-layer” overlapping boundaries between various melt pools within the sample. Moreover, the melt pool boundaries in the microstructure exhibit a fish scale-like distribution. The close amalgamation of the melt pools ensures the continuity of the microstructure in the growth direction, with columnar crystals traversing multiple melt pool layers.
The melt pools’ shape resembles a quadratic curve, attributable to the Gaussian distribution of the laser beam energy. This distribution results in higher temperatures at the melt pool's center compared to its edges. As a consequence, the depth of remelting in the cladding layer's center is more significant than at the edges, giving rise to new melt pools. The heat accumulation during the forming process contributes to an increase in the sample's width as its thickness escalates.
To attain a pristine surface amenable to SEM examination, all specimens underwent sequential planarization using SiC paper grits ranging from #150–#2000, followed by a meticulous polish with M2.5 colloidal silica polishing paste. Representative transverse and longitudinal cross-sections of the LMD specimens, oriented perpendicular and parallel to the build direction (Z), respectively, were prepared for microstructural scrutiny. Furthermore, to facilitate characterization, the AM samples were etched with a solution consisting of 5 g CuSO4, 25 mL HCl, and 50 mL H2O.
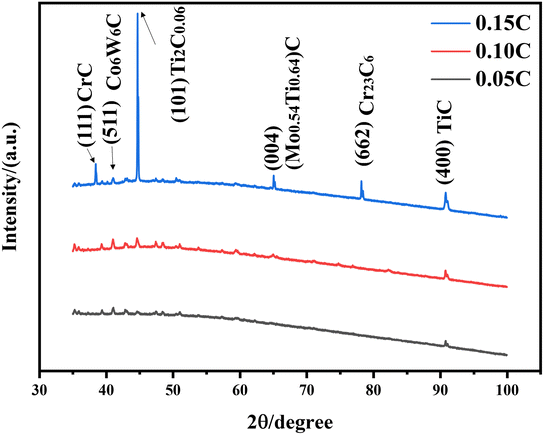
The microstructure of the samples shown in Fig. 1(d and e) were captured employing scanning electron microscopy (SEM, EBSD) using a MIRA4 microscope. SEM images were subsequently analyzed using ImageJ software, while EBSD micrographs were acquired at an operating voltage of 20 kV and a step size of 2.5 μm. The inverse pole figure (IPF) and kernel average misorientation (KAM) information, extracted from Channel 5 software, were subjected to further analysis. To confirm the type of carbides, XRD measurements were performed, using a SmartLab X-ray diffractometer manufactured in Japan, operating with Cu-Kα radiation (λ = 1.5418 Å), 40 kV and 30 mA. The scanning range and step size were 35–100° 2θ and 0.01° 2θ, respectively. Fig. 2 compares the XRD patterns of the AM sample. The diffraction peak can confirm the existence of MC type, M6C type, and M23C6 type carbides in the Ni-superalloy.
The microstructure of the AM samples and properties of specimens were meticulously investigated using transmission electron microscopy (TEM F20). The electropolishing solution comprised 10 vol% HClO4 in absolute alcohol, sustained at −20 °C.
As delineated in Fig. 1(f), the tensile and rupture specimens were procured from the additively manufactured specimen, incorporating three parallel specimens per group. Room temperature tensile evaluations were executed utilizing a TSE504D tensile instrument at 27 °C, with strain rates of 0.3 min−1 and 2.3 min−1 designated before and after the yield, respectively. Tensile assessments at 760 °C were performed employing an AG-X 250kN tensile instrument, establishing strain rates of 0.1 min−1 and 1.6 min−1 prior to and subsequent to the yield point. The rupture experiments were conducted on an RDL50 constant load high-temperature creep-testing instrument under loading conditions of 760 °C/780 MPa and 980 °C/260 MPa.
3. Results
3.1 Characteristics of the microstructure
Fig. 3 presents the dendritic morphologies observed in the cross-section of three specimens with different carbon contents. In all three cases, the dendrite structures displayed a refined and homogenous cruciform pattern,22,23 which can be ascribed to the pronounced undercooling and accelerated solidification rates characteristic of additive manufacturing techniques. Moreover, the secondary dendrite structure was not well-developed. The primary cause for this phenomenon is the rapid solidification rate associated with additive manufacturing processes, which constrains the time available for dendritic growth.The primary dendrite spacing for the samples with 0.05C, 0.10C, and 0.15C carbon content was counted, and the calculation formula for the primary dendrite spacing is as follows:
Fig. 3 displays the influence of carbon additions on primary dendrite arm spacing, with a summary provided in Table 3. It reveals that the primary dendrite spacing for the three alloys examined is approximately 28 μm. Both Fig. 3 and Table 3 indicate that the incorporation of carbon does not produce a notable impact on the dendrite structure or the interdendritic spacing.
| Alloy | 0.05C | 0.10C | 0.15C |
|---|---|---|---|
| PDS/μm | 27.8 | 28.1 | 28.3 |
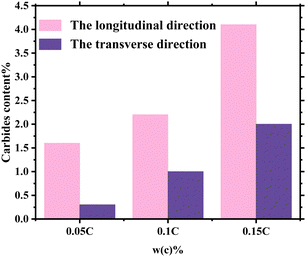
Fig. 4(a–f) present the micrographs of carbides with varying carbon contents in which the carbides manifest as bright white features. Carbides are predominantly distributed at grain boundaries, with a lesser presence in interdendritic regions. Statistical analysis shows (Fig. 5) that the carbide content increases significantly as the carbon content rises. Furthermore, the longitudinal section exhibits a higher quantity of carbides compared to the transverse section. This can be attributed to the fact that carbides tend to precipitate at grain boundaries, and the laser deposition process results in the formation of columnar crystals. These crystals possess extended grain boundaries in the longitudinal section relative to the transverse section, thereby leading to an increased precipitation of carbides.
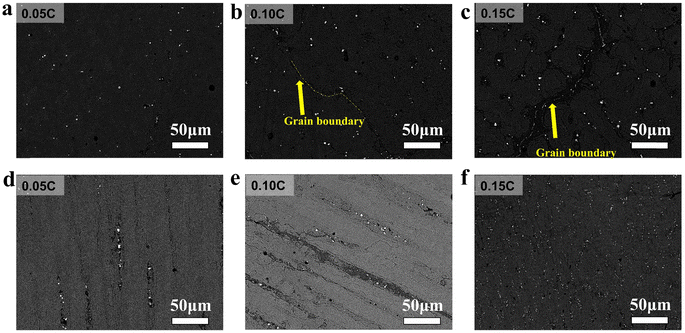 | ||
| Fig. 4 BSE SEM micrograph of carbides with different carbon contents. The transverse direction: (a) 0.05C, (b) 0.10C, and (c) 0.15C; the longitudinal direction: (d) 0.05C, (e) 0.10C, and (f) 0.15C. | ||
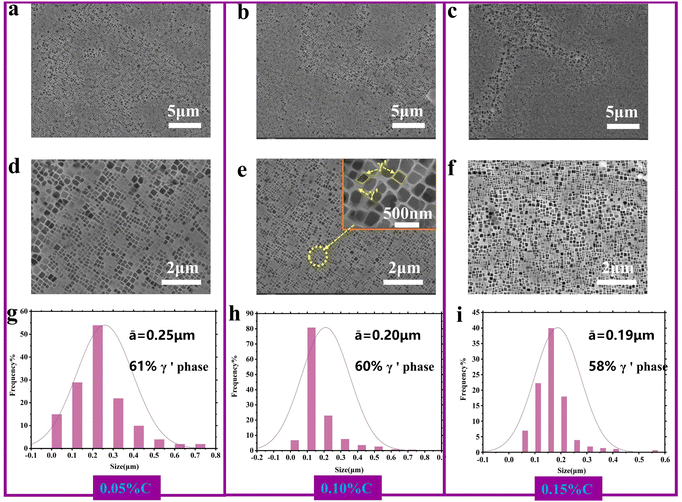
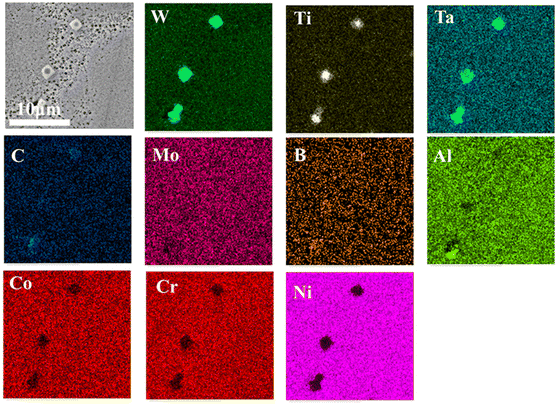
Fig. 6 presents the morphology of the γ′ phase in different alloys, with the γ′ phase being uniformly dispersed throughout the crystal lattice. The size and volume fraction of the γ′ phase were evaluated statistically using IPP software, revealing a decrease in both parameters as the carbon content increases, as illustrated in Fig. 6(g–i). The γ′ phase is characterized by irregularly shaped cubic features with a consistent size of approximately 0.2 μm, along with the presence of a singular plate-like structure resulting from the constricted matrix channel. The elevation in carbon content diminishes the concentrations of elements such as Ti and Ta originally present in the matrix, subsequently forming carbides like MC and M6C and reducing the precipitation of the γ′ phase. Nonetheless, the overall influence of carbon on the size and morphology of the γ′ phase remains minimal.
Carbides in alloys have been identified as primary MC (M represents Ti and Ta) type and M6C (M represents W and Mo) type carbides, as illustrated by the TEM microstructure in Fig. 7. Conversely, M23C6 (M is Cr) type carbides are virtually non-existent. Although M23C6 is the most stable, the transformation process of MC decomposing into M23C6 necessitates an extended duration and elevated temperature.24 Simultaneously, MC and M6C carbides may not exist independently; as depicted in Fig. 8 and 9, the peripheries of MC carbide undergo decomposition into uniformly bright M6C carbide. The orientation relationship between M6C and the matrix is as follows: {001}M6C//{001} matrix; 〈001〉 M6C//〈001〉 matrix. MC carbide exhibits instability at high temperatures and interacts with the matrix, resulting in minor decomposition into M6C carbide. In contrast, M6C as a secondary carbide, can hinder dislocation motion and strengthen the matrix.
 | ||
| Fig. 7 TEM microstructure with 0.15% C content: (a) MC carbide and (b) selected area diffraction pattern of MC. | ||
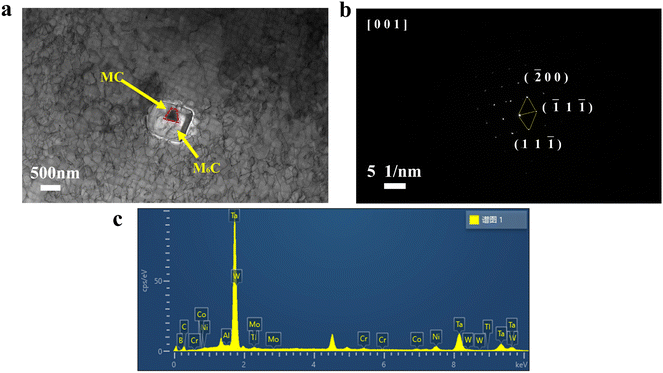 | ||
| Fig. 8 TEM microstructure with 0.15% C content: (a) M6C carbide and MC carbide. (b) Selected area diffraction pattern of M6C; (c) EDS spectra. | ||
The carbides in the alloys are rich in elements such as W, Ta, and Ti. These elements exhibit varying concentration gradients within the multilayered MC/M6C structure. The carbon concentration in MC carbide surpasses that in the γ matrix,25 leading to a predominant diffusion of carbon from MC to γ. Conversely, due to the reduced diffusion rate,26,27 elements such as W and Mo in the γ matrix can only extend to the periphery of MC, culminating in the formation of a minor quantity of M6C within the MC carbide and W element in the γ matrix at the edge of MC carbide.
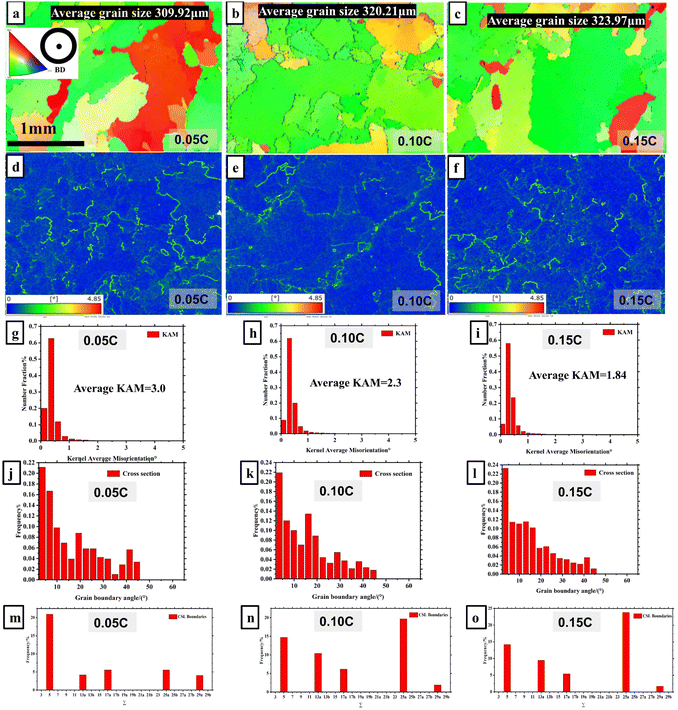
Electron backscatter diffraction (EBSD) analysis of alloys with varying carbon content is presented in Fig. 10(a)–(c). The color variations in the images denote grain orientations, where similar colors correspond to reduced dislocation densities. High plastic deformation is represented by red, while green signifies minimal deformation. The EBSD image's normal direction aligns with the building direction (BD), revealing a dominant {100} texture in the grains. A majority of these grains exhibit preferential solidification along the 〈001〉 direction, which is associated with the building direction. The mean grain sizes for the three samples are as follows: 309.92 μm (0.05C), 320.21 μm (0.10C), and 323.97 μm (0.15C). This observation suggests that incorporating carbon results in a marginal increase in the grain size.
The presence of a moving heat source induces localized heating and subsequent rapid cooling in the additively manufactured sample, consequently generating residual stress due to the high temperature gradients. The kernel average misorientation (KAM) map serves as an indicator of residual stress, with stress concentration intensifying as the color transitions from cool to warm (Fig. 10(d)–(f)). Residual stress predominantly accumulates at grain boundaries, as demonstrated by the average KAM results shown in Fig. 10(g)–(i). In comparison to samples with 0.10% and 0.15% carbon content, the low-carbon KAM value is 3.0, which can be ascribed to carbide precipitation and transformation processes that consume a portion of the internal energy and subsequently reduce residual stress.
The formation of carbides at grain boundaries can potentially modify the properties and orientation differences of these boundaries. As demonstrated in Fig. 10(j)–(l), the distribution of grain boundary shows slight misorientation among samples with different carbon contents. In the laser metal deposition (LMD) process, characterized by rapid melting and solidification, the sub-grain structure can be easily formed, thereby increasing the proportion of low-angle grain boundaries (LAGBs) with dislocation angles <10°. LAGBs exhibit lower energy in comparison to high-angle grain boundaries (HAGBs), resulting in enhanced stability within alloys. This result also shows that close grain orientation could contribute to increased yield strength and tensile strength, as grain boundary strength is generally inferior to that within the grain itself. Smaller angular differences between grains may improve grain boundary strength, ultimately leading to enhanced overall mechanical properties.
Fig. 10(j) (0.05C) shows the highest proportion of grain boundary angle <15°. Carbon segregation around grain boundaries can impact their stability within alloys. A decrease in the carbon content may weaken carbon segregation near grain boundaries, resulting in marginally higher LAGB proportions. HAGBs, with orientation differences >15°, are characterized by loose atomic arrangements and bonding due to the substantial orientation disparities between grains. As a result, HAGBs are prone to serve as preferential sites for crack initiation and propagation under stress. This evidence implies that an increase in carbon content could promote crack formation, thereby altering the mechanical properties of LMD samples.
Fig. 10(m)–(o) show the distribution of low-Σ (3 ≤ Σ ≤ 29) coincidence site lattice (CSL) grain boundary characteristics for three different carbon content samples. In the 0.05C sample, as illustrated in Fig. 9(m), the proportion of Σ5 boundaries is the largest, and this proportion decreases with increasing carbon content, as seen in Fig. 10(n) and (o). High-Σ CSL grain boundaries typically have higher grain boundary energies. When the carbon content is higher, the grain boundary energy may have a more significant impact on grain growth and grain boundary formation. Consequently, in this situation, the formation of high-energy CSL grain boundaries (such as Σ25a boundaries) may be comparatively more prevalent.
Carbides require rapid diffusion of elements such as C and Cr at grain boundaries, and the higher the Σ value of the boundary, the higher the segregation level of carbide-forming elements.28 As a result, a higher supply of carbide-forming elements is preferentially provided to neighboring Σ5 boundaries. The 0.15C sample contains more carbides, thus requiring a higher segregation level to promote carbide nucleation and growth on Σ5 boundaries. As mentioned earlier, the 0.15C sample exhibits the largest grain size. Grain growth reduces the total grain boundary area and decreases the overall grain boundary energy. Therefore, the 0.15C sample contains the least amount of low-Σ5 boundaries.
3.2 Effect of C on rupture properties
The tensile tests were conducted at 760 °C and room temperature as illustrated in Fig. 11(a) and (b), from which it can be seen that the alloy exhibits high tensile strength and significant elongation under elevated stress. The characteristic anomalous yield behavior of the superalloys is also observed at 760 °C, but the impact of carbon on tensile properties appears to be minimal, as indicated in Table 4. Notably, the performance of the AM samples approaches that of traditional second-generation single-crystal superalloys,27–33 represented by the yellow sphere in Fig. 10(c), which shows the superiority of AM properties. The tensile strength and deposition direction of the AM samples surpassesx those of castings in the deposition direction, which can be attributed to the more robust cubic texture they exhibit in the same direction. | ||
| Fig. 11 Engineering stress–strain curves of three alloys with different carbon contents (yield strength YS; elongation UE; tensile strength UTS) (a) 760 °C high temperature tensile; (b) room temperature tensile; and (c) summary of tensile strength vs uniform elongation at 760 °C of second-generation superalloys.29–35 | ||
| Temperature | Alloy/wt% | R p0.2/MPa | R m/MPa | A/% | Z/% |
|---|---|---|---|---|---|
| 27 °C | 0.05%C | 1066 ± 36.5 | 1181 ± 50.5 | 10.5 ± 2 | 10 ± 0.5 |
| 0.10%C | 1055 ± 42.5 | 1115 ± 33.5 | 7.5 ± 3 | 8 ± 1.5 | |
| 0.15%C | 1003 ± 28.5 | 1066 ± 36 | 6.5 ± 2 | 13 ± 2 | |
| 760 °C | 0.05%C | 995 ± 28.5 | 1232 ± 26.5 | 20.0 ± 0 | 16 ± 0.5 |
| 0.10%C | 1038 ± 25.5 | 1297 ± 31 | 13.5 ± 3 | 14 ± 2 | |
| 0.15%C | 993 ± 34.5 | 1189 ± 21.5 | 16.5 ± 3 | 10 ± 0.5 | |
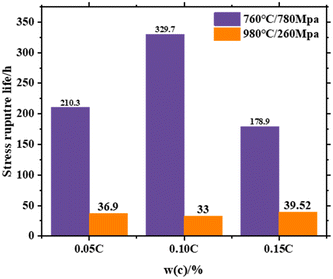
The stress rupture properties of the experimental alloys at 760 °C/780 MPa and 980 °C/260 MPa are shown in Fig. 12 and detailed in Table 5. At 760 °C/780 MPa, the carbon content plays a crucial role in the rupture property. The 0.10C alloy demonstrates superior rupture life, reaching 329.7 h, which is approximately twice the lifespan of the 0.15C alloy. In contrast, the elongation of the alloys is negligibly affected by carbon content.
| Alloy (%) | 760 °C/780 Mpa | 980 °C/260 Mpa | ||
|---|---|---|---|---|
| Stress rupture life (h) | Elongation (%) | Stress rupture life (h) | Elongation (%) | |
| 0.05 | 210.3 | 18.8 | 36.9 | 15 |
| 0.10 | 329.7 | 15.4 | 33 | 19 |
| 0.15 | 178.9 | 19.0 | 39.52 | 22 |
The rupture life of the samples exhibits a marked decline at 980 °C/260 MPa, with carbon having a minimal impact on the rupture property. The rupture life of the three alloys displays remarkable similarity, with the highest value being a mere 39.52 h. Furthermore, the variation in carbon content exerts little influence on alloys’ elongation.
The results indicated that C addition has a substantial effect on the stress rupture properties, and the optimum C content in the experimental alloy was 0.1 wt% based on the comprehensive consideration.
Fig. 13 (a–c) show the fracture surfaces of the three experimental alloys after stress rupture tests at 760 °C/780 Mpa. The cracks propagated along grain boundaries, and the fracture mode was dominated by intergranular failure. On the edge of the fracture surface, there are some small planes that form a certain angle with the loading stress direction. This is the fracture surface created by the alloy in the late stage of rupture due to slip. Meanwhile, more dimples are observed in the fracture surface of the 0.05C and 0.10C alloy samples (Fig. 12(d) and (e)), which are beneficial for stress rupture ductility. Conversely, a considerable quantity of cavities formed in the interdendritic regions of the 0.15C alloy (Fig. 13(f)), leading to a detrimental impact on the stress rupture properties.
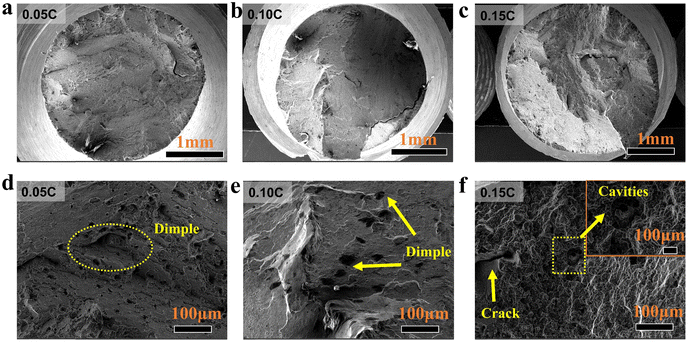 | ||
| Fig. 13 Fracture surfaces of the three experimental alloys after stress rupture tests at 760 °C/780 Mpa: (a) and (d) 0.05C alloy; (b) and (e) 0.10C alloy; and (c) and (f) 0.15C alloy. | ||
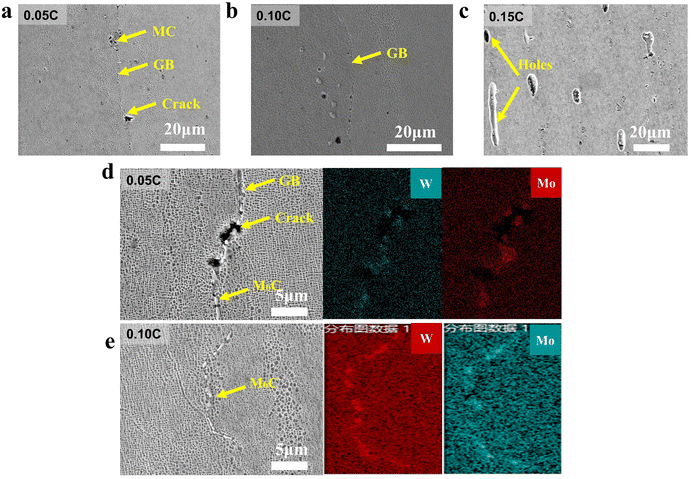
The SEM morphologies of the longitudinal section near the fracture are shown in Fig. 14 (760 °C/780 MPa). For both 0.05% C (Fig. 14a) and 0.10% C (Fig. 14b) compositions, the initiation site for crack formation in the alloy predominantly occurs at grain boundaries during rupture deformation, which is observed in both cases. The subsequent crack propagation is observed along carbide edges, highlighting grain boundaries as areas of weakness. At elevated temperatures, the sliding and migration of grain boundaries facilitate the movement of large dislocations towards these boundaries, thereby reducing entanglement. As a result, grain boundaries emerge as regions susceptible to crack initiation. Intriguingly, Fig. 14(c) reveals that the 0.15% C composition possesses numerous internal pores, leading to the shortest rupture life of 178.9 h. A key factor in creep damage of superalloys is the presence of micropores extending from the interdendritic region to the crack. Notably, 0.10% C and 0.05% C alloys demonstrate a significant reduction in pore density. This phenomenon might be ascribed to the formation of MC carbides during solidification in laser additive manufacturing, which compensates for microscopic shrinkage36 and subsequently reduces pores. Consequently, this mechanism contributes to the enhancement of high-temperature, high-stress rupture properties of superalloys.
Fig. 15(a–f) show the fracture surfaces of the three experimental alloys after stress rupture tests at 980 °C/260 MPa. Observations from the specimen reveal cleavage planes and cleavage steps, indicative of typical cleavage fractures.
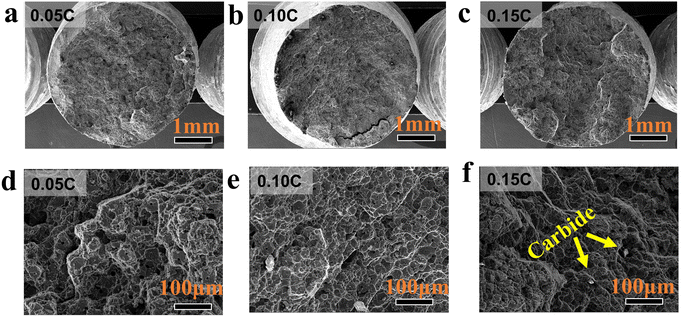 | ||
| Fig. 15 Fracture surfaces of the three experimental alloys after stress rupture tests at 980 °C/260 Mpa: (a) and (d) 0.05C alloy; (b) and (e) 0.10C alloy; and (c) and (f) 0.15C alloy. | ||
There are many bright carbides at the fracture surface Fig. 15(f). At 980 °C/260 MPa leads to the rafting of γ′ (Fig. 16(a–c)). Typically, the direction of the applied force is perpendicular to the rafting direction, as depicted in Fig. 15. Owing to a lower temperature (760 °C) during atomic diffusion, the alloy does not possess adequate thermodynamic driving force for directional coarsening. Conversely, at temperatures above 980 °C, atomic diffusion accelerates, and the elevated uniaxial stress creates a conducive environment for the directional diffusion of atoms. As a result, with increasing temperature, the growth of the γ′ phase and raft formation is expedited. In the necking region, the orientation of γ-shaped rafts deviates from the perpendicular to the tensile load axis, inclining towards it instead. This alteration is associated with the deformation process. Throughout high-temperature rupture, lattice rotation occurs around the tensile load axis, as the two extremities of the specimen remain fixed, inhibiting axial rotation. Additionally, the progressive reduction in the specimen's cross-sectional area within the necking region gives rise to multi-axial stress, further stimulating lattice rotation. Consequently, the lattice rotation concurrently induces the rotation of γ′.
 | ||
| Fig. 16 The longitudinal section microstructures of the stress rupture samples at 980 °C/260 Mpa: (a) 0.05C alloy; (b) 0.10C alloy; and (c) 0.15C alloy. | ||
4. Discussion
4.1 The effect of the C content at 760 °C/780 MPa
Microcracks are predominantly observed in the vicinity of the substantial needle-like M6C carbides, as evidenced in low-carbon (0.05%C) and medium-carbon (0.10%C) alloys shown in Fig. 14(d) and (e), rather than in massive MC. Consequently, M6C carbides at 760 °C/780 MPa negatively impact the rupture life. Although MC-type carbides, secondary M6C, and nanoscale M23C6 carbides can strengthen alloys by impeding dislocation movement, their inherent brittleness and weak bonding with the matrix may result in crack initiation, significantly affecting rupture. Carbide-assisted dislocation locking is shown in Fig. 17(a), where a dislocation network envelops the precipitates and numerous dislocations accumulate in the γ channel. The selected area diffraction pattern indicates the stability of MC carbides during rupture deformation. Greater carbide content impedes the dislocation movement, increasing the propensity to form dislocation networks.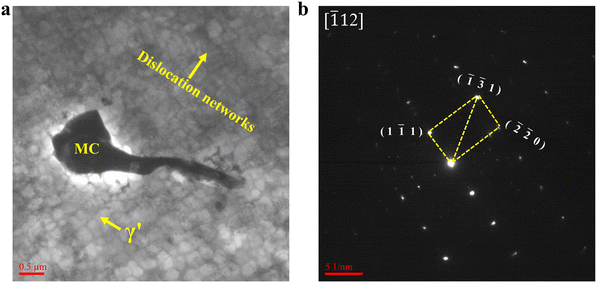 | ||
| Fig. 17 TEM image of MC carbide precipitated during the rupture with 0.10%C, (a) microstructure, (b) diffraction spot. | ||
As illustrated in Fig. 18, M23C6 carbides gradually form under sustained high temperatures, exhibiting a strong nucleation tendency on dislocations in the γ-matrix channels. These carbides possess a complex cubic structure and exhibit a crystallographic relationship with the matrix, such as the {001}M23C6//{001} matrix. M23C6 carbides are abundant in high Cr content alloys and originate from the decomposition of MC carbides and soluble carbon residues in the alloy matrix during the long-term service or heat treatment (760–980 °C). Discrete M23C6 particles formed in the γ channel under medium-carbon conditions hinder the dislocation movement via dislocation entanglement and locking, thus enhancing rupture properties. However, M23C6 also precipitates solid solution strengthening elements from the matrix, potentially affecting mechanical properties. Consequently, M23C6 exhibits both strengthening and weakening effects. From a rupture property perspective, the M23C6 strengthening effect is dominant, and the combined strengthening effect of MC and M23C6 contributes to an improved rupture life. The initial MC carbides in 0.05C alloys exhibit weak dispersion strengthening, resulting in a slightly lower rupture life than that of 0.10C alloys. A large number of internal pores can be observed in the 0.15C alloy, resulting in the worst rupture life.37,38 According to reports,39,40 an important form of creep damage in high-temperature alloys is the presence of pre-existing micropores in the interdendritic regions, where cracks will subsequently nucleate.
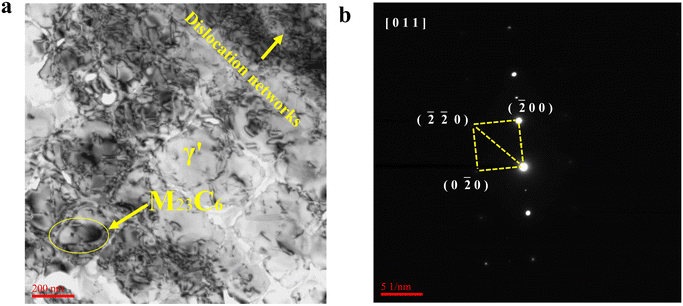 | ||
| Fig. 18 TEM image of the M23C6 carbide precipitated during the rupture with 0.10%C, (a) microstructure, (b) diffraction spot. | ||
4.2 The effect of the C content at 980 °C/260 MPa
At 980 °C/260 MPa leads to the rafting of γ′ (Fig. 16(a–c)). At a high temperature of 980 °C, it has been observed that the majority of MC carbides decompose into needle-like M6C carbides, as illustrated in Fig. 16(a and b), which evidently contribute to the strengthening of grain boundaries. Nevertheless, the deformation mechanism exhibits a pronounced temperature dependence. Evidently, typical dislocation configurations change at varying testing temperatures. At a lower temperature of 760 °C, precipitates are sheared by dislocation pairs or stacking faults, with this predominant deformation mechanism contributing to the alloy's enhanced longevity. Conversely, at 980 °C, stacking fault morphology evolves with temperature, terminating within γ′ precipitates and leading to the formation of isolated dislocations and dislocation loops in γ′. Above 980 °C, the emergence of γ/γ′ interfacial networks provides a certain level of resistance to glide dislocations traversing the γ matrix, with thermally activated climb accounting for the diminished durability under these conditions. While grain boundaries continue to be reinforced by MC and M6C carbides, interfacial dislocation networks formed through interactions between dislocations with distinct Burgers vectors at elevated temperatures facilitate dislocation climb, thereby attenuating the strengthening efficacy of carbides.5. Conclusions
In the present investigation, we have successfully fabricated a novel Ni-based superalloy using additive manufacturing techniques and assessed the ramifications of carbon content on the rupture life and mechanical attributes using an optimized synthesis protocol. The salient findings of this endeavor can be succinctly delineated as follows:1. C addition altered the grain boundary characteristics. The carbon content had a little effect on the γ′ phase and the dendritic structure of the additively manufactured superalloy. The carbides in samples were confirmed to be primary MC type and M6C type carbides, while M23C6 type carbides were found to be rare. The precipitation of carbides consumed internal energy, resulting in a reduction of residual stress with the addition of carbon.
2. The carbon content had a significant effect on the morphology, size, and fraction of carbides, with the number of carbides increasing as the carbon content increased.
3. The rupture tests conducted at 760 °C/780 MPa revealed that the grain boundary strengthening effect is significant when an appropriate amount of carbon (0.10 wt%) is added to the alloy, resulting in the strengthening effect of MC and M23C6. In contrast, excessively high temperatures at 980 °C/260 MPa cause matrix softening, diminishing the strengthening effect of carbides. The mechanical property test results showed that the addition of carbon has little effect on it.
Acronyms
| AM | Additive manufactured |
| CSL | Coincidence site lattice |
| EBSD | Electron backscatter diffraction |
| EDS | Energy dispersive X-ray spectrometer |
| ICP-AES | Inductively coupled plasma atomic emission spectrometer |
| IPF | Inverse pole figure |
| KAM | Kernel average misorientation |
| LMD | Laser metal deposition |
| OM | Optical microscopy |
| SEM | Scanning electron microscopy |
| TEM | Transmission electron microscopy |
| XRD | X-Ray diffraction |
Conflicts of interest
We declare that we have no financial and personal relationships with other people or organizations that can inappropriately influence our work, and there is no professional or other personal interest of any nature or kind in any product, service and/or company that could be construed as influencing the position presented in, or the review of, the manuscript entitled.Acknowledgements
This work was supported by the National Key R&D Program of China under Grant (2021YFB3700400) and the National Science and Technology Major Project (Y2019-VII-0011-0151) and the Basic Scientific Research Projects of Colleges and Universities of Liaoning Provincial Department of Education (LJKMZ20220753).Notes and references
- G. M. Han, Z. X. Zhang, J. G. Li, T. Jin, X. F. Sun and Z. Q. Hu, High cycle fatigue behavior of a nickel-based single crystal superalloy DD98M at 900 °C, Acta Metall. Sin., 2012, 48, 170–175 CrossRef CAS . https://www.ams.org.cn/CN/10.3724/SP.J.1037.2011.00433.
- H. Zhang and Z. Fang, Design and Synthesis of Novel Vitamin D-Coumarin Hybrids using Microwave Irradiation, J. Chem. Res., 2017, 41, 684–687, DOI:10.3184/174751917X15121208772534.
- M. Mostafaei and S. M. Abbasi, Influence of Zr content on the incipient melting behavior and stress-rupture life of CM247 LC nickel base superalloy, J. Alloys Compd., 2015, 648, 1031–1037, DOI:10.1016/j.jallcom.2015.07.104.
- Y. T. Tang, C. Panwisawas, J. N. Ghoussoub, Y. Gong, J. W. G. Clark, A. A. N. Németh, D. G. McCartney and R. C. Reed, Alloys-by-design: Application to new superalloys for additive manufacturing, Acta Mater., 2021, 202, 417–436, DOI:10.1016/j.actamat.2020.09.023.
- C. N. Wei, H.-Y. Bor and L. Chang, The effects of carbon content on the microstructure and elevated temperature tensile strength of a nickel-base superalloy, Mater. Sci. Eng., A., 2010, 527(16–17), 3741–3747, DOI:10.1016/j.msea.2010.03.053.
- P. J. Zhou, J. J. Yu, X. F. Sun, H. R. Guan and Z. Q. Hu, Role of yttrium in the microstructure and mechanical properties of a boron-modified nickel-based superalloy, Scr. Mater., 2007, 57, 643–646, DOI:10.1016/j.scriptamat.2007.06.003.
- B. J. Gill, Source book on materials for elevated temperature applications: American Society for Metals (1979) $35.00, Int. J. Fatigue, 1980, 2, 187–188, DOI:10.1016/0142-1123(80)90050-X.
- J. X. Yang, Q. Zheng, M. Q. Ji, X. F. Sun and Z. Q. Hu, Effects of different C contents on the microstructure, tensile properties and stress-rupture properties of IN792 alloy, Mater. Sci. Eng., A, 2011, 528, 1534–1539, DOI:10.1016/j.msea.2010.11.003.
- J. Chen, Y. H. Zhang and T. C. Zhou, A theoretical calculation of the collision cross section and rate coefficient for the hyperfine transitions of collisions between interstellar ortho-NH3 and He molecules, Chin. J. Astron. Astrophys., 1998, 22, 113–117, DOI:10.1016/S0275-1062(98)00016-2.
- Z. J. Liu, X. S. Zhao and C. G. Zhou, Improved hot corrosion resistance of Y-Ce-Co-modified aluminide coating on nickel base superalloys by pack cementation process, Corros. Sci., 2015, 92, 148–154, DOI:10.1016/j.corsci.2014.11.043.
- Y. L. Tsai, S. F. Wang, H. Y. Bor and Y. F. Hsu, Effects of Zr addition on the microstructure and mechanical behavior of a fine-grained nickel-based superalloy at elevated temperatures, Mater. Sci. Eng., A, 2014, 607, 294–301, DOI:10.1016/j.msea.2014.03.136.
- M. Burke, J. Greggi Jr and G. Whitlow, The effect of boron and carbon on the microstructural chemistries of two wrought nickel base superalloys, Scr. Metall., 1984, 18, 91–94, DOI:10.1016/0036-9748(84)90096-6.
- H. Merrick, The low cycle fatigue of three wrought nickel-base alloys, Metall. Mater. Trans. B, 1974, 5, 891–897, DOI:10.1007/BF02643144.
- T. M. Smith, T. P. Gabb, C. A. Kantzos, A. C. Thompson, C. K. Sudbrack, B. West, D. L. Ellis and C. L. Bowman, The effect of composition on microstructure and properties for additively manufactured superalloy 718, J. Alloys Compd., 2021, 873, 159789, DOI:10.1016/j.jallcom.2021.159789.
- R. Sitek, R. Molak, J. Zdunek, P. Bazarnik, P. Wisniewski, K. Kubiak and J. Mizera, Influence of an aluminizing process on the microstructure and tensile strength of the nickel superalloy IN 718 produced by the Selective Laser Melting, Vacuum, 2021, 186, DOI:10.1016/j.vacuum.2020.110041.
- M. Gäumann, C. Bezencon, P. Canalis and W. Kurz, Single-crystal laser deposition of superalloys: processing–microstructure maps, Acta Mater., 2001, 49, 1051–1062, DOI:10.1016/S1359-6454(00)00367-0.
- A. Xue, X. Lin, L. Wang, X. Lu, H. Ding and W. Huang, Heat-affected coarsening of β grain in titanium alloy during laser directed energy deposition, Scr. Mater., 2021, 205, 114180–114184, DOI:10.1016/j.scriptamat.2021.114180.
- S. Wen, C. Yan, Q. Wei, L. Zhang, X. Zhao, W. Zhu and Y. Shi, Investigation and development of large-scale equipment and high performance materials for powder bed laser fusion additive manufacturing, Virtual Phys. Prototy., 2014, 9, 213–223, DOI:10.1080/17452759.2014.949406.
- J. C. Lippold, S. D. Kiser and J. N. DuPont, Welding metallurgy and weldability of nickel-base alloys, John Wiley & Sons. 2011 Search PubMed.
- R. Acharya, R. Bansal, J. J. Gambone and S. Das, A Coupled Thermal, Fluid Flow, and Solidification Model for the Processing of Single-Crystal Alloy CMSX-4 Through Scanning Laser Epitaxy for Turbine Engine Hot-Section Component Repair (Part I), Metall. Mater. Trans. B, 2014, 45, 2247–2261, DOI:10.1007/s11663-014-0117-9.
- L. Wang, X. G. Fan, M. Zhan, X. Q. Jiang, X. Zeng, Y. F. Liang, H. J. Zheng and A. M. Zhao, The heterogeneous globularization related to crystal and geometrical orientation of two-phase titanium alloys with a colony microstructure, Mater. Des., 2020, 186, 108338–108349, DOI:10.1016/j.matdes.2019.108338.
- H. Wang, Y. An and X. Xu, et al., Rapid solidification microstructure evolution and grain refinement of deeply undercooled nickel alloys, Mater. Characterization, 2020, 170(6), 110703, DOI:10.1016/j.matchar.2020.110703.
- P. Zichao, X. Faqin and Z. Jun, et al., Effect of Undercooling on Microstructure Evolution in IN718 Superalloy, Rare Met. Mater. Eng., 2013, 42(10), 1988–1992, DOI:10.1016/S1875-5372(14)60012-6.
- X. Qin, J. Guo, C. Yuan, C. Chen, J. Hou and H. Ye, Decomposition of primary MC carbide and its effects on the fracture behaviors of a cast Ni-base superalloy, Mater. Sci. Eng., A, 2008, 485, 74–79, DOI:10.1016/j.msea.2007.07.055.
- V. Shankar, K. B. S. Rao and S. Mannan, Microstructure and mechanical properties of Inconel 625 superalloy, J. Nucl. Mater., 2001, 288, 222–232, DOI:10.1016/S0022-3115(00)00723-6.
- S. K. Rai, A. Kumar, V. Shankar, T. Jayakumar, K. B. S. Rao and B. Raj, Characterization of microstructures in Inconel 625 using X-ray diffraction peak broadening and lattice parameter measurements, Scr. Mater., 2004, 51, 59–63, DOI:10.1016/j.scriptamat.2004.03.017.
- C. P. Paul, P. Ganesh, S. Mishra, P. Bhargava, J. Negi and A. Nath, Investigating laser rapid manufacturing for Inconel-625 components, Opt. Laser Technol., 2007, 39, 800–805, DOI:10.1016/j.optlastec.2006.01.008.
- S. I. Baik, M. J. Olszta and S. M. Bruemmer, Grain-boundary structure and segregation behavior in a nickel-base stainless alloy, Scripta Materialia, 2012, 66(10), 809–812, DOI:10.1016/j.scriptamat.2012.02.014.
- Y. F. Liu, Y. S. Zhao, C. G. Liu, Y. Y. Guo, J. Zhang, Y. S. Luo and J. B. Sha, Dependence on temperature of tensile properties of the single-crystal superalloy DD11, Mater. Sci. Technol., 2018, 34, 1188–1196, DOI:10.1080/02670836.2018.1429043.
- Z. H. Tan, X. G. Wang, Y. L. Du, T. F. Duan, Y. H. Yang, J. L. Liu, J. D. Liu, L. Yang, J. G. Li, Y. Z. Zhou and X. F. Sun, Temperature dependence on tensile deformation mechanisms in a novel Nickel-based single crystal superalloy, Mater. Sci. Eng., A, 2020, 776, 138997–139006, DOI:10.1016/j.msea.2020.138997.
- J. Zhang, H. Guo, Y. Zhao and Y. Luo, Effect of Hot Isostatic Pressing on the Tensile Property of a Second Generation Single Crystal Superalloy, Chinese Materials Conference, Springer, 2017, pp. 661–668. DOI:10.1007/978-981-13-0104-9_69.
- Z. Shang, X. Wei, D. Song, J. Zou, S. Liang, G. Liu, L. Nie and X. Gong, Microstructure and mechanical properties of a new nickel-based single crystal superalloy, J. Mater. Res. Technol., 2020, 9, 11641–11649, DOI:10.1016/j.jmrt.2020.08.032.
- J. W. Xu, Y. S. Zhao and D. Z. Tang, Tensile properties of a low-cost first generation single crystal superalloy DD16, Mater. Sci. Forum., 2013, 747–748, 478–482 Search PubMed . https://doi.org/10.4028/www.scientific.net/MSF.747-748.478.
- J. R. Li, Z. X. Shi, J. Q. Zhao and S. Z. Liu, Tensile properties of low angle boundaries of single crystal superalloy DD6, Mater. Sci. Forum., 2012, 706–709, 2418–2423 CAS . https://doi.org/10.4028/www.scientific.net/MSF.706-709.2418.
- C. H. Guo, J. J. Yu, J. L. Liu, X. F. Sun and Y. Z. Zhou, Tensile Deformation and Fracture Behavior of Nickel-Based Superalloy DZ951G, Materials, 2021, 14, 11–21, DOI:10.3390/ma14092250.
- G. L. Chen, X. D. Hui, G. He and Z. Bian, Multicomponent chemical short range order undercooling and the formation of bulk metallic glasses, Mater. Trans., 2001, 42, 1095–1102, DOI:10.2320/matertrans.42.1095.
- Y. Hu, L. Zhang and T. Cao, The effect of thickness on the creep properties of a single-crystal nickel-based superalloy, Mater. Sci. Eng., 2018, 728(2), 124–132, DOI:10.1016/j.msea.2018.04.114.
- Y. Hu, L. Zhang and C. Cheng, Influence of specimen thickness on the creep behavior of a directional solidification nickel-based superalloy, Vacuum, 2018, 150, 105–115, DOI:10.1016/j.vacuum.2018.01.032.
- A. A. Hopgood and J. W. Martin, The creep behaviour of a Nickel-based single-crystal superalloy, Mater. Sci. Eng., 1986, 82, 27–36, DOI:10.1016/0025-5416(86)90092-3.
- A. H. Sherry and R. Pilkington, The creep fracture of a single-crystal superalloy, Mater. Sci. Eng. A, 1993, 172(1–2), 51–61, DOI:10.1016/0921-5093(93)90425-E.
| This journal is © The Royal Society of Chemistry 2023 |

