 Open Access Article
Synthesis and characterization of a high-performance bio-based Pebax membrane for gas separation applications
R. Surya
Murali
 *ab,
Amit
Jha
a,
Aarti
 ab,
Swapnil
Divekar
ab and
Soumen
Dasgupta
ab
aSeparation Process Division, CSIR-Indian Institute of Petroleum, Dehradun, 248005, India. E-mail: surya.racha@iip.res.in
bAcademy of Scientific and Innovation Research (AcSIR), Sector 19, Kamla Nehru Nagar, Ghaziabad 201002, Uttar Pradesh, India
First published on 8th September 2023
Abstract
Bio-based polymers with at least a portion of the polymer derived from renewable raw materials have been the subject of research due to the increasing worldwide inclination towards sustainability. The synthesis of bio-based polymeric membranes is required to reduce dependency on fossil fuels. Pebax® Rnew® 30R51 (Pebax Rnew) is a type of bio-based polymer consisting of polyether segments and polyamide segments, wherein the polyamide segments are obtained from renewable sources. This study focuses on synthesizing and characterizing Pebax Rnew membranes for gas separation applications. Pebax Rnew was dissolved in a solvent mixture of 1-butanol and 1-propanol and cast on a Petri dish, followed by complete solvent evaporation. Free-standing dense membranes of 2 wt%, 4 wt%, 6 wt% and 8 wt% polymer solution concentration were synthesized. Pure CO2, H2, CH4, N2 and O2 gas permeabilities were measured at ambient temperature and pressures varying from 2–10 bar, and the corresponding ideal selectivities were calculated. The synthesized membrane surface and cross-sectional morphologies were investigated by scanning electron microscopy. Thermogravimetric analysis, Fourier-transform infrared spectroscopy and X-ray diffraction studies were conducted to determine the thermal stability, intermolecular interactions and intersegment distance between the polymer chains. For a 6 wt% Pebax Rnew membrane, a high permeability of 205 Barrer was measured for CO2, whereas the CH4, O2 H2, and N2 permeabilities were 9.6, 8.1, 2.9 and 18.6 Barrer, respectively. With increasing pressure, the selectivity was enhanced from 65 to 91, 20 to 26 and 9.7 to 13.5 for CO2/N2, CO2/CH4 and CO2/H2 gas systems, respectively. This work provides scope for developing bio-based membranes comparable with existing membranes for different gas separation applications to achieve process targets.
1. Introduction
Membrane-based gas separation processes are an efficient technology to reduce carbon emissions and achieve carbon neutrality. Polymeric membranes are commercially widely used in industrial separation applications due to their low cost, ease of processing and mechanical properties. Over the decades, various membranes have performed well in separating CO2 from N2 in coal-fired power plants.1,2 CO2 separation from CH4 is another primary industrial application of membranes in refineries to meet natural gas pipeline specifications and increase the calorific value of the stream.3 Similarly, CO2 and H2S can be separated from biogas using membranes.4 Membrane separation processes are an attractive alternative for separating H2 and N2 from an ammonia purge stream and CO2 from H2 in the water–gas shift reaction to produce enriched H2.5,6 Another interesting membrane application is CH4 and N2 separation from coal-bed methane gas. Membrane-based air separation plays a significant role in the chemical industry in producing enriched nitrogen and oxygen.7The selection of a polymer material is crucial in developing a membrane for gas separation. One of the methods to overcome the trade-off challenge is to combine flexible polyether polymers with mechanically stable and rigid polymers such as polyamides.8 A poly(ether block amide) copolymer is such type of material that consists of both linear chains of flexible polyether segments (PE) and hard polyamide segments (PA). Glassy polyamide segments contribute mechanical strength, whereas rubbery polyether segments provide high permeability owing to the higher polymer chain mobility of the ether functional groups.9 Poly(ether block amide) thermoplastic elastomers is best known by the trademark Pebax. Different grades of Pebax copolymers are being synthesized by changing the composition of the amide and ether segments. Researchers have been developing and modifying different Pebax grades for various gas separation studies.10–16Table 1 illustrates the composition of Pebax grades that are majorly evaluated for gas separation applications. Pebax has been extensively studied for CO2 separation application owing to its strong affinity among CO2 gas molecules and polar carbonyl linkages present in the PE blocks.8–10 Bondar et al.11 evaluated the different grades of Pebax membranes for gas separation properties, materials such as Pebax 2533, 4033, 1074 and 4011. It was revealed that gas permeability increases with increasing the percentage of the PE blocks in the Pebax copolymers. Researchers have been extensively working on Pebax 1657 due to its higher CO2 permeation properties.9–12
| Pebax grade | Rigid polyamide segment | Flexible polyether segment | Rigid polyamide segment wt% | Flexible polyether segment wt% | Ref. |
|---|---|---|---|---|---|
| a PA6:5 methyl units polyamide. b PA12:11 methyl units polyamide. c PA11:10 methyl units polyamide. d PEO: poly(ethylene oxide). e PTMO: polytetramethylene oxide. | |||||
| 1657 | PA6a | PEOd | 40 | 60 | 9 |
| 2533 | PA12b | PTMOe | 20 | 80 | 13 |
| 1074 | PA12 | PEO | 45 | 55 | 14 |
| 3533 | PA12 | PTMO | 25 | 75 | 15 |
| 4033 | PA12 | PTMO | 43 | 57 | 16 |
| 5533 | PA12 | PTMO | 70 | 30 | 11 |
| 4011 | PA6 | PEO | 43 | 57 | 11 |
| Rnew® 30R51 | PA11c | PEO | 20 | 80 | 17 |
Currently, the majority of membranes used for separation applications are synthetic polymeric materials. These synthetic polymers are usually produced from fossil-based resources, which leads to anthropogenic emission of greenhouse gas that significantly contributes to climate change. Hence, it is essential to switch from a fossil-based materials economy to an ideally circular materials economy. Development of biobased polymers is an alternative to solve the environmental impact and dependency on fossil resources. This transition generates an opportunity to develop sustainable membrane materials for separation applications.18
Bio-based polymers are materials for which at least a portion of the polymer is formed from renewable raw materials.19 Biopolymers or monomers are commonly obtained from plants, biogenic feed stocks and other non-fossil resources. A blend of renewable resource monomers and fossil-based monomers is also referred to as biobased polymer materials.20 Based on the current progress in circular materials and green environmental regulations, biomaterials are renowned as impending and sustainable materials for switching with fossil-based synthetic polymers. Bio-based polymeric membrane materials have been used in microfiltration, ultrafiltration, reverse osmosis, gas separation and pervaporation applications.
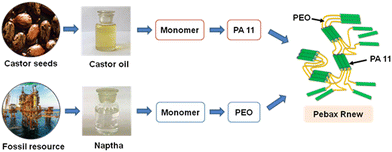
Pebax® Rnew® 30R51 is a variety of biobased polymers made of flexible polyether segments derived from fossil fuel and rigid polyamide segments from renewable sources. Castor seeds obtained from castor plants are the base material for preparing renewable polyamide segments. These castor beans are initially crushed followed by pressing to extract the oil. The thus obtained castor oil is processed through several refining steps and finally transformed into amino-11 monomers. The synthesized monomers are further processed into polyamides (PA11). Pebax Rnew polymer is synthesized by the polycondensation of renewable polyamides (PA11) with an alcohol-terminated polyether.21
Martínez-Izquierdo et al. synthesized Pebax Rnew membranes for single and mixed gas permeation studies. Compared to other Pebax grades, 1657 and Rnew exhibited superior separation performance due to the presence of polyethylene oxide as the soft segments, which show more interaction with CO2 gas molecules. A 3 wt% Pebax Rnew membrane exhibited a CO2 permeability of 167 and 164 Barrer for single and mixed gas permeation, respectively, and corresponding CO2/N2 selectivities of 41 and 37 were calculated.8 The higher solubility of CO2 in the case of Pebax Rnew has increased research interest in focusing on membrane preparation parameters and their modification. The same group modified membranes by incorporating an ionic liquid (IL) [Bmim][BF4] and metal–organic framework (MOF) to prepare thin film composite (TFC) membranes via spin coating on polysulfone supports. Compared with the Pebax Rnew TFC membrane, the IL loading improved the CO2 permeance by 27% and CO2/N2 selectivity by 7%. Whereas, MOF incorporation increased CO2 permeance by 51% and 65% for ZIF-8 and ZIF-94, respectively, although the CO2/N2 separation selectivity decreased by 7% to 25 in both cases.17
Polymer solution concentration plays a significant role in membrane formation and separation performance. The viscosity of a polymer solution increases with polymer concentration and reaches a critical concentration, where beyond critical concentration entanglement of the polymer chains is inevitable. Martínez-Izquierdo et al. studied the influence of casting solution concentration on the morphology and gas permeation properties of Pebax-1657 membranes. The polymer crystallinity, an important factor in the fabrication of organized structures, decreased with increasing polymer concentration from 1 wt% to 5 wt%. Membranes prepared from a 3 wt% Pebax-1657 solution were found to exhibit higher separation performance, irrespective of the operating temperature.22 Similarly, Hasan et al. synthesized Pebax-3533 membranes by varying the concentration from 1 wt% to 6 wt% and evaluated them for CO2 separation. Increasing the polymer concentration enhanced the performance from 1 wt% to 5 wt% and higher concentrations resulted in a decrease in membrane performance due to changes in polymer crystallinity.23
We believe that solution concentration effects could help in selecting a suitable polymer concentration for gas separation applications. It is essential to find a correlation among the casting conditions and membrane performance, including morphology, thermal and mechanical properties, long term stability, etc. To our knowledge, for Pebax Rnew membranes, the effect of polymer concentration on morphology, thermal and complete gas permeation properties has not been discussed previously in the literature. In this work, Pebax® Rnew® 30R51 (Pebax Rnew) membranes were synthesized and the permeability of pure CO2, CH4, H2, N2 and O2 gases was evaluated. This study intended to assess the effect of polymer concentration on gas permeabilities. Further, membrane performance was investigated by varying the feed gas pressure. The physical and chemical characteristics of the membranes were evaluated using scanning electron microscopy (SEM), Fourier-transform infrared (FTIR) spectroscopy, X-ray diffractometry (XRD) and thermogravimetric analysis (TGA) characterization.
2. Materials and methods
2.1. Materials
Arkema India Chemicals Private Limited, Mumbai, kindly provided Pebax® Rnew® 30R51 as pellets. Fig. 1 shows the chemical structure of the Pebax Rnew polymer, which contains 20% rigid polyamide and 80% flexible polyether segments. Castor oil extracted from castor plant seeds was used to produce the basic building blocks of the polyamide PA11 (https://pebaxpowered.arkema.com/en/bio-based-pebax/). Fig. 2 shows the steps involved in synthesizing the Pebax Rnew polymer, which consists of 45% bio content, according to ASTM D6866.24Chemicals for membrane synthesis were used as received without any purification. ACS grade 1-butanol and 1-propanol were purchased from Alfa Aesar, India. CO2, CH4, H2, O2, and N2 gas cylinders of >99.9% purity were supplied by Sigma Gases and Services, India.
2.2. Membrane preparation
The membranes were synthesized using solution casting and a controlled solvent evaporation method. Pebax Rnew membranes were cast from polymer solution containing 2 wt% to 8 wt% polymer in a 1![[thin space (1/6-em)]](https://www.rsc.org/images/entities/char_2009.gif) :
:![[thin space (1/6-em)]](https://www.rsc.org/images/entities/char_2009.gif) 1 solvent mixture of 1-butanol and 1-propanol under constant stirring of around 400 rpm at a temperature of 80 °C under reflux. A predetermined quantity of polymer was dissolved in the solvent mixture gradually to avoid lump formation. After the complete dissolution of the added polymer, the remaining portion was introduced. A completely dissolved polymer solution was sonicated for 4 h to remove bubbles. Finally, a Pebax Rnew dope solution was poured into the glass Petri dish and covered with another properly leveled, bigger Petri dish with a slight opening at the bottom. The dope solution was left to evaporate at ambient temperature for at least 48 h and subsequently dried in an oven for at least 24 h at a temperature of 120 °C. After the complete removal of solvent, the membranes were gently peeled off from the Petri dish for performance studies.
1 solvent mixture of 1-butanol and 1-propanol under constant stirring of around 400 rpm at a temperature of 80 °C under reflux. A predetermined quantity of polymer was dissolved in the solvent mixture gradually to avoid lump formation. After the complete dissolution of the added polymer, the remaining portion was introduced. A completely dissolved polymer solution was sonicated for 4 h to remove bubbles. Finally, a Pebax Rnew dope solution was poured into the glass Petri dish and covered with another properly leveled, bigger Petri dish with a slight opening at the bottom. The dope solution was left to evaporate at ambient temperature for at least 48 h and subsequently dried in an oven for at least 24 h at a temperature of 120 °C. After the complete removal of solvent, the membranes were gently peeled off from the Petri dish for performance studies.
2.3. Membrane characterization
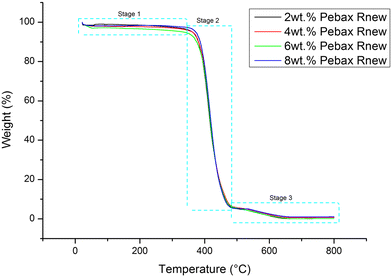
FTIR spectra of the Pebax Rnew membranes were scanned between 4000 and 400 cm−1 using a PerkinElmer Spectrum Two™ spectrometer.TGA of the synthesized membranes was performed under a N2 atmosphere using a Discovery series (SDT 560) instrument at a heating rate of 10 °C min−1 to 800 °C.
SEM performed using a FEI Quanta 200 Field Emission scanning electron microscope was used to investigate the surface and cross-sectional morphologies of the synthesized membranes. Samples were prepared by dipping them in liquid nitrogen and coating them with conducting gold to avoid electron beam charging.
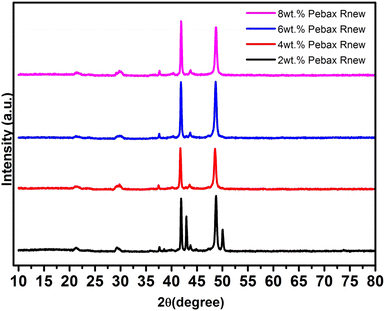
The intersegment distance between the polymer chains in membranes was confirmed on a Proto Advance X-ray diffractometer (XRD) connected to a Lynx eye high-speed strip detector. X-rays of 0.154 nm in wavelength were produced using a Cu Kα source. The angle (2θ) of diffraction was varied from 10° to 80° to identify the intersegmental chains.
2.4. Gas permeation studies
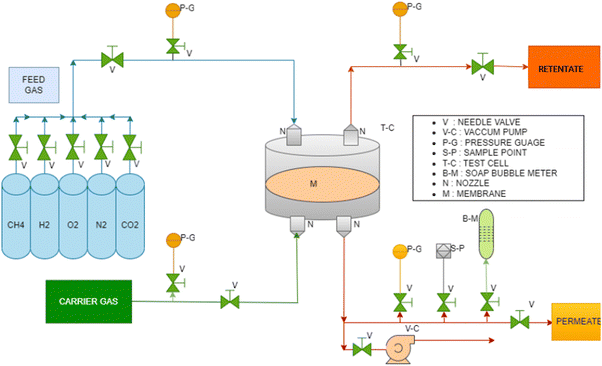
Fig. 3 shows a schematic of the membrane based gas permeation experimental system. The performance of the membranes was evaluated using an indigenously designed setup of SS 316 material. The experimental setup was flexible to perform both pure and mixed gas studies. The membrane test cell consists of two ports at the top for transporting feed and retentate gas and two at the bottom for transporting permeate and sweep gas. An inert gas such as helium or argon gas was used as the sweep gas. The top and bottom of the plates were connected by locking bolts. A perforated circular plate attached with fine SS mesh supported the membrane. Vacuum grease was used for the rubber gasket and “O” ring while fixing the membrane to avoid leaks. All the steams such as feed, retentate, permeate, and sweep gas lines were tubes made of SS 316. Compression fitting nuts and ferrule were used for all streams to withstand higher pressures and avoid leakage. Feed, retentate, and sweep stream gas flows were regulated with
  SS 316 needle valves.
The synthesized membranes were tested for pure CO2, CH4, H2, O2 and N2 gases using the traditional constant pressure method. The permeability and selectivity were measured in the 2 to 10 bar pressure range and at ambient temperatures (25± 3 °C). Self-supported membranes were gently cut into circular form and placed over a polyester fabric support in the permeation test cell. A rubber gasket and “O” ring were placed on the membrane by applying vacuum grease. The top lid of the test cell was properly positioned to tighten the cell. The top and bottom lids were fixed appropriately using SS bolts. At least three samples were evaluated from each membrane type and the gas permeability was averaged. Sweep gas was not used in this case as transport gas as the permeate flow rate was measurable. Before every experiment, feed, retentate, and permeate streams were flushed with inert gas to avoid contamination. Feed gas was slowly passed into the top section of the membrane test cell using a needle valve. Continuous gas flow was maintained across the membrane in the test cell by partially opening the output valve. A soap bubble flow meter was fitted to the permeate line to measure the permeate flow. After attaining a steady state, the permeation data were collected at least five times over 30 min, and the calculated permeability was averaged. Synthesized membrane thicknesses were measured using SEM at different portions of the membrane cross-section, and the average value was used for calculating permeability.
The permeability coefficient (P) was calculated using eqn (1):
 | (1) |
The selectivity (α) is the permeability ratio of fast and slow permeating gas.
 | (2) |
3. Results and discussion
3.1. Membrane characterization
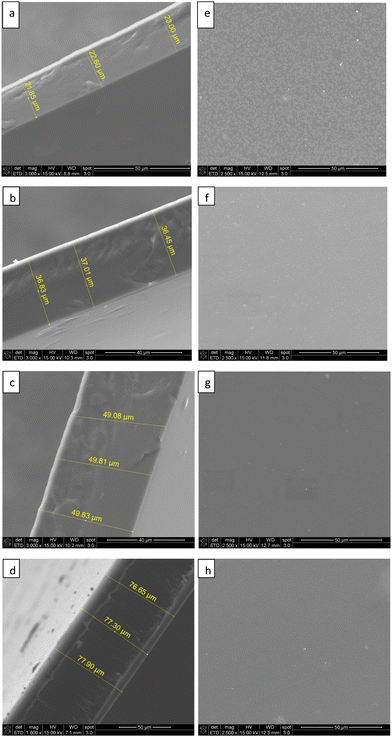
Fig. 4(e)–(h) show the surface morphologies of 2 wt%, 4 wt%, 6 wt% and 8 wt% Pebax Rnew membranes, respectively. As observed in surface morphologies, the top surface of the membranes is homogeneous and uniform in nature; no defects or polymer agglomerations were detected. To avoid lump and agglomeration at higher polymer concentrations, precautions were taken to obtain defect-free and smooth membranes, such as casting the membrane when the polymer solution was around 30–35 °C, heating the Petri dishes at around 30 °C to avoid instantaneous evaporation of the solvent and covering them with larger Petri dishes with a very small opening.
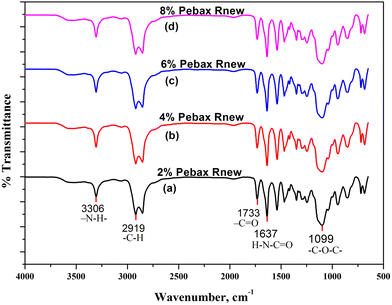
![[double bond, length as m-dash]](https://www.rsc.org/images/entities/char_e001.gif) O functional group, the peak at 1733 cm−1 is associated with the –C
O functional group, the peak at 1733 cm−1 is associated with the –C![[double bond, length as m-dash]](https://www.rsc.org/images/entities/char_e001.gif) O group in saturated esters, and the peak at 3306 cm−1 represents the –N–H– groups.8 Regarding the polyether soft segment bands, the peak at 2919 cm−1 represents the aliphatic C–H functional group stretching and bending vibrations. The pattern obtained at 1099 cm−1 corresponds to the stretching vibration of the C–O–C ether functional group. The peaks align with the reported literature.8,17,26
O group in saturated esters, and the peak at 3306 cm−1 represents the –N–H– groups.8 Regarding the polyether soft segment bands, the peak at 2919 cm−1 represents the aliphatic C–H functional group stretching and bending vibrations. The pattern obtained at 1099 cm−1 corresponds to the stretching vibration of the C–O–C ether functional group. The peaks align with the reported literature.8,17,26
3.2. Gas permeation studies
Table 2 shows the effect of the Pebax Rnew polymer solution concentration on the gas permeation characteristics at a constant feed gas pressure of 5 bar. The gas permeability order was observed to be CO2 > H2 > CH4 > O2 > N2. CO2 gas showed higher solubility in the Pebax Rnew polymer and is comparatively inert to the other gases. The polyether segments in the Pebax Rnew are strongly associated with CO2 because of dipole-quadrupole interactions between the polyether matrix and CO2 molecule.8,28 Due to the higher amount of soft segments in the Pebax Rnew polymer, the CO2 solubility and permeability values are higher. Additionally, the kinetic diameter of CO2 is less than those of CH4, O2 and N2, leading to it exhibiting higher diffusivity than the other gases. In the case of H2, diffusivity would be higher than CO2 due to its smaller kinetic diameter (2.89 Å) than that of CO2 (3.3 Å). However, the selectivity of gas molecules depends on their condensability and polymer–gas interactions. Typically for rubbery polymers, CO2 has greater solubility than H2.29–31 The higher polyether content in Pebax typically resulted in higher gas solubility, and, in addition, quadrupolar interactions between the CO2 molecules and the ether groups enhanced the solubility.32 Hence, despite its smaller kinematic diameter (2.89 Å), H2 exhibited less permeability in the polymer matrix. CH4, H2, N2 and O2 transport was due to the polyamide phase free volume in the polymer.
| Membrane | Average thickness (μm) | Gas permeability (Barrer) | ||||
|---|---|---|---|---|---|---|
| CO2 | CH4 | O2 | N2 | H2 | ||
| 2% Pebax Rnew | 22 | 113 ± 3 | 5.3 ± 0.1 | 4.1 ± 0.1 | 1.8 ± 0.1 | 9.5 ± 0.2 |
| 4% Pebax Rnew | 36 | 112 ± 4 | 5.3 ± 0.2 | 4.8 ± 0.1 | 1.7 ± 0.1 | 9.3 ± 0.2 |
| 6% Pebax Rnew | 50 | 205 ± 6 | 9.6 ± 0.2 | 8.1 ± 0.2 | 2.9 ± 0.1 | 18.6 ± 0.9 |
| 8% Pebax Rnew | 76 | 136 ± 5 | 8.0 ± 0.2 | 4.9 ± 0.1 | 2.2 ± 0.1 | 12.6 ± 0.8 |
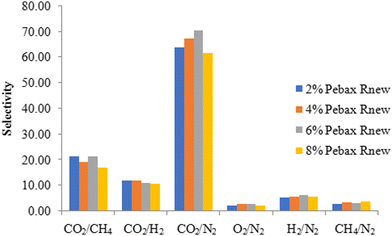
From Table 2, it was found that increasing the polymer concentration from 2 wt% to 4 wt% had no impact on the gas permeability. At 6 wt% of Pebax Rnew polymer concentration, around 85%, 80%, 100%, 60% and 90% increases in gas permeation were observed for CO2, CH4, O2, N2 and H2 gases, respectively. The increase in permeability was due to the polymer matrix arrangement and change in intersegmental spacing with polymer solution concentration, as shown in the XRD data. Fig. 8 shows the mechanism of gas permeation through the membrane upon varying the polymer concentration. For 2 wt% and 4 wt% polymer concentrations, the structural relaxation time was low due to fast solvent evaporation. Polymer chains are not very flexible for orientation and result in less free volume. At a critical concentration of 6 wt%, the polymer chains have sufficient time for chain alignment and ensure more free volume. The increased free volume enhances the gas permeation through the polymer matrix. Additionally, the higher amount of soft segments in 6 wt% compared with 2 wt% and 4 wt% led to higher permeation of gases. Thus, higher gas permeability was observed for all the gases. However, at a higher polymer concentration of 8 wt%, gas permeability was decreased for all the gases. This might be due to the higher packing density of the polyamide and polyether segments on the membrane surface. A higher packing density would have compacted the polymer matrix and decreased the fractional free volume, as shown in Fig. 8. Fig. 9 illustrates the effect of polymer solution concentration on the selectivity of CO2/N2, CO2/H2, CO2/CH4, H2/N2, CH4/N2 and O2/N2. Though the permeability of gases was enhanced considerably, significant improvement in gas selectivity was not observed, except for CO2/N2 gas system. Hence, the 6 wt% Pebax Rnew polymer was considered to be the optimal polymer solution concentration for the best gas separation performance.
| Pressure (bar) | Gas permeability (Barrer) | ||||
|---|---|---|---|---|---|
| CO2 | CH4 | N2 | H2 | O2 | |
| 2 | 156.6 | 7.6 | 2.4 | 16.1 | 6.5 |
| 4 | 186.5 | 8.2 | 2.75 | 17.5 | 7.2 |
| 6 | 240.1 | 10.6 | 3.12 | 20.1 | 8.9 |
| 8 | 280.6 | 12.1 | 3.4 | 23.5 | 9.2 |
| 10 | 346.2 | 13.9 | 3.8 | 25.6 | 11.5 |
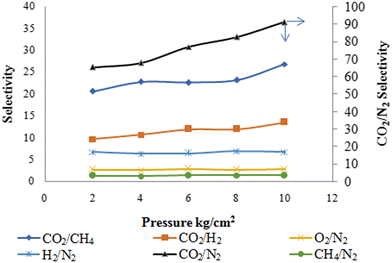
The effect of applied feed pressure on membrane selectivity is shown in Fig. 10. CO2/N2, CO2/CH4 and CO2/H2 gas selectivity enhanced from 65 to 91, 20 to 25 and 9 to 13, respectively, with increasing pressure. The increase in CO2 gas selectivity to N2, CH4 and H2 gases was anticipated due to the plasticization of polymer chains by CO2 molecules with increasing pressure. Another possibility is that the flexible polyether segments' weak size sieving capability results in high CO2 selectivity. Increasing pressure had a marginal change effect on CH4/N2, H2/N2 and O2/N2 gas selectivities.
| Polymer conc. | Permeability (Barrer) | Selectivity | Ref. | |||
|---|---|---|---|---|---|---|
| CO2 | N2 | CH4 | CO2/N2 | CO2/CH4 | ||
| a GPU = gas permeation unit. | ||||||
| 3 wt% Pebax 1657 | 92 ± 4 | 2.2 ± 0.2 | — | 39 ± 6 | 22 | |
| 2.5 wt% Pebax 1657 | 123.4 ± 3.7 | — | 5.8 ± 0.17 | — | 21.2 ± 1.1 | 34 |
| 3 wt% Pebax 1074 | 170 | 4.1 | — | 41 | — | 35 |
| 2.5 wt% Pebax 1074 | 63 | — | 2.8 | — | 22 | 36 |
| 3 wt% Pebax 2533 | 238 ± 8 | 12.4 ± 0.3 | 19 ± 1 | 8 | ||
| 3 wt% Pebax 3533 | 205 ± 13 | 13.0 ± 9.5 | 22 ± 1 | 8 | ||
| 3 wt% Pebax 4533 | 97 ± 10 | 10.0 ± 5.7 | 18 ± 3 | 8 | ||
| 3 wt% Pebax Rnew | 167 ± 7 | 4.1 ± 0.1 | — | 41 ± 3 | — | 8 |
| 2 wt% Pebax Rnew | 497 ± 71a | 21 ± 4a | 49 ± 5a | 27 ± 3 | 9 ± 2 | 17 |
| 2 wt% Pebax Rnew | 113 ± 3 | 5.3 ± 0.1 | 1.8 ± 0.1 | 62 ± 2 | 20 ± 2 | This work |
4. Conclusions
Biobased Pebax® Rnew® 30R51 membranes were successfully prepared in a 1![[thin space (1/6-em)]](https://www.rsc.org/images/entities/char_2009.gif) :
:![[thin space (1/6-em)]](https://www.rsc.org/images/entities/char_2009.gif) 1 (v/v) solvent mixture of 1-butanol and 1-propanol. Dense membranes were synthesized by varying the polymer concentration from 2 wt% to 8 wt%. The performances of the synthesized membranes were evaluated for pure CO2, CH4, H2, N2 and O2 gases. SEM morphologies show an increase in membrane thickness with increasing polymer concentration due to the change in the polymer/solvent ratio of the Pebax Rnew solution. The FTIR spectra showed a similar pattern for all the synthesized membranes. Both polyamide and polyether segment bands were observed in the spectra. The TGA results of the Pebax Rnew membranes follow the same trend in weight loss with increasing temperature, with these membranes exhibiting excellent thermal stability up to 340 °C. The XRD patterns reveal an increase in intersegmental spacing with polymer solution concentration.
1 (v/v) solvent mixture of 1-butanol and 1-propanol. Dense membranes were synthesized by varying the polymer concentration from 2 wt% to 8 wt%. The performances of the synthesized membranes were evaluated for pure CO2, CH4, H2, N2 and O2 gases. SEM morphologies show an increase in membrane thickness with increasing polymer concentration due to the change in the polymer/solvent ratio of the Pebax Rnew solution. The FTIR spectra showed a similar pattern for all the synthesized membranes. Both polyamide and polyether segment bands were observed in the spectra. The TGA results of the Pebax Rnew membranes follow the same trend in weight loss with increasing temperature, with these membranes exhibiting excellent thermal stability up to 340 °C. The XRD patterns reveal an increase in intersegmental spacing with polymer solution concentration.
The order of gas permeability was observed to be: CO2 > H2 > CH4 > O2 > N2. Due to the higher content of the soft rubbery segments in the Pebax Rnew polymer, CO2 solubility and transport across the membrane were easier. The permeability of the other gases was relatively low due to them being inert toward the polymer matrix. The membranes prepared from 6 wt% Pebax Rnew solution were identified as highly permeable and selective. The highest selectivities of 91, 13 and 26 were observed for CO2/N2, CO2/H2 and CO2/CH4, respectively, with increasing pressure. The developed biobased Pebax Rnew membrane holds potential for CO2 separation from power plants, sweetening of natural gas and water–gas shift reaction applications. Unlike other Pebax grades, research on the Pebax Rnew membrane is limited. There is great scope to work on other parameters, such as the effect of solvents and mixtures, casting parameters and post-treatment of membranes. Separation properties could be further improved by physical and chemical modification of the Pebax Rnew membrane. The performance of membranes with gas mixtures and impurities could be studied. In addition, membrane limitations, such as plasticization and aging effects, could be assessed deeply. The Pebax Rnew thin film composite membrane can be easily scaled into spiral wound modules for high-pressure separation processes such as natural-gas sweetening.
Conflicts of interest
There are no conflicts to declare.References
- M. Chawla, H. Saulat, M. Masood Khan, M. Mahmood Khan, S. Rafiq, L. Cheng, T. Iqbal, M. I. Rasheed, M. Z. Farooq, M. Saeed, N. M. Ahmad, M. B. Khan Niazi, S. Saqib, F. Jamil, A. Mukhtar and N. Muhammad, Chem. Eng. Technol., 2020, 43, 184–199 CrossRef CAS.
- C. E. Powell and G. G. Qiao, J. Membr. Sci., 2006, 279, 1–49 CrossRef CAS.
- Y. Zhang, J. Sunarso, S. Liu and R. Wang, Int. J. Greenhouse Gas Control, 2013, 12, 84–107 CrossRef CAS.
- M. S. Shin, K.-H. Jung, J.-H. Kwag and Y.-W. Jeon, Process Saf. Environ. Prot., 2019, 129, 348–358 CrossRef CAS.
- N. Sazali, M. A. Mohamed and W. N. W. Salleh, Int. J. Adv. Manuf. Technol., 2020, 107, 1859–1881 CrossRef.
- N. W. Ockwig and T. M. Nenoff, Chem. Rev., 2007, 107, 4078–4110 CrossRef CAS PubMed.
- R. S. Murali, T. Sankarshana and S. Sridhar, Sep. Purif. Rev., 2013, 42, 130–186 CrossRef CAS.
- L. Martínez-Izquierdo, A. Perea-Cachero, M. Malankowska, C. Téllez and J. Coronas, J. Environ. Chem. Eng., 2022, 10, 108324 CrossRef.
- R. Surya Murali, S. Sridhar, T. Sankarshana and Y. V. L. Ravikumar, Ind. Eng. Chem. Res., 2010, 49, 6530–6538 CrossRef.
- P. Sharma, Y.-J. Kim, M.-Z. Kim, S. F. Alam and C. H. Cho, Nanoscale Adv., 2019, 1, 2633–2644 RSC.
- V. I. Bondar, B. D. Freeman and I. Pinnau, J. Polym. Sci., Part B: Polym. Phys., 1999, 37, 2463–2475 CrossRef CAS.
- P. Bernardo and G. Clarizia, Polymers, 2020, 12, 253 CrossRef CAS.
- H. Hassanzadeh, R. Abedini and M. Ghorbani, Ind. Eng. Chem. Res., 2022, 61, 13669–13682 CrossRef CAS.
- N. Azizi, T. Mohammadi and R. Mosayebi Behbahani, Chem. Eng. Res. Des., 2017, 117, 177–189 CrossRef CAS.
- L. Martínez-Izquierdo, M. Malankowska, C. Téllez and J. Coronas, J. Environ. Chem. Eng., 2021, 9, 105624 CrossRef.
- K. Friess, V. Hynek, M. Šípek, W. M. Kujawski, O. Vopička, M. Zgažar and M. W. Kujawski, Sep. Purif. Technol., 2011, 80, 418–427 CrossRef CAS.
- L. Martínez-Izquierdo, C. Téllez and J. Coronas, J. Mater. Chem. A, 2022, 10, 18822–18833 RSC.
- R. M. Cywar, N. A. Rorrer, C. B. Hoyt, G. T. Beckham and E. Y. X. Chen, Nat. Rev. Mater., 2022, 7, 83–103 CrossRef CAS.
- T. M. Joseph, A. B. Unni, K. S. Joshy, D. Kar Mahapatra, J. Haponiuk and S. Thomas, C, 2023, 9, 30 CAS.
- P. M. Aparna Shukla, Advances in Sustainable Polymers: Processing and Applications, ed. V. Katiyar, R. Gupta and T. Ghosh, Springer Nature Singapore Pte Ltd, 2019, pp. 3–19 Search PubMed.
- M. Schär, L. Zweifel, D. Arslan, S. Grieder, C. Maurer and C. Brauner, Polymers, 2022, 14, 5092 CrossRef.
- L. Martínez-Izquierdo, M. Malankowska, J. Sánchez-Laínez, C. Téllez and J. Coronas, R. Soc. Open Sci., 2019 DOI:10.1098/rsos.190866.
- M. R. Hasan, H. Zhao, N. Steunou, C. Serre, M. Malankowska, C. Téllez and J. Coronas, Int. J. Greenhouse Gas Control, 2022, 121, 103791 CrossRef CAS.
- Arkema, High performance bio-based materials for sports, https://hpp.arkema.com/files/live/sites/hpp_extremematerials/files/downloads/market-presentations/arkema-mp-sports-market-presentation.pdf.
- S. S. Karim, S. Farrukh, A. Hussain, M. Younas and T. Noor, Polym. Polym. Compos., 2022, 30 DOI:10.1177/09673911221090053.
- H. Sanaeepur, S. Mashhadikhan, G. Mardassi, A. Ebadi Amooghin, B. Van der Bruggen and A. Moghadassi, Korean J. Chem. Eng., 2019, 36, 1339–1349 CrossRef CAS.
- S. Wang, Y. Liu, S. Huang, H. Wu, Y. Li, Z. Tian and Z. Jiang, J. Membr. Sci., 2014, 460, 62–70 CrossRef CAS.
- D. Zhao, J. Ren, H. Li, X. Li and M. Deng, J. Membr. Sci., 2014, 467, 41–47 CrossRef CAS.
- R. W. Baker, E. L. Cussler, W. Eykamp, W. J. Koros, R. L. Riley and H. Strathmann, Membrane separation systems—A research and development needs assessment, 1990 Search PubMed.
- B. E. Poling, J. M. Prausnitz and J. P. O’Connell, The Properties of Gases and Liquids, McGraw-Hill, New York, 4th edn, 1987 Search PubMed.
- E. Esposito, R. Bruno, M. Monteleone, A. Fuoco, J. Ferrando Soria, E. Pardo, D. Armentano and J. C. Jansen, Appl. Sci., 2020, 10, 1310 CrossRef CAS.
- S. L. Liu, L. Shao, M. L. Chua, C. H. Lau, H. Wang and S. Quan, Prog. Polym. Sci., 2013, 38, 1089–1120 CrossRef CAS.
- X. Guan, Y. Wu, Y. Zheng and B. Zhang, Sci. Prog., 2023, 106, 1–19 Search PubMed.
- Z. Farashi, S. Azizi, M. Rezaei-Dasht Arzhandi, Z. Noroozi and N. Azizi, J. Nat. Gas Sci. Eng., 2019, 72, 103019 CrossRef CAS.
- Y. Wang, H. Li, G. Dong, C. Scholes and V. Chen, Ind. Eng. Chem. Res., 2015, 54, 7273–7283 CrossRef CAS.
- S. Azizi, N. Azizi and R. Homayoon, Silicon, 2019, 11, 2045–2057 CrossRef CAS.
| This journal is © The Royal Society of Chemistry 2023 |


