 Open Access Article
Creative Commons Attribution 3.0 Unported Licence
Ultra-bright and thermally stable deep red emitting doped yttrium zirconate nanoparticles for tunable white LEDs and indoor plant growth
Reshmi Thekke
Parayil
ac,
Santosh Kumar
Gupta
 *ac,
Malini
Abraham
bd,
Subrata
Das
 bd,
Shreyas S.
Pitale
e,
Kathi
Sudarshan
 ac and
Manoj
Mohapatra
ac
aRadiochemistry Division, Bhabha Atomic Research Centre, Mumbai 400085, India. E-mail: santoshg@barc.gov.in; santufrnd@gmail.com
bMaterials Science and Technology Division, CSIR-National Institute for Interdisciplinary Science and Technology, Thiruvananthapuram, Kerala 695019, India
cHomi Bhabha National Institute, Anushaktinagar, Mumbai 400094, India
dAcademy of Scientific and Innovative Research (AcSIR), Ghaziabad 201002, India
eTechnical Physics Division, Bhabha Atomic Research Centre, Mumbai 400085, India
First published on 10th October 2023
Abstract
To counter the problem of the lack of an efficient red phosphor in commercial LEDs, it is important to develop a red-emitting phosphor with a high quantum efficiency, thermal stability, and size of nanodomain. The present work involves the synthesis of deep red-emitting Y2Zr2O7:Eu3+ (YZOE) nanocrystals with a very high color purity, excellent thermal stability, and a higher absolute photoluminescence quantum yield (PLQY) value. The photoluminescence (PL) lifetime and positron annihilation lifetime spectroscopy (PALS) suggested that a very large fraction of the Eu3+ ions occupy an isovalent Y3+ site with a minimal lattice strain. Triggered by this, the absolute PLQYs for the YZOE nanocrystals reach over 88%, which is much higher than that of its bulkier counterpart, and the highest among the known Eu3+-doped oxide based red-emitting phosphors. The color purity of the material (97%) is higher than that of the commercial red phosphor Y2O3:Eu3+ (92.4%). The optimum red phosphor is able to retain a color purity of 89% at 428 K relative to the PL intensity observed at room temperature, and the activation energy is estimated to be 0.2 eV which demonstrates its excellent thermal stability. Interestingly, the designed red phosphor-converted (pc-LED) was able to provide the reference spectral region which is required for indoor plant growth. Finally, the tunable white LEDs (cool and warm white LED) are fabricated by combining the RGB mixture of the optimized red YZOE nanoparticles with commercial green and blue phosphors together with a 280 nm UV LED chip. By tuning the RGB mixing ratio, the resultant emission from the fabricated pc-LED appears as a warm white light with a correlated color temperature (CCT) of 4164 K, color rendering index (CRI) of 78, and CIE of 0.358, 0.309 which is the ultimate requirement for ideal indoor lighting.
1. Introduction
Lighting consumes around 15% of the world's total energy demand, which is the main cause of 5% of the world's total greenhouse gas emissions as well as energy scarcity.1,2 The two main factors that are responsible for this are population growth and increased urbanization which is further expected to increase the lighting demand to 50% by 2030.2–4 These adverse scenarios mainly arise from the use of incandescent and fluorescent lamps which suffer from low light efficiency, high power consumption, and high heat generation.5,6 It is expected that the use of light-emitting diodes (LEDs) can reduce lighting power consumption by half because of their high light efficiency, low power consumption, high durability, long life, lower heat generation, and eco-friendliness.7–10 The current existing commercial white LED consists of an InGaN chip with Ce3+ activated yttrium aluminum garnet (Y3Al5O12:Ce3+) which is the yellow phosphor material.11 But because of the lack of a red phosphor, the emitted white light has a low color rendering index (CRI, Ra < 80) and a high correlated color temperature (CCT > 4500 K), making it a more bluish-white light which is not considered ideal for indoor lighting.12–14 Due to these limitations their uses have not been harnessed in the areas such as medical imaging, general illumination, indoor lighting, and so on. The CRI is defined as the ability of a light source to reveal the color of objects when compared to sunlight, and the CCT is defined as the color appearance of white LED, both of these are very important photophysical parameters for evaluating the performance of LEDs. The other ways in which the white light can be generated are by combining red, green, and blue (RGB) phosphors which are excited by using UV LED or by mixing red and green phosphors which are excited using a blue LED chip.15 The combination of RGB phosphors with a UV LED chip gives a wide range of phosphors that can be excited by UV irradiation rather than by blue irradiation.16–18The currently available phosphors are nitrides, sulfides, and oxysulfides which have many limitations such as thermal and chemical instability, and a complex synthesis process.19 The existing commercial red phosphors are Eu2+ activated systems (Sr2Si5N8:Eu2+ and CaAlSiN3:Eu2+) which possess low color purity and low luminous efficiency due to the broadband emission originating from the f → d transitions of Eu2+ leading to the serious issue of photon reabsorption.20–22 Comparing Eu3+ with Eu2+, the former has a sharp red emission band due to the f → f transition.22 Even though both are the same rare earth element, their luminescence properties are different due to the different electronic structures they possess. The other sulfide-based phosphor which is currently being used is Y2O2S:Eu3+ but it also suffers from poor absorption and stability issues with near UV light.23 The sulfide-based phosphors also have the limitation that they release poisonous sulfur gas which is harmful to the environment.24,25 Compared to nitrides and sulfides, oxide-based phosphors have the advantage of a high luminescence efficiency, good thermal and chemical stability, high vacuum stability, easy synthesis methods, and eco-friendliness.25,26 Hence, the choice of the host becomes a very important criterion for designing an efficient lanthanide ion-doped phosphor.5,16,27 The forbidden transition of the activator is relaxed when it is surrounded by the host matrix and because of this the luminescence intensity is enhanced.9 So it is inevitable to develop a new oxide-based red phosphors with a high quantum yield efficiency, good thermal stability, strong absorption in the UV region, and an economically feasible synthesis route to cope the existing scenario.28 As an activator for the phosphor material, Eu3+ is a promising candidate for red emission due to its unique properties such as narrow red emission, a sensitive transition which depends on the chemical surrounding, and the long lifetime of the chemical species.26,29 The red emission is in the region from 603 to 630 nm which corresponds to the 5D0 → 7F2 transition.
In addition to the white LEDs (w-LEDs), the phosphor converted LEDs (pc-LEDs) have acquired great attention as an artificial lighting source in the fields of modern agriculture and indoor plant growth applications, especially in areas that lack land and light resources.30 Promoting plant growth is significant because this purifies the air providing a soothing environment and enables cheap and highly nutritional food to be available in all the seasons.31 Pigments such as chlorophyll and phytochrome having a maximum absorption in the red region (known as PR), and in the far-red region (known as PFR), play a vital role in photosynthesis, phototropism, and photomorphogenesis which are essential for the processes like seed germination, formation of seedlings, and flowering. The absorption spectra of phytochromes cover a broad range of wavelengths from about 550 nm to 750 nm and that of chlorophyll covers the deep red emission region with a peak at about 660 nm. The phosphors with emissions overlapping the absorption spectra of plant photoreceptors can efficiently be utilized in the fabrication of red LEDs for plant growth.32,33
In this work we have utilized a gel-combustion technique to synthesize nanostructured YZOE and exposed it to different annealing temperatures to see if there was any observable photophysical change. The defects in the materials as a result of doping were probed using PALS, as they are known to have a very dominant role in fluorescence. Furthermore, the photoluminescence quantum yield (PLQY) was determined using an integrating sphere to harness the potential of YZOE for pc-LEDs. Electroluminescence (EL) measurement was carried out on the sample possessing the highest PLQY. The YZOE was further utilized to make a red LED and this was coupled with commercial green and blue phosphors to fabricate the wLED. The CRI and CCT values were improved by changing the composition of YZOE in the fabricated wLED. The thermal stability was also determined by carrying out in situ photoluminescence (PL) measurements. With a complete collection of photophysical measurements and physical characterization results, coupled with applications in pc-LEDs, the importance of this particular material as a potential candidate for red-emitting phosphor for commercial white light was highlighted. Also, the emission spectrum of the phosphor under study overlapped with the phytochrome absorption spectrum. Hence, this material can efficiently be utilized for plant growth applications.
2. Experimental
2.1. Synthesis
The starting materials used for the synthesis were: zirconium nitrate [Zr(NO3)2·5H2O, 99.9%], yttrium nitrate [Y(NO3)3·6H2O, 99.99%], europium nitrate [Eu(NO3)3·5H2O], and glycine (AR). Initially, the Zr(NO3)2·5H2O and the Y(NO3)3·6H2O solutions were prepared, and then mixed with an appropriate amount of glycine (fuel) solution. A suitable quantity of Eu(NO3)3·5H2O was added to have Eu doping of 5 mol% in the final product. Then the mixture was stirred for 2 h to obtain a transparent solution which was then introduced into a muffle furnace which was preheated at 500 °C. The solution was allowed to boil and this forms a voluminous foamy combustion residue. Next, the white powders obtained were ground and then annealed at 900 °C for 1 h. This sample was labeled as YZOE-900. The as prepared samples were further ground and annealed to 1000, 1100, 1200, or 1300 °C for 1 h, and they were labeled as YZOE-1000, YZOE-1100, YZOE-1200, and YZOE-1300, respectively.2.2. Characterization
To check the phase purity of the synthesized samples, X-ray diffraction (XRD) was carried out on a benchtop X-ray diffractometer with a step size of 0.02° and 2θ ranging from 15–80° with CuKα as the monochromatic source. The accelerating voltage and tube current were 30 kV and 20 mA, respectively. The Raman measurements were carried out on an AIRIX Corporation (formerly Seki) STR300 Laser Raman spectrometer. The spectrometer is equipped with a fiber-coupled diode-pumped solid-state laser (DPSS) with an excitation wavelength of 532 nm. The TEM measurements were obtained using a Jeol JEM-2100 electron microscope with an applied voltage of 200 kV. The particle size and d spacing were calculated using ImageJ software. The PL measurements were carried out on an Edinburgh Instruments FLS1000 spectrometer with xenon lamp as the excitation source and photomultiplier tube (PMT) as the detector. The lifetime decay measurements were made by using a microsecond flash lamp as the source. The absolute quantum yield value was obtained by integrating a sphere module into the spectrometer. The positron annihilation lifetimes were measured on powder samples using a positron annihilation lifetime spectrometer (PALS) constructed from two BaF2 scintillation detectors. The time resolution of the spectrometer was 243 ps and 10 μCi of Na-22 encapsulated in 8 μm polyimide film was used as the positron source. The spectra were analyzed using the PALSfit program. The EL properties and temperature-dependent PL characteristics were measured using an Ocean Optics Maya2000 Pro high-sensitivity spectrophotometer.3. Results and discussion
3.1. Physical characterization
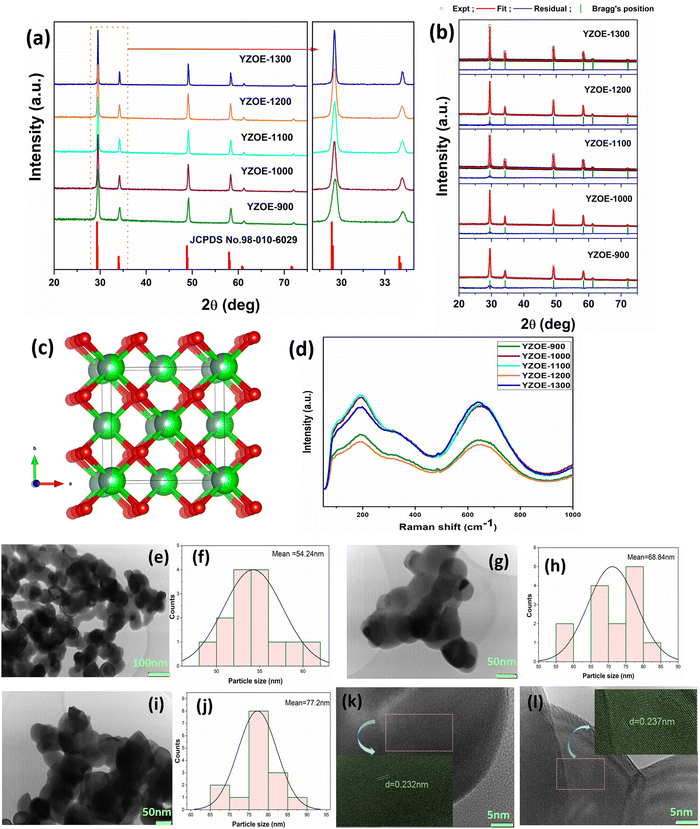
Fig. 1(a) shows the X-ray diffraction patterns of the as-prepared (at 900 °C) and the annealed YZOE materials at four different temperatures (1000 °C, 1100 °C, 1200 °C, 1300 °C). From Fig. 1 it is clear that the XRD pattern matches with the standard pattern for Y2Zr2O7 shown in JCPDS no. 98-010-6029 which suggests the phase purity of the materials. No other additional peaks from the precursors or impurity are seen in the XRD pattern. The main peaks were at 29.7°, 34.4°, 49.5°, 58.8°, 61.7°, and 72.6° which corresponds to the (222), (400), (440), (622), (444), and (800) crystal planes, respectively, with the defect fluorite structure and the space group Fm![[3 with combining macron]](https://www.rsc.org/images/entities/char_0033_0304.gif) m. The crystal structure for the defect fluorite is shown in Fig. 1(c). The enlarged XRD spectrum, shown to the right side, in the angle range from 28° to 37° shows the high intensity peaks. It is clear from the figure that with the increase in the annealing temperature the full width at half maximum (FWHM) of the peak is reduced from 900 to 1300 °C. Such a thermally induced peak narrowing is attributed to the increase in the particle size with temperature, which was also confirmed from the TEM study. Fig. 1(b) shows the Rietveld analysis of all the synthesized materials, and the cell parameter values are shown in Table 1. It was clear that with the increase in the annealing temperature, the cell parameters and cell volume had increased slightly. Fig. 1(d) shows the Raman spectra of all the materials. The weak intensity peak at 483 cm−1 was due to the A1g mode responsible for the Zr–O bending mode,34 and the high intensity peak at 650 cm−1 corresponds to the F2g mode.35 The ideal pyrochlore structure is known to possess a unique sextet feature in the Raman spectra enabled by six different vibrational modes 4F2g + Eg + A1g. However, the defect fluorite structure shows broad Raman bands because seven O2− ions are distributed randomly over the eight anionic sites leading to a high level of structural disordering.36
m. The crystal structure for the defect fluorite is shown in Fig. 1(c). The enlarged XRD spectrum, shown to the right side, in the angle range from 28° to 37° shows the high intensity peaks. It is clear from the figure that with the increase in the annealing temperature the full width at half maximum (FWHM) of the peak is reduced from 900 to 1300 °C. Such a thermally induced peak narrowing is attributed to the increase in the particle size with temperature, which was also confirmed from the TEM study. Fig. 1(b) shows the Rietveld analysis of all the synthesized materials, and the cell parameter values are shown in Table 1. It was clear that with the increase in the annealing temperature, the cell parameters and cell volume had increased slightly. Fig. 1(d) shows the Raman spectra of all the materials. The weak intensity peak at 483 cm−1 was due to the A1g mode responsible for the Zr–O bending mode,34 and the high intensity peak at 650 cm−1 corresponds to the F2g mode.35 The ideal pyrochlore structure is known to possess a unique sextet feature in the Raman spectra enabled by six different vibrational modes 4F2g + Eg + A1g. However, the defect fluorite structure shows broad Raman bands because seven O2− ions are distributed randomly over the eight anionic sites leading to a high level of structural disordering.36
| Annealing temperature (°C) | Lattice parameters a = b = c (Å) | Unit cell volume (Å3) |
|---|---|---|
| 900 | 5.2414 (8) | 144.00 (4) |
| 1000 | 5.2431 (5) | 144.14 (1) |
| 1100 | 5. 2427 (7) | 144.10 (3) |
| 1200 | 5.2444 (6) | 144.24 (4) |
| 1300 | 5.2399 (2) | 143.87 (1) |
Fig. 1(e), (g), and (i) represent the TEM images and Fig. 1(f), (h), and (j) represent the particle size distributions of YZOE-900, YZOE-1000, and YZOE-1200, respectively. It is clearly seen that most of the particles have a nanospherical shape, although many of them adhere to each other to form small aggregates. From the size distribution plot, it can be seen that there was an increase in the particle size from ∼54 to 77 nm. Also, with the increase in the annealing temperature, the crystalline growth of the particles can be seen. Fig. 1(k) and (l) show the high-resolution TEM (HRTEM) images of YZOE-1000 and YZOE-1200, and the insets show the magnified images with the lattice fringes. From these images, the lattice crystallographic orientation of the YZOE particles can be seen clearly, which suggests the presence of nano-polycrystals. The lattice fringes with the interplanar spacing value of 0.232/0.237 are assigned to the crystal planes of 2θ = 29.89 which suggests the formation of high quality cubic YZOE nanocrystals.
3.2. Time resolved photoluminescence
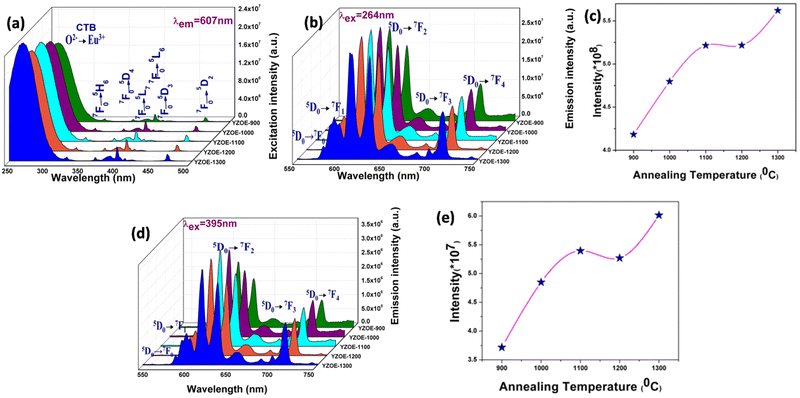
Fig. 2(a) shows the excitation spectra of the as-prepared sample as well as the annealed samples, with an emission wavelength of 607 nm. The spectra consist mainly of seven peaks, the one at 260 nm is due to the combined host absorption band and the charge transfer from O2− → Eu3+.37 The other peaks are due to the intra 4f → 4f transitions, and they are at 321, 362, 383, 393, 418, and 465 nm that correspond to the 7F0 → 5H67F0 → 5D4, 7F0 → 5L7, 7F0 → 5L6, 7F0 → 5D3, and 7F0 → 5D2 transitions, respectively.Fig. 2(b) and (d) are the emission spectra of the YZOE nanocrystals with excitation wavelengths of 265 and 395 nm, respectively, in which the former is the charge transfer band excitation, whereas the latter is the direct excitation of the europium. Both represent the same spectral features of Eu3+ with a difference in their intensities. There are mainly five peaks which are due to the 5D0 → 7FJ (J = 0–4) transitions that can be observed in both spectra. The peaks at 579 and 712 nm correspond to the 5D0 → 7F0 and 5D0 → 7F4 transitions, respectively, which are electric dipole transitions. The 5D0 → 7F1 transition is allowed by a magnetic dipole transition with a peak at 593 nm. The peak at 655 nm is due to the 5D0 → 7F3 transition which is neither allowed by an electric or by a magnetic dipole transition. The higher intense transition at 610–630 nm is due to the 5D0 → 7F2 transition which is hypersensitive due to the forced electric dipole transition. Fig. 2(c) and (e) represent the intensity of the 5D0 → 7F2 peak with the annealing temperature for both the 264 and 395 nm excitation. As can be seen from the emission spectra, the 5D0 → 7F2 transition has a higher intensity compared to the 5D0 → 7F1 transition, which suggests that the surrounding environment of Eu is highly asymmetric and lacks a center of inversion. This is enabled by the fact that the former originates from hypersensitive electric dipole transitions whereas the latter is enabled by pure magnetic dipole transitions.38 In the defect pyrochlore Y2Zr2O7, both Y3+ and Zr4+ had a coordination number of 7, and the corresponding ionic radii were 96 and 78 pm, and for Eu3+ with a coordination number of 7, the ionic radius was 101 pm. Because of the close size as well as the charge matching, the Eu3+ tends to occupy the Y3+ site. However, we cannot rule out some fraction of the Eu3+ occupying the Zr4+ site with the additional creation of oxygen vacancies and antisite defects to compensate for the charge imbalance.
It can be seen from both Fig. 2(c) and (e) that the emission intensity increases monotonically with an increase in the annealing temperature with a slight dip at 1200 °C. The increase of PL emission with the increase in annealing temperature was ascribed to the reduction in surface states which are known to provide non-radiative channels and lead to the reductions in PL and PLQY.39
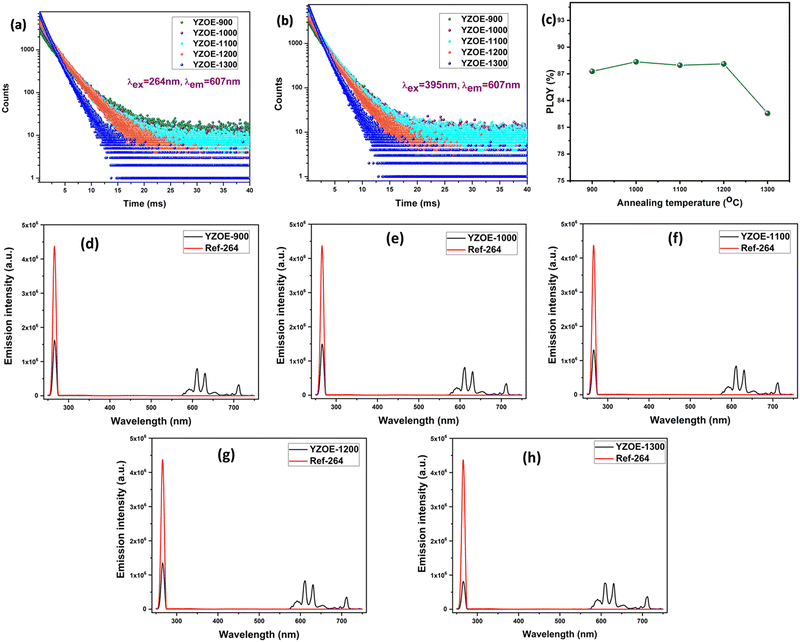
Fig. 3(a) shows the decay curve of all the samples with an excitation wavelength of 264 nm and an emission wavelength of 607 nm, and Fig. 3(b) shows the decay curve with an excitation wavelength of 395 nm and an emission wavelength of 607 nm. Both the decay curves can be fitted into the bi-exponential equation which is given by:
 | (1) |
| Sample | λ ex = 264 nm, λem = 607 nm | λ ex = 395 nm, λem = 607 nm | ||||||
|---|---|---|---|---|---|---|---|---|
| τ 1 (ms) | τ 2 (ms) | Population of τ1 (%) | Population of τ2 (%) | τ 1 (ms) | τ 2 (ms) | Population of τ1 (%) | Population of τ2 (%) | |
| YZOE-900 | 1.7 | 3.7 | 15.2 | 84.8 | 1.6 | 3.3 | 15.2 | 85.8 |
| YZOE-1000 | 1.6 | 3.5 | 12.1 | 87.9 | 1.6 | 3.3 | 16.4 | 83.6 |
| YZOE-1100 | 1.6 | 3.4 | 14.2 | 85.8 | 1.5 | 3.2 | 18.6 | 81.4 |
| YZOE-1200 | 1.5 | 3.3 | 10.6 | 89.4 | 1.4 | 2.9 | 10.9 | 89.1 |
| YZOE-1300 | 1.1 | 2.2 | 19.5 | 80.5 | 1.1 | 2.1 | 19.4 | 80.6 |
Fig. 3(c) is the plot of the absolute quantum yield against temperature, which was evaluated by using a barium sulfate coated integrating sphere as the reflectance standard background. With the increase in the annealing temperature, it was observed that there was an enhancement in the quantum yield up to 88.2% at 1200 °C, and a further increase in the annealing temperature reduced the quantum yield to 82.5%. The value of the internal quantum efficiency was calculated using eqn (2):40,41
 | (2) |
Normally nanocrystalline samples have a lower PLQY value because of poor crystallinity and a high density of surface defects compared to their bulk counterparts. In this work we demonstrated that the YZOE nanocrystalline sample showed very high absolute PLQY of ∼88%. This could have arisen from a very high concentration of Eu3+ ion occupying the Y3+ site which invoked no charge compensating defects, and minimal lattice strain because of the close size and charge matching. The corresponding spectrograms for all the samples are plotted in Fig. 3(d)–(h).
3.3. Defect evolution as a function of annealing temperature
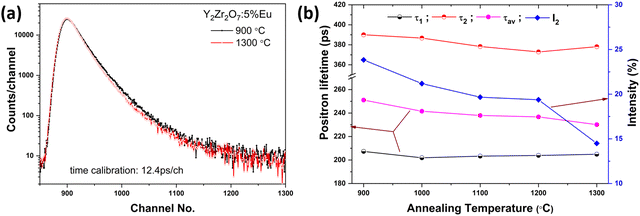
The positron lifetime spectra (Fig. 4(a)) were analyzed with appropriate corrections for positron annihilations in the polyimide film which encapsulated the Na-22. The spectra were fitted well to the sum of three exponentials or three lifetimes. The longest lifetime component in all of the samples was about 1.6–2.0 ns with only <1% contribution. However, the inclusion of this lifetime component was necessary to improve the quality of the fitting of the spectra. A lifetime component in this range with poor intensities is well known in powder samples and is attributed to the positronium formation on the surface of the particles and the intergranular spaces.The other two positron lifetimes (τ1 and τ2), intensity of the second positron lifetime component (I2, I1 ∼ 100 − I2) and the average positron lifetime (τav) calculated as the intensity weighted average of the two positron lifetimes in the samples annealed at different temperatures, are shown in Fig. 4(b). Positron annihilation lifetimes are reported on similar compounds in the literature. Gregg et al.42 reported a single positron lifetime of 211 ps in Gd2Zr2O7 whereas Gumber et al.43 reported an average lifetime of 218.5 ps. Two lifetime components were observed earlier in Nd2Zr2O7 annealed at different temperatures39 and in Sm doped Gd2Zr2O7.44 In all these systems where two positron lifetime components were observed, the first component was due to the positron annihilations in the bulk whereas the second component was due to the positron annihilations in the defects. It can be seen from Fig. 4(b); the variation in τ1 with an increase in annealing temperature is marginal. A small but monotonous decrease was observed in the second positron lifetime component. The intensity of the second positron lifetime or the fraction of positrons trapped in the defects which reflected the defect concentration decreased with the increase in annealing temperature. This decrease was significant in the sample annealed at 1300 °C. The average positron lifetime also showed a gradual decrease with the increase in annealing temperature. The change in the average lifetime with annealing temperature was similar to earlier observations on Nd2Zr2O7.39
3.4. Temperature-dependent photoluminescence studies
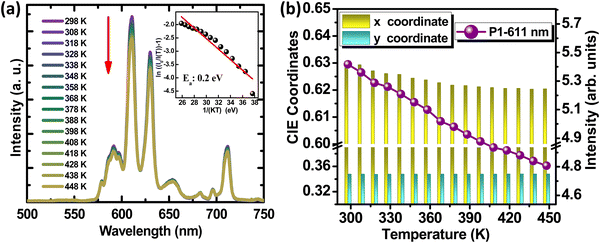
Fig. 5(a) shows the variation of PL intensity for the representative sample, YZOE-1200, under 280 nm excitation for a range of temperatures starting from room temperature to 448 K. Even though the emission intensity was exhibiting a decreasing trend with the rise in temperature, its value at 428 K was estimated to be about 88.9% of that of the room temperature intensity. This implied that the phosphor had adequate thermal stability making it useful for lighting applications. As seen in the inset of Fig. 5(a), the activation energy for thermal quenching could be evaluated from the relationship between the relative emission intensities and the corresponding temperature using eqn (3): | (3) |
The thermal stability, activation energy, and color purity of various recently reported Eu3+ doped phosphors, together with their excitation and emission peaks, are listed in Table 3. It was observed that the YZOE-1200 phosphor had a comparatively higher activation energy, exhibiting a high thermal stability (I(T)/I0 = 88.9% at 423 K). Hence, this nanophosphor with high color purity can efficiently be utilized for phosphor-converted white LED applications.
| Sample | λ ex (nm) | λ em (nm) | I (423 K)/I0 (%) | E a (eV) | Color purity (%) | Ref. |
|---|---|---|---|---|---|---|
| ZnAl2O4:Eu3+ | 394 | 614 | 87.59 | 0.11 | 90.39 | 46 |
| ZnAl2O4:Eu3+, Li+ | 394 | 614 | 96.03 | 0.14 | 92.02 | 46 |
| Y2SiWO8:Eu3+ | 395 | 619 | 81.7 | 0.12 | 96.6 | 47 |
| Ca3Al2Ge3O12:Eu3+ | 394 | 707 | 78.8 | 0.16 | — | 48 |
| CaMgGeO4:Eu3+, Li+ | 464 | 612 | 77 | 0.19 | 94 | 49 |
| Sr2InTaO6:Eu3+ | 396 | 624 | 66.4 | 0.20 | 96.4 | 8 |
| YZOE-1200 | 280 | 611 | 88.9 | 0.20 | 97 | This work |
3.5. LED fabrication
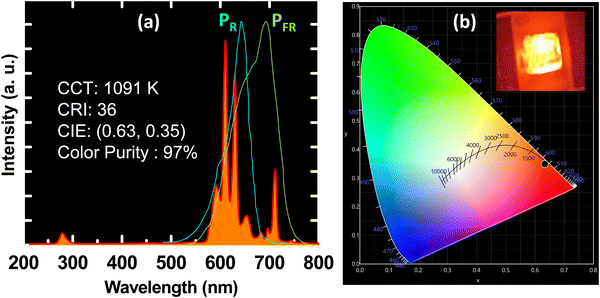 | ||
| Fig. 6 (a) The electroluminescence spectra for the YZOE samples under 280 nm LED, and (b) the CIE color diagram with the corresponding LED image under 280 nm excitation. | ||
An efficient plant growth application using the red YZOE-1200 pyrochlore phosphors has also been identified. As shown in Fig. 6(a), the EL spectrum of Eu3+ is actually situated in the overall PR and PFR regions. Particularly, the 5D0–7F4 peak located at 700 nm overlapped with the intense PFR peak, which was crucial in stimulating seed propagation and plant growth.51–53 Hence, as a smart approach, the deep red emission of the developed optimized red emitting phosphor can be utilized to fabricate deep red pc-LEDs for use as a promising artificial light source for cultivating indoor plants.52,53
![[thin space (1/6-em)]](https://www.rsc.org/images/entities/char_2009.gif) :
:![[thin space (1/6-em)]](https://www.rsc.org/images/entities/char_2009.gif) 2
2![[thin space (1/6-em)]](https://www.rsc.org/images/entities/char_2009.gif) :
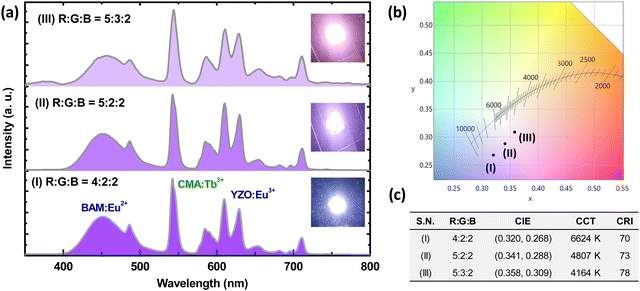
:![[thin space (1/6-em)]](https://www.rsc.org/images/entities/char_2009.gif) 2 showed a bright but cool white light, with a luminous efficacy of radiation (LER) of 239 lm W−1, a CCT of 6624 K, a CRI (Ra) of 70, and CIE chromaticity coordinates of (0.320, 0.268). Such a bright cool white light was visible from the digital image of the fabricated pc-LED, as shown in inset (I) of Fig. 7(a). By tuning the RGB mixing ratio to 5
2 showed a bright but cool white light, with a luminous efficacy of radiation (LER) of 239 lm W−1, a CCT of 6624 K, a CRI (Ra) of 70, and CIE chromaticity coordinates of (0.320, 0.268). Such a bright cool white light was visible from the digital image of the fabricated pc-LED, as shown in inset (I) of Fig. 7(a). By tuning the RGB mixing ratio to 5![[thin space (1/6-em)]](https://www.rsc.org/images/entities/char_2009.gif) :
:![[thin space (1/6-em)]](https://www.rsc.org/images/entities/char_2009.gif) 3
3![[thin space (1/6-em)]](https://www.rsc.org/images/entities/char_2009.gif) :
:![[thin space (1/6-em)]](https://www.rsc.org/images/entities/char_2009.gif) 2, warm white light with the LER of 233 lm W−1, CCT of 4164 K, Ra of 78, and CIE of (0.358, 0.309) has been produced from the fabricated pc LED, as appeared in the inset (III) of Fig. 7(a). These characteristic features are the ultimate requirements for indoor lighting for strain free viewing.
2, warm white light with the LER of 233 lm W−1, CCT of 4164 K, Ra of 78, and CIE of (0.358, 0.309) has been produced from the fabricated pc LED, as appeared in the inset (III) of Fig. 7(a). These characteristic features are the ultimate requirements for indoor lighting for strain free viewing.
4. Conclusion
In this work we have synthesized bright and thermally stable, deep red emitting YZOE nanoparticles using gel combustion. The synthesized nanoparticles were subjected to a complete quality check using XRD, Raman spectroscopy, TEM, and PALS. A PLQY of more than 80% was achieved in all the samples, and samples annealed at 1200 °C showed a maximum PLQY of ∼89%. The same particles were utilized in designing a pc-LED which showed a deep red emission with a CIE index value matching closely with that of a commercial red phosphor, and with improved color purity and excellent thermal stability. The deep red emission of the YZOE-1200 nanoparticles significantly overlapped with the absorption of phytochrome (PFR), suggesting that this material showed a good potential for moderating plant growth. For evaluating the real-time device performance of the YZOE nanoparticles, a prototype wLED was fabricated by combining a 280 nm UV chip and a mixture of tri-color emitting phosphors. In fact, by tuning the RGB phosphor composition, both cool and warm w-LEDs were achieved. By tuning the RGB mixing ratio to 5![[thin space (1/6-em)]](https://www.rsc.org/images/entities/char_2009.gif) :
:![[thin space (1/6-em)]](https://www.rsc.org/images/entities/char_2009.gif) 3
3![[thin space (1/6-em)]](https://www.rsc.org/images/entities/char_2009.gif) :
:![[thin space (1/6-em)]](https://www.rsc.org/images/entities/char_2009.gif) 2, the resultant emission from the fabricated pc-LED appeared as a warm white light with a CCT of 4164 K, a Ra of 78, and a CIE of (0.358, 0.309), which was close to natural lighting.
2, the resultant emission from the fabricated pc-LED appeared as a warm white light with a CCT of 4164 K, a Ra of 78, and a CIE of (0.358, 0.309), which was close to natural lighting.
Conflicts of interest
There are no conflicts to declare.Acknowledgements
The authors would like to acknowledge Dr Sai Santosh Kumar Raavi, IIT Hyderabad for his help with the TEM measurements.References
- S. K. Gupta, K. Sudarshan, B. Modak and R. Gupta, Interstitial Zinc Boosted Light Tunability, Afterglow, and Ultrabright White Emission in Zinc Germanate (Zn2GeO4), ACS Appl. Electron. Mater., 2023, 5(2), 1286–1294 CrossRef CAS.
- H. Zhang, H. Zhang, A. Pan, B. Yang, L. He and Y. Wu, Rare earth-free luminescent materials for WLEDs: recent progress and perspectives, Adv. Mater. Technol., 2021, 6(1), 2000648 CrossRef CAS.
- Y. Liu, D. Yao and H. Zhang, Self-assembly driven aggregation-induced emission of copper nanoclusters: a novel technology for lighting, ACS Appl. Mater. Interfaces, 2017, 10(15), 12071–12080 CrossRef.
- A. Menéndez-Velázquez, D. Morales and A. B. García-Delgado, Sunlike white light-emitting diodes based on rare-earth-free luminescent materials, Materials, 2022, 15(5), 1680 CrossRef.
- S. K. Gupta, K. Sudarshan and R. Kadam, Optical nanomaterials with focus on rare earth doped oxide: A Review, Mater. Today Commun., 2021, 27, 102277 CrossRef CAS.
- J. McKittrick and L. E. Shea-Rohwer, Down conversion materials for solid-state lighting, J. Am. Ceram. Soc., 2014, 97(5), 1327–1352 CrossRef CAS.
- Y. Zhang, J. Xu, Q. Cui and B. Yang, Eu3+-doped Bi4Si3O12 red phosphor for solid state lighting: microwave synthesis, characterization, photoluminescence properties and thermal quenching mechanisms, Sci. Rep., 2017, 7(1), 42464 CrossRef CAS PubMed.
- J. Zhao, H. Gao, H. Xu, Z. Zhao, H. Bu, X. Cao, L. He, Z. Yang and J. Sun, Structure and photoluminescence of Eu3+ doped Sr2InTaO6 red phosphor with high color purity, RSC Adv., 2021, 11(14), 8282–8289 RSC.
- S. K. Gupta, R. M. Kadam and P. K. Pujari, Lanthanide spectroscopy in probing structure-property correlation in multi-site photoluminescent phosphors, Coord. Chem. Rev., 2020, 420, 213405 CrossRef CAS.
- J. Tian and W. Zhuang, Thermal stability of nitride phosphors for light-emitting diodes, Inorg. Chem. Front., 2021, 8(22), 4933–4954 RSC.
- T. Hasegawa, M. Iwaki, R. Tanaka, S.-W. Kim, S. Yin and K. Toda, Phase stabilization of red-emitting olivine-type NaMgPO4:Eu2+ phosphors via molten-phase quenching, Inorg. Chem. Front., 2020, 7(21), 4040–4051 RSC.
- X. Huang, Red phosphor converts white LEDs, Nat. Photonics, 2014, 8(10), 748–749 CrossRef CAS.
- J. Meyer and F. Tappe, Photoluminescent materials for solid-state lighting: state of the art and future challenges, Adv. Opt. Mater., 2015, 3(4), 424–430 CrossRef CAS.
- S. K. Gupta, J. P. Zuniga, M. Abdou, P. S. Ghosh and Y. Mao, Optical properties of undoped, Eu3+ doped and Li+ co-doped Y2Hf2O7 nanoparticles and polymer nanocomposite films, Inorg. Chem. Front., 2020, 7(2), 505–518 RSC.
- J. Xie, L. Cheng, H. Tang, Z. Wang, H. Sun, L. Lu, X. Mi, Q. Liu and X. Zhang, Wide range color tunability and efficient energy transfer of novel NaCaGd(WO4)3:Tb3+,Eu3+ phosphors with excellent thermal stability for pc-WLEDs, Inorg. Chem. Front., 2021, 8(20), 4517–4527 RSC.
- S. K. Gupta, J. P. Zuniga, M. Abdou, M. P. Thomas, M. De Alwis Goonatilleke, B. S. Guiton and Y. Mao, Lanthanide-doped lanthanum hafnate nanoparticles as multicolor phosphors for warm white lighting and scintillators, Chem. Eng. J., 2020, 379, 122314 CrossRef CAS.
- M. Qu, H. Li, Y. Zhao and X.-M. Zhang, Single-Component Color-Tunable Gd(pic)3:Eu3+ Phosphor Based on a Metal–Organic Framework for Near-UV White-Light-Emitting Diodes, ACS Omega, 2019, 4(2), 3593–3600 CrossRef CAS PubMed.
- D. F. Sava, L. E. Rohwer, M. A. Rodriguez and T. M. Nenoff, Intrinsic broad-band white-light emission by a tuned, corrugated metal–organic framework, J. Am. Chem. Soc., 2012, 134(9), 3983–3986 CrossRef CAS.
- M. Jiao, N. Guo, W. Lü, Y. Jia, W. Lv, Q. Zhao, B. Shao and H. You, Synthesis, structure and photoluminescence properties of europium-, terbium-, and thulium-doped Ca3Bi(PO4)3 phosphors, Dalton Trans., 2013, 42(34), 12395–12402 RSC.
- W. Geng, X. Zhou, A. Deng, W. Li and L. Zhao, Multiple charge transfer bands induced broad excitation Eu3+ red emission in a vanadium phosphate system for white light-emitting diodes, Inorg. Chem., 2022, 61(21), 8291–8297 CrossRef CAS PubMed.
- Y. Zhuo, S. Hariyani, E. Armijo, Z. Abolade Lawson and J. Brgoch, Evaluating thermal quenching temperature in Eu3+-substituted oxide phosphors via machine learning, ACS Appl. Mater. Interfaces, 2019, 12(5), 5244–5250 CrossRef.
- A. Balhara, S. K. Gupta, G. D. Patra, B. Modak, J. Prakash, K. Sudarshan and M. Mohapatra, Stabilization of Eu2+ in Li2B4O7 with the BO3 network through U6+ co-doping and defect engineering, Phys. Chem. Chem. Phys., 2023, 25(3), 1889–1902 RSC.
- H. Li, H. M. Noh, B. K. Moon, B. C. Choi, J. H. Jeong, K. Jang, H. S. Lee and S. S. Yi, Wide-band excited Y6(WMo)0.5O12:Eu red phosphor for white light emitting diode: structure evolution, photoluminescence properties, and energy transfer mechanisms involved, Inorg. Chem., 2013, 52(19), 11210–11217 CrossRef CAS PubMed.
- S. K. Gupta, M. Mohapatra, S. Kaity, V. Natarajan and S. V. Godbole, Structure and site selective luminescence of sol–gel derived Eu:Sr2SiO4, J. Lumin., 2012, 132(6), 1329–1338 CrossRef CAS.
- K. Singh, M. Rajendran, R. Devi and S. Vaidyanathan, Narrow-band red-emitting phosphors with high color purity, trifling thermal and concentration quenching for hybrid white LEDs and Li3Y3BaSr(MoO4)8:Sm3+, Eu3+-based deep-red LEDs for plant growth applications, Inorg. Chem., 2022, 61(6), 2768–2782 CrossRef CAS PubMed.
- M. Rajendran and S. Vaidyanathan, Systematic investigation of Eu3+ activated Na2Ln4(MoO4)7 [Ln = La, Gd and Y] narrow band red emitting phosphors for hybrid white LEDs and plant growth, New J. Chem., 2020, 44(35), 14823–14836 RSC.
- M. Pokhrel, S. K. Gupta, A. Perez, B. Modak, P. Modak, L. A. Lewis and Y. Mao, Up- and Down-Convertible LaF3:Yb,Er Nanocrystals with a Broad Emission Window from 350 nm to 2.8 μm: Implications for Lighting Applications, ACS Appl. Nano Mater., 2021, 4(12), 13562–13572 CrossRef CAS.
- S. K. Gupta, B. Modak, P. Modak and Y. Mao, White light emission from co-doped La2Hf2O7 nanoparticles with suppressed host → Eu3+ energy transfer via a U6+ co-dopant, Inorg. Chem. Front., 2021, 8, 3830–3842 RSC.
- T. Sreena, P. P. Rao, A. K. Raj and T. A. Thara, Exploitation of Eu3+ red luminescence through order–disorder structural transitions in lanthanide stannate pyrochlores for warm white LED applications, Phys. Chem. Chem. Phys., 2018, 20(37), 24287–24299 RSC.
- Q. Sun, S. Wang, B. Devakumar, L. Sun, J. Liang and X. Huang, Synthesis, crystal structure, and photoluminescence characteristics of high-efficiency deep-red emitting Ba2GdTaO6:Mn4+ phosphors, ACS Omega, 2019, 4(8), 13474–13480 CrossRef CAS PubMed.
- L. Sun, B. Devakumar, J. Liang, S. Wang, Q. Sun and X. Huang, Novel high-efficiency violet-red dual-emitting Lu2GeO5:Bi3+,Eu3+ phosphors for indoor plant growth lighting, J. Lumin., 2019, 214, 116544 CrossRef CAS.
- J. Long, X. Yuan, C. Ma, M. Du, X. Ma, Z. Wen, R. Ma, Y. Wang and Y. Cao, Strongly enhanced luminescence of Sr4Al14O25:Mn4+ phosphor by co-doping B3+ and Na+ ions with red emission for plant growth LEDs., RSC Adv., 2018, 8(3), 1469–1476 RSC.
- M. Rajendran and S. Vaidyanathan, Zero-concentration quenching: a novel Eu3+ based red phosphor with non-layered crystal structure for white LEDs and NaSrY(MoO4)3:Sm3+ based deep-red LEDs for plant growth, Dalton Trans., 2020, 49(27), 9239–9253 RSC.
- M. de los Reyes, K. R. Whittle, Z. Zhang, S. E. Ashbrook, M. R. Mitchell, L.-Y. Jang and G. R. Lumpkin, The pyrochlore to defect fluorite phase transition in Y2Sn2−xZrxO7, RSC Adv., 2013, 3(15), 5090–5099 RSC.
- S. K. Gupta, M. A. P. Garcia, J. P. Zuniga, M. Abdou and Y. Mao, Visible and ultraviolet upconversion and near infrared downconversion luminescence from lanthanide doped La2Zr2O7 nanoparticles, J. Lumin., 2019, 214, 116591 CrossRef CAS.
- S. K. Gupta, M. Abdou, P. S. Ghosh, J. P. Zuniga and Y. Mao, Thermally induced disorder–order phase transition of Gd2Hf2O7:Eu3+ nanoparticles and its implication on photo-and radioluminescence, ACS Omega, 2019, 4(2), 2779–2791 CrossRef CAS.
- M. Keskar, S. K. Gupta, R. Phatak, S. Kannan and V. Natarajan, Optical properties of Eu3+ activated thorium molybdate and thorium tungstate: Structure, local symmetry and photophysical properties, J. Photochem. Photobiol., A, 2015, 311, 59–67 CrossRef CAS.
- R. Mani, H. Jiang, S. K. Gupta, Z. Li and X. Duan, Role of Synthesis Method on Luminescence Properties of Europium(II, III) Ions in β-Ca2SiO4: Probing Local Site and Structure, Inorg. Chem., 2018, 57(3), 935–950 CrossRef CAS PubMed.
- S. K. Gupta, K. Sudarshan, P. Ghosh, A. Srivastava, S. Bevara, P. Pujari and R. Kadam, Role of various defects in the photoluminescence characteristics of nanocrystalline Nd2Zr2O7: an investigation through spectroscopic and DFT calculations, J. Mater. Chem. C, 2016, 4(22), 4988–5000 RSC.
- K. Li, H. Lian, M. Shang and J. Lin, A novel greenish yellow-orange red Ba3Y4O9:Bi3+,Eu3+ phosphor with efficient energy transfer for UV-LEDs, Dalton Trans., 2015, 44(47), 20542–20550 RSC.
- J. Zhong, D. Chen, Y. Zhou, Z. Wan, M. Ding, W. Bai and Z. Ji, New Eu3+-activated perovskite La0.5Na0.5TiO3 phosphors in glass for warm white light emitting diodes, Dalton Trans., 2016, 45(11), 4762–4770 RSC.
- D. J. Gregg, Z. Zhang, G. J. Thorogood, B. J. Kennedy, J. A. Kimpton, G. J. Griffiths, P. R. Guagliardo, G. R. Lumpkin and E. R. Vance, Cation antisite disorder in uranium-doped gadolinium zirconate pyrochlores, J. Nucl. Mater., 2014, 452(1–3), 474–478 CrossRef CAS.
- N. Gumber, R. V. Pai, R. Phatak, B. Adiraju, M. Sahu, J. Jagannath and K. Sudarshan, Synthesis, characterization and crystal chemistry of uranium and cerium doped yttrium titanate pyrochlore: A potential waste immobilization matrix, J. Nucl. Mater., 2021, 556, 153191 CrossRef CAS.
- S. K. Gupta, C. Reghukumar, K. Sudarshan, P. Ghosh, N. Pathak and R. Kadam, Orange-red emitting Gd2Zr2O7:Sm3+: Structure-property correlation, optical properties and defect spectroscopy, J. Phys. Chem. Solids, 2018, 116, 360–366 CrossRef CAS.
- Z. Zhou, J. Zheng, R. Shi, N. Zhang, J. Chen, R. Zhang, H. Suo, E. M. Goldys and C. Guo, Ab initio site occupancy and far-red emission of Mn4+ in cubic-phase La(MgTi)1/2O3 for plant cultivation, ACS Appl. Mater. Interfaces, 2017, 9(7), 6177–6185 CrossRef CAS PubMed.
- A. De, B. Samanta, A. K. Dey, N. Chakraborty, T. K. Parya, S. Saha and U. K. Ghorai, ZnAl2O4:Eu3+ nanoparticle phosphors co-doped with Li+ for red light-emitting diodes, ACS Appl. Nano Mater., 2021, 5(1), 331–340 CrossRef.
- S. Wang, C. Xu and X. Qiao, High thermal stability and color purity of red-emitting phosphor Y2SiWO8: Eu3+ for w-LEDs: synthesis and photoluminescence properties, Ceram. Int., 2021, 47(1), 1063–1075 CrossRef CAS.
- S. Miao, R. Shi, Y. Zhang, D. Chen and Y. Liang, Deep-Red Ca3Al2Ge3O12:Eu3+ Garnet Phosphor with Near-Unity Internal Quantum Efficiency and High Thermal Stability for Plant Growth Application, Adv. Mater. Technol., 2023, 2202103 CrossRef CAS.
- J. Huo, A. Yu, Q. Ni, D. Guo, M. Zeng, J. Gao, Y. Zhang and Q. Wang, Efficient energy transfer from trap levels to Eu3+ leads to antithermal quenching effect in high-power white light-emitting diodes., Inorg. Chem., 2020, 59(20), 15514–15525 CrossRef CAS PubMed.
- V. Kumar, S. Som, S. Dutta, S. Das and H. Swart, Red-light-emitting inorganic La2CaZnO5 frameworks with high photoluminescence quantum efficiency: theoretical approach, Mater. Des., 2016, 93, 203–215 CrossRef CAS.
- S. Som, A. Kunti, V. Kumar, V. Kumar, S. Dutta, M. Chowdhury, S. Sharma, J. Terblans and H. Swart, Defect correlated fluorescent quenching and electron phonon coupling in the spectral transition of Eu3+ in CaTiO3 for red emission in display application, J. Appl. Phys., 2014, 115(19), 193101 CrossRef.
- S. Wang, Y.-j Han, L. Shi, Y.-l Tong, Q.-q Zhao, J.-y Zhang, Z.-y Mao, Z.-f Mu, Z.-w Zhang and S.-l Niu, A new strategy to the phosphors for plant growth LEDs: Far red emission from the Ca9MY0.667(PO4)7 (M = Li, Na):Eu3+ phosphors due to the Eu3+: 5D0→ 7F4 transition, J. Lumin., 2020, 225, 117404 CrossRef CAS.
- T. Kurunthatil Kuttiat, M. Abraham, A. K. Kunti, N. Amador-Mendez, M. Tchernycheva and S. Das, Enriching the Deep-Red Emission in (Mg,Ba)3M2GeO8: Mn4+ (M = Al, Ga) Compositions for Light-Emitting Diodes, ACS Appl. Mater. Interfaces, 2023, 15(5), 7083–7101 CrossRef CAS PubMed.
| This journal is © The Royal Society of Chemistry 2023 |

