 Open Access Article
Preparation of an ultra-low profile and high peel strength copper foil with rice-grain microstructures†
Lijuan
Wang
,
Xiaowei
Fa
,
Yunzhi
Tang
 *,
Juan
Liao
,
Yuhui
Tan
 *,
Ning
Song
,
Jian
Huang
,
Zhen
Sun
,
Men
Zhao
,
Weifei
Liu
and
Man
Zhao
Faculty of Materials Metallurgy and Chemistry, Jiangxi University of Science and Technology, Ganzhou 341000, China. E-mail: tangyunzhi75@163.com; tyxcn@163.com
First published on 7th November 2023
Abstract
Driven by the booming development of signal transmission in 5G, the internet of vehicles and cloud computing, the trade-off between the low profile and high binding force of copper foil has become a prominent issue. Here, we prepared a novel copper foil (RG-VLP) with an ultra-low profile and high peel strength via electrodeposition. The physicochemical properties of the modified copper foils have been studied. The obtained results indicate that the surface of the copper foil exhibits an average diameter of 420 nm copper nanoparticles and a 52% higher surface area than bare copper foil, contributing to the improved peel strength from 0.05 to 0.5 N mm−1. Further contact angle research shows that the rice-grain copper nanoparticles reduced the surface energy of the copper foil by 42%, which agrees well with the significant improvement of the surface area ratio and peel strength. Besides, cyclic voltammetry tests show that the micro-coarsening process belongs to the three-dimensional transient nucleation type.
1. Introduction
As critical raw materials for PCB laminates, electrolytic copper foils have been widely used in electronic communications, medical devices and other fields and are well known as the “neural network” for signals, power transmission and communication of electronic products.1–3 With the development of fifth-generation mobile communication technology (5G), electrolytic copper foils are subjected to high-frequency and high-speed signal transmission. Usually, the increase of signal transmission frequency will aggravate the “skin effect”. When the signal is more concentrated on the surface of the conductor, the skin depth decreases, the equivalent resistance of the conductor increases, and the transmission process is more susceptible to problems such as “standing waves” and “reflections”, which means that the impact of copper foil surface roughness on signal loss increases exponentially.4–6 At high frequency signals (frequencies greater than 1 GHz), the effect of the roughness of the surface of the copper foil on the signal loss becomes more pronounced, which requires that the copper foil is developed in the direction of a very low profile. However, when the surface roughness of the copper foil decreases, the bond between the copper foil and the resin sheet will weaken.7,8 There is a mutually constraining relationship between the ultra-low profile and high peel strength.9–11 So, the surface microfine coarsening treatment technology for 5G electronic copper foils has become an urgent need for the future market.Recently, many researchers attempted to improve the bond between the copper foil and resin sheets by surface treatment.12 Cheng electrodeposited nickel–copper nanoparticle spots on the surface of the copper foil through the nickel sulfate plating solution. The result suggests that the peel strength of the copper foil was substantially improved, but its surface roughness value increased substantially.13 Most researchers consider the impact of coarsening treatment on the peel strength of the copper foil, concluding that the peel strength of the copper foil will increase with the increase of surface roughness.14 Lee discovered that dendritic copper nanoparticle morphology from Ti-containing electrolytes results in an increase in surface roughness.15 However, these coarsening processes cannot meet the requirements of both the ultra-low profile and high peel strength of the copper foil for high-frequency and high-speed signal transmission.16–18 To the best of our knowledge, research on the relationship between the micromorphology of coarsened copper nanoparticles and surface properties was seldom reported before.
As a continuous work for high-quality copper, we successfully prepared a copper foil (RG-VLP) with an ultra-low profile and high peel strength by electrodeposition. The impact of the microscopic morphology and three-dimensional profile of rice-grain copper nanoparticles was deeply investigated. The result showed that the rice-grain copper nanoparticles can significantly increase the surface area of the copper foil, and improve the peel strength remarkably.
2. Experimental
2.1 Experimental materials
As shown in Table S1 (ESI†), the composition of the plating solution mainly contains CuSO4, H2SO4 and a few additives. An iridium-plated titanium plate measuring 10 cm × 15 cm was used as an anode and a pure titanium plate was used as a cathode. The distance between the anode and the cathode was kept at 5 cm. All reagents mentioned are of analytical grade.2.2 Test methods
The surface morphology with treated coating was characterized using a scanning electron microscope (MLA650F, FEL), a laser confocal microscope (VK-150K), and an atomic force microscope (Bruker). The contact angle and surface energy of treated copper were measured three times repeatedly (Data physics). The electro-crystallization behavior was investigated via a three-electrode cell system of the electrochemical workstation to analyze the roughening process (660D, Shanghai Chenhua). The roughness of the copper foil surface was measured using a roughness meter (PS-10, Mahr). The peeling resistance of copper foils was measured using a peel strength tester (BLD-200N, Saichen). Additional characterization studies are available in the ESI.† (Rz and Ra represent the average values of the optical roughness for the copper foil surface, and Ra* and Rz* represent the average values of the probe roughness of the copper foil surface.)2.3. Experimental procedures
As depicted in Fig. 1, the experimental procedure includes five steps: the preparation of raw copper foil, micro-coarsening, curing treatment, heat resistant alloy treatment immersing silane and drying treatment. The copper foil treated by the surface treatment was rinsed with deionized water to avoid contaminating the subsequent reagents.The micro-coarsening treatment refers to the electroplating of copper nanoparticles on the surface of the copper foil to increase the surface area of the copper foil. Curing treatment is mainly deposits of another layer of copper on the surface of the roughened copper foil to prevent the copper powder from falling off and plays the role of fixing the copper nanoparticles. The purpose of the heat-resistant alloy treatment is to plate an alloy that is resistant to high-temperature oxidation on the surface of the copper foil so that the copper foil can withstand the lamination process without oxidation. Silane is an added antioxidant. The silane treatment further prevents the oxidation of copper foil.
The ultra-low profile raw copper foil was prepared via an electrochemical method. The experimental plating conditions were 20 A dm−2, a temperature of 50 °C, and a time of 225 s. And then, the matt side of the ultra-low profile copper foil was coarsened with a current density of 20 A dm−2 for 6 s at room temperature. Subsequently, the curing treatment was performed to reinforce coarse particles. The treatment time was controlled for 4 S, and the other conditions were the same as in the last step. The heat-resistant alloy layer was plated on the surface of the copper foil after curing. The current density was 5 A dm−2 and the treatment time was 3 s. After heat-resistant alloying, the copper foil was coated with the silane coupling agent. Finally, the copper foil was removed from the cathode plate and dried with a drier. A roughened layer of copper nanoparticles with the rice-grain microscopic morphology was observed by field emission scanning electron microscopy (SEM). The schematic diagram of the roughened layer is shown in Fig. S1 (ESI†). We named the familiar ultra-low profile copper foil VLP and called the novel material with rice-grain treatment coating RG-VLP.
3. Results and discussion
3.1 Microscopic morphology and surface distribution of copper nanoparticles
As shown in Fig. 2, the rice-grain copper nanoparticles were prepared on the surface of ultra-low profile copper foils via micro-coarsening. It is worth noting that some small-diameter spherical copper nanoparticles appeared in the vicinity of the rice-grain copper nanoparticles. This may be because that during the early stage of electrodeposition, spherical copper nanoparticles are preferentially formed at the tip due to the “tip effect”.19 Here, the nanoparticles grow into vertically oriented rice-grain copper nanoparticles in the later stages of electrodeposition. In contrast, the copper nanoparticles in the lower part are deposited later, resulting in the formation of spherical copper nanoparticles within a short period. As a result, predominantly rice-grained copper nanoparticles with a small number of spherical copper nanoparticles were formed (Fig. 2b). The average length of the long axis of the rice-grain copper nanoparticles is 850 nm, the average size of the short axis is 421 nm, and the ratio between the long and short axes is about 2.0. As further displayed in Fig. 2(d), the normal distribution diagram for the short axis size of the copper nanoparticles showed an apparent size grading phenomenon of the rice-grain copper nanoparticles. This verifies the interspersed distribution of rice-grained copper nanoparticles with small-diameter spherical copper nanoparticles. RG-VLP* was obtained by roughening the VLP foil as a substrate without adding any additives to the roughening solution. It should be noted that the other conditions of RG-VLP* and RG-VLP are the same. The surface micro-morphology of the copper foil was obtained as shown in Fig. 2(c). The size of the RG-VLP* copper nanoparticles is large and the shape is not uniform, which is not favorable for applications in 5G high-frequency signal transmission.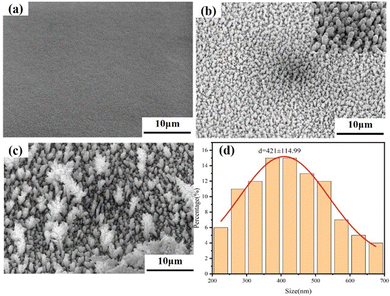 | ||
| Fig. 2 SEM characterization of the copper foil surface with a 10 μm scale for (a) VLP, (b) RG-VLP, and (c) RG-VLP*. (d) Normal distribution curve of the rice-grain copper nanoparticle diameter. | ||
3.2 AFM analysis of the micro-coarsening surface
The surface and cross-sectional profile of the copper foil were observed by atomic force microscopy (AFM) with a probe scan area of 40 × 40 μm2. As expected, the surface area of the copper foil was increased from 1628.8 μm2 to 2435.2 μm2 with the deposition of rice-grain copper nanoparticles. The surface area of RG-VLP was increased by 52.2% compared to that of VLP, wherein the surface area ratio of the copper foil was only 1.02 (Table 1). At the same time, it is noticed that the degree of cross-sectional undulation of the copper foil with the micro-coarsening treatment was denser than untreated samples. The cross-sectional profile of the copper foil reflects the uniform and dense distribution of the rice-grain copper nanoparticles, which is the main reason why the rice-grain copper nanoparticles can significantly increase the surface area of the copper foil (Fig. 3(d)). And the tiny undulations on the VLP surface shown in Fig. 3(b) are caused by the deposition of copper on the gross surface of the copper foil, consistent with the results with SEM and confocal microscopy. Furthermore, the cross-sectional profile may also reflect changes in the surface roughness of the copper foil. From laser confocal microscopy, it can be found that the surface optical roughness Rz of the copper foil is increased from 0.995 μm to 1.887 μm (Fig. S3, ESI†). This phenomenon indicates that the rice-grain copper nanoparticles can effectively enhance the surface area ratio of the copper foil within the 2.0 μm surface roughness.| Samples | Rz* (μm) | Ra* (μm) | Peel strength (N mm−1) | Surface area (μm2) | Surface area ratio |
|---|---|---|---|---|---|
| Rz* is the average sum of Rz1* to Rz5* obtained from 5 parallel tests conducted on different parts of the copper foil surface, and Ra* can be obtained in the same way. | |||||
| VLP | 1.048 | 0.109 | 0.05 | 1628.8 | 1.02 |
| RG-VLP | 1.632 | 0.209 | 0.50 | 2435.2 | 1.52 |
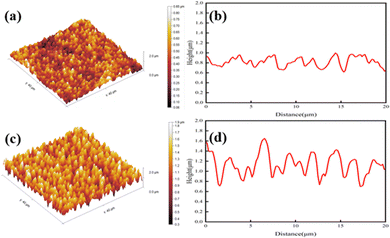 | ||
| Fig. 3 3D surface and cross-sectional morphology of the copper foil for (a) VLP, (b) VLP cross-sectional profile, (c) RG-VLP, and (d) RG-VLP cross-sectional profile. | ||
3.3. Impact of rice-grain copper nanoparticles on the surface roughness and peel strength of copper foils
The copper foil and PPO resin material were added into the laminating testing machine, and the laminating temperature was set at 180 °C, the average pressure was 300PIS, and the cycle length was 150 min. At the end of lamination, the copper foil was etched with FeCl3 solution. Finally, the copper foil after etching was tested for peel strength, and 10 parallel tests were conducted for data processing. After the micro-coarsening treatment, the roughness on the copper foil surface was slightly increased (Table 1). A low surface profile can avoid signal loss during high-frequency and high-speed transmission. The rice-grain copper nanoparticles significantly improve the peel strength. This is attributed to the copper particles arranged vertically like “rivets” embedded in the substrate. When it interacts with the HF resin plate, it can increase the contact area between the copper foil surface and the substrate. Usually, the ultra-low profile copper foil (VLP) is smooth and flat. The contact area between the copper foil and the substrate is small and does not create an “anchor” effect,20 and the peel strength is only 0.05 N mm−1 (Table 1). The peel strength of the RG-VLP copper foil is increased to 0.50 N mm−1, which is almost a ten-fold increase compared with the ultra-low-profile copper foil (Fig. 4(b)). The copper nanoparticles on the surface of RG-VLP* are disorganized and the particles are large, which is not conducive to the application of 5G high-frequency signal transmission. RG-VLP* has a surface roughness of 3.14 μm and a peel strength of only 0.57 N mm−1 (Fig. S6, ESI†). RG-VLP has a more suitable surface roughness and peel strength than VLP and RG-VLP*. In addition, the surface area of RG-VLP is much larger than that of VLP, agreeing well with the conclusion drawn by the CLSM and AFM structural morphology findings. Therefore, the rice-grain copper nanoparticles not only significantly improve the peel strength, but also maintain the low surface roughness, which meets both the requirements of high-frequency and high-speed materials for the 5G copper foil.16 | ||
| Fig. 4 (a) Copper foil surface roughness, peel strength and surface area ratio for VLP and RG-VLP. (b) Surface roughness, peel strength, and surface area increased rate for VLP and RG-VLP. | ||
3.4. Surface contact angle analysis of the micro-coarsening layer
It is well known that the surface contact angle can be used to calculate the surface free energy. The contact angles of water droplets and diiodomethane on VLP and RG-VLP are shown in Fig. 5, respectively. The contact angle of water droplets is usually greater than 90° due to its higher surface tension than organic solvents.21 As depicted in Fig. 5(b), the water contact angle on the RG-VLP surface was as high as 128.9°, while the water contact angle on the VLP surface was only 95.5°. The contact angle variation trend of diiodomethane on the copper foil with different surface morphologies is consistent with that of water. It is shown that the rice-grain copper nanoparticles make the surface roughness of the copper foil to increase. When the surface of the copper foil is rice-grain copper nanoparticles, the contact angle of diiodomethane on RG-VLP is 88.3°, while the contact angle on the VLP surface is 63.2°. According to the Cassie–Baxter model,22–24 the contact angle can be defined as the angle between the tangent of a boundary droplet and the plane of a solid surface. The droplet–gas–solid interface relationship can be obtained as solid surface wettability using the following formula.cos![[thin space (1/6-em)]](https://www.rsc.org/images/entities/char_2009.gif) θCA = fs (cos θCA = fs (cos![[thin space (1/6-em)]](https://www.rsc.org/images/entities/char_2009.gif) θflat + 1) − 1 θflat + 1) − 1 | (1) |
![[thin space (1/6-em)]](https://www.rsc.org/images/entities/char_2009.gif) θflat denote the contact angle between a rough solid surface and an ideal smooth surface droplet, respectively, and fs denotes the ratio of the solid surface vs. the droplet contact.
θflat denote the contact angle between a rough solid surface and an ideal smooth surface droplet, respectively, and fs denotes the ratio of the solid surface vs. the droplet contact.
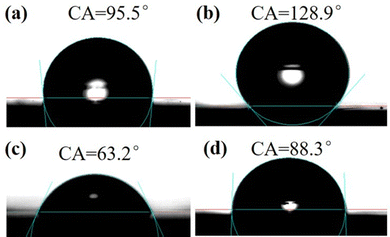 | ||
| Fig. 5 The water contact angles of (a) VLP and (b) RG-VLP. The diiodomethane contact angles of (c) VLP and (d) RG-VLP. | ||
The larger the value of fs, the higher the percentage of contact between the solid surface and the droplet.26 Combined with the analysis of the surface optical roughness (Rz) between VLP and RG-VLP (Table S3, ESI†), the contact area ratio (fs) between the droplet and the copper foil surface decreases when the surface roughness increases. Therefore, RG-VLP presents a higher surface roughness than that of VLP.
The solid surface free energy is related to the material surface roughness, composition of impurities and elemental distribution.25 The roughened layer is pure copper particles (is verified in the XRD tests in the ESI† (Fig. S2)). Since the additives and impurity components in electrolytes for roughening treatment are minimal and negligible, the surface energy of the copper foil is only related to its surface roughness. The calculated surface free energy (γS) with different morphologies of copper nanoparticles before and after micro-coarsening is shown in Table 2. The results showed that the surface energy of RG-VLP was 15.20 mN m−1, while the surface energy of VLP was 26.41 mN m−1. Furthermore, the surface roughness of RG-VLP increases after micro-coarsening treatment. Therefore, it has a lower surface free energy than it has before treatment. According to the previous document, the increase in the unit surface area leads to a lower surface free energy.27 The rice-grain copper nanoparticles significantly increase the copper foil's surface area and the substrate's bonding area, so RG-VLP has a lower surface free energy than VLP. Such a high surface area of RG-VLP is consistent with the results of AFM and peel strength tests.
| Sample | γ S (mN m−1) | γ pS (mN m−1) | γ dS (mN m−1) |
|---|---|---|---|
| γ pS is the solid surface free energy polar component and γdS is the solid surface free energy dispersion component. | |||
| VLP | 26.41 | 24.24 | 2.16 |
| RG-VLP | 15.20 | 14.92 | 0.28 |
3.5. Analysis of electro-crystallization behavior during the micro-coarsening process
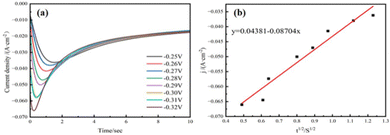
To investigate the copper electrocrystallization behavior during the micro-coarsening process, we measured the cyclic voltammetric curves (CV) at different sweep speeds. The working electrode in electrochemical tests is a titanium sheet electrode, the counter electrode is a platinum sheet electrode and the reference electrode is a Hg/HgCl2 electrode. As shown in Fig. 6(a). The reduction peak current density and peak potential shifted towards a negative direction with the increase of the scanning rate. This phenomenon indicates that the copper electrocrystallization reaction is irreversible in the micro-coarsening process.28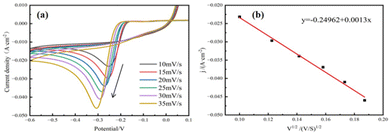 | ||
| Fig. 6 (a) CV curves of micro-coarsening solution at different sweep rates. (b) Linear fit of the reduction peak current density j to v1/2. | ||
In addition, the Randles–Sevcík equation29 is followed when the electrode reaction is under diffusion control. The measured peak current density j is fitted to ν1/2 to obtain the linear curve shown in Fig. 6(b). The linear fitting curve shows a good linear relationship between j and ν1/2. It is shown that copper electrodeposition during micro-coarsening is an irreversible reaction under diffusion control.30
To further investigate the nucleation mechanism during the micro-coarsening process, constant potential deposition transient profile tests were performed at different excitation potentials. The measured peak potential was subsequently fitted to the time curve to obtain the copper constant potential electrodeposition transient curve (I–t) (Fig. 7(a)). To the best of our knowledge, the copper electrocrystallization of the electrode surface at the early stage can be described as a short-period double-layer charging process. The current density increases sharply in a short period due to the nucleation and crystal growth of copper nuclei. When the current density reaches the peak, the current density decreases in the positive direction as the copper nuclei overlap each other. Finally, the equilibrium state of reducing and increasing the current density is reached, and the process possesses the typical characteristics of three-dimensional nucleation growth.31
According to the Scharifker-Hills theoretical model, the normalized currents for transient nucleation and continuous nucleation can be expressed by eqn (2) and (3):32
| I2/Im2 = 1.9542/(t/tm){1 − exp[−1.2564(t/tm)]}2 | (2) |
| I2/Im2 = 1.2254/(t/tm){1 − exp[−2.3367(t/tm)]}2 | (3) |
Finally, a dimensionless (I/Im)2–(t/tm)2 fit to the data from the copper constant potential transient curves at different potentials yields the actual curves of copper deposition as shown in Fig. 8. This shows that copper electro-crystallization tends to theoretically transient nucleation during micro-coarsening at each potential.
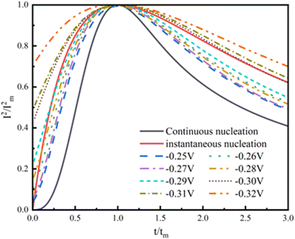 | ||
| Fig. 8 (I–Im)2−t/tm theoretical curve of transient nucleation and continuous nucleation during the micro-coarsening process. | ||
According to the Scharifker-Hills equation,33 the diffusion coefficient and the nucleation number density during the micro-coarsening copper electrocrystallization process can be calculated. As shown in Table 3, the nucleation density N0 increases exponentially when the potential tends to be negative. This indicates that the grain size formed by micro-coarsening becomes smaller with negative potentials. This may be due to the fact that the nucleation time shortens with the increasing negative direction potentials (Fig. 7(a)). The number of electrons gained on the surface of the copper foil decreases, and the size of the copper grains becomes small. At the same time, when the potential tends to be negative, and the diffusion coefficient D0 decreases accordingly, the reduction speed of Cu2+ to copper monomers in solution becomes slower; subsequently, the size of the grains becomes smaller.
| Potential/V | I m/(10−3 A cm−2) | t m/s | D 0/(10−7 cm2 s−1) | N 0/(105 cm−2) |
|---|---|---|---|---|
| −0.27 | −1.19 | 1.26 | 1.177 | 5.385 |
| −0.28 | −1.48 | 0.80 | 1.156 | 8.637 |
| −0.29 | −1.57 | 0.65 | 1.057 | 11.63 |
| −0.30 | −1.80 | 0.41 | 0.876 | 22.23 |
| −0.31 | −1.82 | 0.38 | 0.830 | 25.31 |
| −0.32 | −2.07 | 0.24 | 0.678 | 49.06 |
4. Conclusions
In conclusion, new micro-coarsening technology was conducted on the surface of an ultra-low profile copper foil, and the nano-sized rice-grain copper nanoparticles grew on the surface of the copper foil. In particular, the surface roughness of the copper foil is Rz* = 1.632 μm and Ra* = 0.209 μm. The surface area increased by 52% and the peel strength increased by 10 times after treatment. The surface free energy of the copper foil was reduced to 15.20 mN m−1, further confirming the high surface properties of the copper foil. Furthermore, the micro-coarsening process is an irreversible reaction under diffusion control, characterized by the typical feature of a three-dimensional transient nucleation growth model.Author contributions
Lijuan Wang: conceptualization, methodology, formal analysis, writing – original draft, writing – review and editing, and investigation. Xiaowei Fan and Yunzhi Tang: resources and supervision. Juan Liao and Yuhui Tan: data curation and methodology. Ning Song and Jian Huang: methodology and formal analysis. Zhen Sun, Men Zhao, Weifei Liu, and Man Zhao: formal analysis, resources, and supervision.Conflicts of interest
There are no conflicts to declare.Acknowledgements
The present work is financially supported by the National Natural Science Foundation of China (22365017), the Key Laboratory of Development and Application of Ionic Rare Earth Resource, Key R&D project of Jiangxi Province (20224BBE51045 and 20212BBE51018), the Jiangxi Education Department Project (GJJ210831) and the Key Research and Development Project of Jiangxi Province (20223BBH80010).References
- I. Taboada and H. Shee, Int. J. Logist. Res. Appl., 2021, 24(4), 392–406 CrossRef.
- J.-A. Marshall, Proc. Inst. Electr., 2015, 102, 251–259 Search PubMed.
- Y.-H. Kim, Y.-W. Lim and B.-S. Bae, ACS Appl. Mater. Interfaces, 2016, 8(13), 8335–8340 CrossRef CAS PubMed.
- G. Brist, S. Hall, S. Clouser and T. Liang, Circuitree, 2005, 18(5), 26–28 Search PubMed.
- E. Liew, T.-A. Okubo and T. Sudo, EDPA, 2014, 112–115 Search PubMed.
- G.-Y. Zhou, Y.-P. Tao, W. He, S.-X. Wang and Y. Hong, Appl. Surf. Sci., 2020, 513, 145718 CrossRef CAS.
- J. Guo, H. Wang, C. Zhang, Q. Zhang and H. Yang, Polymers, 2020, 12(9), 2073–4360 CrossRef PubMed.
- L. Jia, H. Yang, Y. Wang, B. Zhang, H. Liu and J. Hao, Opt. Laser Technol., 2021, 139, 106509 CrossRef.
- T. Devahif, Ultra Low Profile Coppeer Foil for Very Low Loss Material, Proceedings of SMTA International, USA, Rosemont, 2016, pp. 25–29.
- S. Ratna, P.-N. Vishwakarma and M. Ojha, J. Phys.: Condens. Matter, 2022, 2178(1), 1742–6588 Search PubMed.
- F. Liu, B. Wan, F. Wang and W. Chen, J. Air Waste Manage. Assoc., 2019, 69(12), 1490–1502 CrossRef CAS PubMed.
- B.-M. Luce and M.-L. Selker, Conducting element having improved bonding characteristics and method, US19610138881, 1966 Search PubMed.
- C. Luo and Y. Zhang, J. Mater. Process. Technol., 2021, 298, 0924 CrossRef.
- X.-R. Hu, H.-Z. Wang, H.-Q. Xu, C. Xu and W.-H. Wang, Electroplat. Surf. Finishing, 2015, 34(1), 20–24 CAS.
- C.-Y. Lee, W.-C. Moon and S.-B. Jung, Mater. Sci. Eng. A., 2008, 723–726 CrossRef CAS.
- H. Shi, X. Liu and Y. Lou, Int. J. Adv. Manuf. Technol., 2019, 100(1–4), 827–841 CrossRef.
- T. Cheng, G. Lv, Y. Li, H. Yun and L. Zhang, Macromol. Mater. Eng., 2021, 306(7), 1 CrossRef.
- X. Zhang, Y. Zhang, Q. Zhou and X. Zhang, Ind. Eng. Chem. Res., 2019, 59(3), 1142–1150 CrossRef.
- A. Ibanez and E. Fatas, Surf. Coat. Technol., 2005, 191(1), 7–16 CrossRef CAS.
- C.-K. Ku, C.-H. Ho, T.-S. Chen and Y.-D. Lee, J. Appl. Polym. Sci., 2007, 104(4), 2561–2568 CrossRef CAS.
- L. Liu, Y. Bu, Y. Sun, J. Pan, J. Liu, J. Ma and L. Qiu, J. Appl. Polym. Sci., 2021, 74, 237–245 CAS.
- M. Guo, M. Liu, W. Zhao, Y. Xia, W. Huang and Z. Li, Appl. Surf. Sci., 2015, 353, 1277–1284 CrossRef CAS.
- T.-L. Liu, Z. Chen and C. J. Kim, Soft Matter, 2015, 11(8), 1589–1596 RSC.
- A. Giacomello, S. Meloni, M. Chinappi and C.-M. Casciola, Langmuir, 2012, 28(29), 10764–10772 CrossRef CAS PubMed.
- H.-Y. Erbil and C.-E. Cansoy, Langmuir, 2009, 25(24), 14135 CrossRef CAS PubMed.
- D. Surblys, Y. Yamaguchi, K. Kuroda, M. Kagawa, T. Nakajima and H. Fujimura, J. Chem. Phys., 2014, 140(3), 034505 CrossRef CAS PubMed.
- S. Xiong, W. Qi, Y. Cheng, B. Huang and M. Wang, Phys. Chem. Chem. Phys., 2011, 13(22), 10648–10651 RSC.
- N.-K.-N. Quach, W.-D. Yang and Z.-J. Chung, Adv. Mater., 2017, 2017, 1–9 Search PubMed.
- G. Feng, Y. Xiong, H. Wang and Y. Yang, Electrochim. Acta, 2008, 53(28), 8253–8257 CrossRef CAS.
- K. Ngamchuea, S. Eloul and K. Tschulik, J. Solid State Chem., 2014, 18, 3251–3257 CAS.
- G.-K. Jayaprakash, B.-E.-K. Swamy and S. C. Sharma, Microchem. J., 2020, 158, 105116 CrossRef.
- E. Barrera, M.-P. Pardavé and N. Batina, J. Electrochem. Soc., 2000, 147(5), 1787–1796 CrossRef CAS.
- A. Henni, A. Merrouche, L. Telli and A. Azizi, Mater. Sci. Semicond. Process., 2015, 31, 380–385 CrossRef CAS.
Footnote |
| † Electronic supplementary information (ESI) available: Data and calculation of ΔS and N. See DOI: https://doi.org/10.1039/d3ma00565h |
| This journal is © The Royal Society of Chemistry 2023 |


