 Open Access Article
Enhancing the sensitivity of a water stable MOF as a H2S gas sensor by the fabrication of a mixed-matrix membrane†
Mouli
Das Dawn
a,
Karabi
Nath
 a,
Subhajit
Saha
 a,
Pritam Kumar
Roy
b,
Mahitosh
Mandal
b and
Kumar
Biradha
 *a
*a
aDepartment of Chemistry, Indian Institute of Technology Kharagpur, Kharagpur 721302, India. E-mail: kbiradha@chem.iitkgp.ac.in
bSchool of Medical Science and Technology, Indian Institute of Technology, Kharagpur 721302, India
First published on 11th October 2023
Abstract
Hydrogen sulfide (H2S) is a smelly, colorless, and hazardous gas even at sub-ppm level, produced predominantly from natural and anthropogenic sources. It is also called a ‘knock-down gas’ as its inhalation at higher concentrations can cause death. Therefore, several researchers are working on designing sensors with high stability and robustness for the real-time detection of H2S gas. Apart from many other materials, metal–organic framework (MOF)-based fluorescent probes are of high interest for the detection of H2S. Herein, we present a cost-effective acryl-amide functionalized 2D Zn-bdc MOF, which was shown to function as an excellent probe for the real-time detection of H2S in liquid as well as in the gaseous form through a nucleophilic addition mechanism to olefinic bonds of the MOFs. Interestingly, in the aqueous phase, Zn-bdc was found to exhibit turn-off and subsequent turn-on fluorescence spectra with the gradual addition of H2S. Furthermore, the realistic sensing of H2S by the MOF was investigated by preparing a mixed-matrix membrane of MOF with PVDF as a binder. Notably, the membrane with 60% loading of Zn-bdc increased the probe's sensitivity by two-fold. Furthermore, we note that this is the first example of an essential metal based mixed-matrix membrane for H2S detection with the LOD value as low as 5.3 μM. In vitro cell imaging of Zn-bdc in the presence of H2S displays a vibrant bright red fluorescence signal of LN-18 glioblastoma cells.
Introduction
A recent upsurge in the development of thin-film based sensors for detecting toxic gases such as H2S, CO2, SO2, NH3, and NO2 has drawn rigorous attention given their industrial applications.1,2 Among these gases, hydrogen sulfide (H2S) is a flammable, colorless, and deadly poisonous gas with the odour of rotten eggs and plays an effective role as a hazardous chemical in the environment.3 H2S is released into the environment as a by-product through various industrial processes in the chemical and pharmaceutical industries of natural gas production, petroleum refining and drilling, and also by the decomposition of sulfur-containing bio-molecules.4 In mammals, the endogenous concentration of H2S normally is at 10–100 micromolar level.5 The deregulation of endogenous concentration of H2S in the human body causes various types of diseases like Alzheimer's, Parkinson's, diabetes, and cancer.6,7 In addition to this, prolonged exposure to H2S vapor in a healthy body may also cause irritation of the eyes, nausea, headaches, respiratory failure, conjunctivitis, loss of sleep, and even death. Thus, the detection of H2S in its gaseous phase is just as important as in the solution phase. Therefore, it is essential to develop a quantitative technique for the fast, selective, and sensitive detection of exogenous as well as endogenous H2S in solution and in the gaseous phase. In this context, fluorescent H2S probes are advantageous over other conventional techniques,8–12 given their rapid response, simplicity in implementation, cell permeability, economic friendliness, and suitability for real-time detection.13–17 To date, three fundamental strategies are in use for the development of fluorescent H2S probes based on their reaction with H2S: (a) reductive reaction with H2S: reduction of nitro or azide to amine, and reduction of selenoxide to selenide; (b) nucleophilic addition reaction by H2S: Michael addition reactions, addition to double bonds, dual nucleophilic reactions and thiolysis reactions; (c) precipitation reactions by H2S as Hg2+/Cu2+/Au2+/Ag+ sulfides.18–24Coordination polymers (CPs)/metal–organic frameworks (MOFs) have been at the center of attraction over the last two decades owing to their multi-dimensional applications in gas separation and storage,25–29 guest inclusion,30 proton conductivity,31 sensing,32–37 magnetism,38 and catalysis.39,40 MOFs are considered for these applications given their high thermal, and chemical, stability, large porosity, tunable surface area, and amenability for post-synthetic modifications. One of the most developing applications of MOFs is associated with selective sensing of various analytes such as anions, cations, nitro-aromatics, and biological signaling molecules like H2S with very low detection limits.41–44 In very recent years, post-synthetic modification of the functional groups on the well-known MOFs for the detection of H2S has been shown as an efficient methodology (Table S5, ESI†). In this regard, vinyl functionalized MOFs of UiO-66 and CAU-10 were demonstrated for their ability in quantitative detection of H2S in physiological conditions, which occurs through nucleophilic addition reaction of H2S to the vinyl groups of MOFs.45,46 Further, Huang and co-workers reported malononitrile functionalized UiO-66-NH-BQB MOF for the detection of H2S and cysteine simultaneously.47,48 Recently, we have shown the importance of nitro and azide groups containing Zn-CPs for the detection of H2S by following the reductive reaction strategy.49 Among all the three mentioned methodologies, the synthesis of a fluorescent H2S probe based on nucleophilic addition reaction to the olefinic double bond of MOFs is very scarce. For the realistic sensing application of MOFs as a device, it is essential to fabricate their powder forms into thin-film membranes, which is not well explored to date. One such type of reported example is flexible Al-MIL-53-NO2 MOF-based mixed-matrix membranes used as an H2S sensor following the reductive reaction mechanism from the nitro to azide group.50
In this endeavor, we wish to present three Zn(II) MOFs (Zn-bdc, Zn-cpb, Zn-btc) containing acryl-amide functionalized organic struts, which have the propensity to detect H2S in the solution state as well as in the gaseous state by undergoing the nucleophilic addition reaction. Until now, most of the MOF-based probes have been explored for H2S detection either in the solution or gaseous phases.51–55 Interestingly, in the aqueous phase, Zn-bdc was found to show turn-off and subsequent turn-on fluorescence responses with the gradual addition of H2S and proved to be a better probe than Zn-cpb and Zn-btc in terms of stability, sensitivity, selectivity, and low response time with the detection limit of 10.7 μM. However, for real-time sensing applications using a thin-film based mixed-matrix membrane as a fluorescent H2S probe has not yet been fully established. Taking this into account, we synthesized mixed-matrix membranes with highly stable 2D MOF Zn-bdc as a filler and poly(vinylidene fluoride) (PVDF) as a binder (Scheme 1). This mixed-matrix membrane was shown to exhibit turn-on fluorescence emission upon exposure to H2S vapor following the nucleophilic addition reaction. The limit of detection (LOD) value of the Zn-bdc composite membranes was found to be reduced by 2 times compared to the dispersed aqueous phase of Zn-bdc MOF. In addition, Zn-bdc_60@PVDF is the first reported essential metal-based mixed-matrix membrane for H2S detection with the lowest LOD value of 5.3 μM.
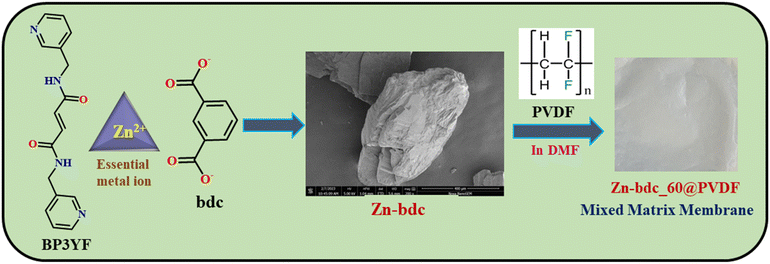 | ||
| Scheme 1 Chemical structures of the ligand, metal, and ancillary ligand of Zn-bdc with FESEM image and preparation of the mixed-matrix membrane of Zn-bdc_60@PVDF. | ||
Results and discussion
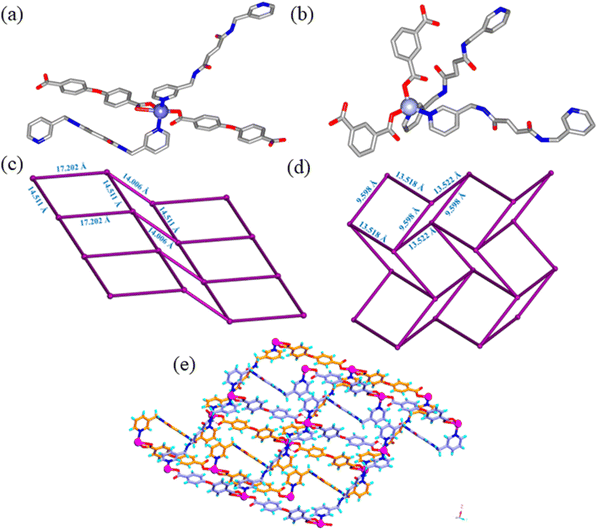
BP3YF was synthesized by a simple condensation reaction of 3-(aminomethyl)pyridine and fumaric acid (Scheme S1, ESI†).56 It was reported by our group earlier that the CPs composed of BP3YF function as adsorbents of oxoanion pollutants and toxic dyes.57 The complexation reactions were conducted in solvothermal conditions by reacting BP3YF with three polycarboxylates such as flexible 4-(4′-carboxyphenoxy)benzoic acid (H2cpb), angular benzene-1,3-dicarboxylic acid (H2bdc), and rigid benzene-1,2,4,5-tetracarboxylic acid (H4btc) with an essential metal Zn(NO3)2. These reactions produced single crystals of {[Zn(BP3YF)(cpb)]}n, (Zn-cpb), {[Zn(BP3YF)(bdc)]}n, (Zn-bdc), and {[Zn2(BP3YF)(btc)(H2O)2]}n, (Zn-btc) (Scheme S2, ESI†). Zn-cpb and Zn-bdc contain dicarboxylate as an ancillary ligand and resulted in 2D corrugated networks, whereas Zn-btc with tetra carboxylate forms a 3D-network. The relevant crystallographic details, selected bond lengths, bond angles, and geometrical parameters of hydrogen bonding of Zn-cpb, Zn-bdc, and Zn-btc are shown in Tables S1, S2 and S4 (ESI†).Single crystal X-ray diffraction analysis revealed that Zn-cpb and Zn-bdc crystallized in the P![[1 with combining macron]](https://www.rsc.org/images/entities/char_0031_0304.gif) and P21/c space groups, respectively. The asymmetric unit in Zn-cpb is composed of two half units of BP3YF, one unit each of cpb and a Zn(II) ion and that of Zn-bdc is composed of one unit of BP3YF, bdc, and Zn(II) metal centers. The Zn(II) central ion adopts distorted square pyramidal coordination geometry in Zn-cpb as it coordinates two pyridine units of BP3YF and two cpb units, one of which forms chelation (Fig. 1a). In Zn-bdc, the Zn(II) metal centers exhibit distorted tetrahedral geometry as they coordinated to two pyridyl units of BP3YF and two carboxylates of the bdc unit (Fig. 1b). In both structures, Zn(II) ions with the carboxylate of cpb/bdc form a wavy one-dimensional chain (Fig. S1a, ESI†). These one-dimensional chains are further connected through the ligand BP3YF that results in the formation of the corrugated 2D network in both Zn-cpb and Zn-bdc. In Zn-cpb, the 2D-network contains rectangular (14.511 × 17.202 Å) as well as square cavities (14.511 × 14.006 Å) (Fig. 1c and S1b). Whereas the 2D-layers of Zn-bdc contain only rectangular cavities (9.592 × 13.522 Å) (Fig. 1d and Fig. S1c, ESI†). These 2D corrugated layers are packed on each other via N–H⋯O (N⋯O: 2.8162.826 Å, 159°, 170° in Zn-cpb and N⋯O: 2.30 Å, 177° in Zn-bdc) hydrogen bonds (Fig. 1e).
and P21/c space groups, respectively. The asymmetric unit in Zn-cpb is composed of two half units of BP3YF, one unit each of cpb and a Zn(II) ion and that of Zn-bdc is composed of one unit of BP3YF, bdc, and Zn(II) metal centers. The Zn(II) central ion adopts distorted square pyramidal coordination geometry in Zn-cpb as it coordinates two pyridine units of BP3YF and two cpb units, one of which forms chelation (Fig. 1a). In Zn-bdc, the Zn(II) metal centers exhibit distorted tetrahedral geometry as they coordinated to two pyridyl units of BP3YF and two carboxylates of the bdc unit (Fig. 1b). In both structures, Zn(II) ions with the carboxylate of cpb/bdc form a wavy one-dimensional chain (Fig. S1a, ESI†). These one-dimensional chains are further connected through the ligand BP3YF that results in the formation of the corrugated 2D network in both Zn-cpb and Zn-bdc. In Zn-cpb, the 2D-network contains rectangular (14.511 × 17.202 Å) as well as square cavities (14.511 × 14.006 Å) (Fig. 1c and S1b). Whereas the 2D-layers of Zn-bdc contain only rectangular cavities (9.592 × 13.522 Å) (Fig. 1d and Fig. S1c, ESI†). These 2D corrugated layers are packed on each other via N–H⋯O (N⋯O: 2.8162.826 Å, 159°, 170° in Zn-cpb and N⋯O: 2.30 Å, 177° in Zn-bdc) hydrogen bonds (Fig. 1e).
The Zn-btc MOF crystallized in the P![[1 with combining macron]](https://www.rsc.org/images/entities/char_0031_0304.gif) space group and the asymmetric unit is composed of one unit of Zn(II) ion, half units each of coordinated BP3YF and btc, and one coordinated water molecule. The Zn(II) metal center in Zn-btc adopts a distorted trigonal bipyramidal geometry where the two apical positions are occupied by carboxylate ions and coordinated water molecules whereas the three equatorial positions are occupied by two carboxylate O-atoms and one pyridyl unit (Fig. S1d, ESI†). The Zn(II) metal center and btc units by connecting with each other, resulted in a neutral 2D layer (Fig. 2a). The layers are formed by a bimetallic secondary building unit in which Zn(II) centers are separated by 3.336 Å, and capped by two carboxylates in a μ2-bridging fashion. The 2D-layers are further pillared by BP3YF to generate a 3D-network (Fig. 2b) containing interlayer separation of 12.095 Å. The amide N–H groups form N–H⋯O hydrogen bonding with the carboxylate O atoms of btc (N–H⋯O, 1.92 Å; N⋯O, 2.827 Å, 154.79°).
space group and the asymmetric unit is composed of one unit of Zn(II) ion, half units each of coordinated BP3YF and btc, and one coordinated water molecule. The Zn(II) metal center in Zn-btc adopts a distorted trigonal bipyramidal geometry where the two apical positions are occupied by carboxylate ions and coordinated water molecules whereas the three equatorial positions are occupied by two carboxylate O-atoms and one pyridyl unit (Fig. S1d, ESI†). The Zn(II) metal center and btc units by connecting with each other, resulted in a neutral 2D layer (Fig. 2a). The layers are formed by a bimetallic secondary building unit in which Zn(II) centers are separated by 3.336 Å, and capped by two carboxylates in a μ2-bridging fashion. The 2D-layers are further pillared by BP3YF to generate a 3D-network (Fig. 2b) containing interlayer separation of 12.095 Å. The amide N–H groups form N–H⋯O hydrogen bonding with the carboxylate O atoms of btc (N–H⋯O, 1.92 Å; N⋯O, 2.827 Å, 154.79°).
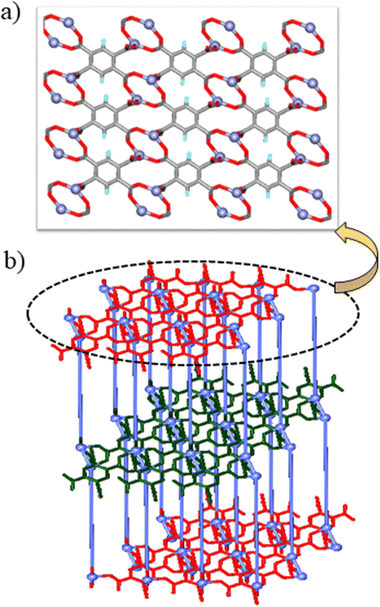 | ||
| Fig. 2 (a) Formation of a 2D-layer by metal centers and btc moieties; (b) connection of the 2D-layers via the BP3YF ligand as pillars to generate the overall 3D-network. | ||
In order to examine the H2S sensing abilities of MOFs in water, the stability of the MOFs was investigated by immersing them in an aqueous medium for seven days. Comparison of the XRPD patterns of the immersed samples with those of crystallized samples confirmed that two of the three MOFs, namely Zn-bdc and Zn-btc, are stable in water (Fig. S5, ESI†). The thermal stability of the MOFs was also checked by thermogravimetric analysis (TGA) (Fig. S6, ESI†). Zn-cpb and Zn-bdc are thermally stable up to 460 °C and 420 °C, respectively. In the case of Zn-btc, the initial 8% weight loss was observed at about 203 °C due to the loss of two coordinated water molecules and the network was found to be stable up to 481 °C. Prior to sensing studies, the solid-state luminescence properties of three MOFs and ligand BP3YF were examined at room temperature (Fig. S8, ESI†). BP3YF and all three MOFs have exhibited a luminescence emission maximum at ∼460 nm (λex = 290 nm), which can be attributed to π → π* or n → π* transitions due to Ligand-to-Ligand Charge Transfer (LLCT).58 The solution state absorbance spectra of BP3YF, Zn-cpb, Zn-bdc, and Zn-btc display a peak around 290 nm wavelength (Fig. S7b, ESI†).
H2S sensing in the dispersed aqueous phase
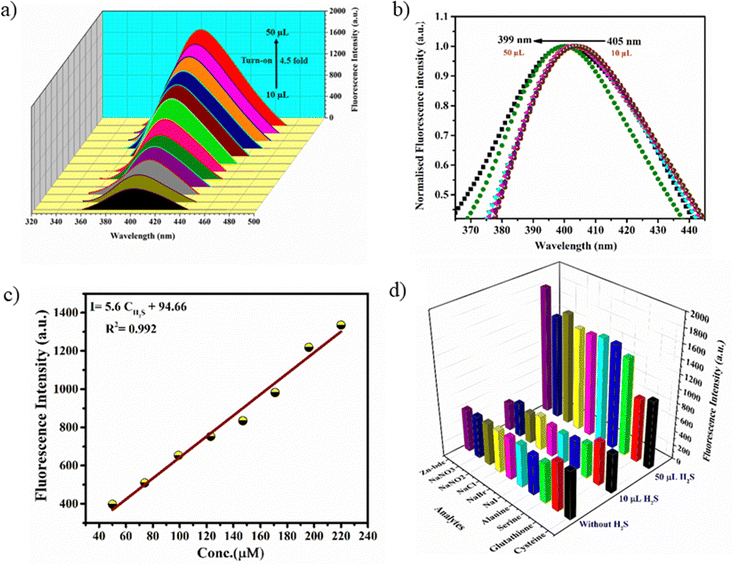
Interestingly, preliminary investigations on H2S sensing in aqueous solutions of MOFs have indicated that they exhibit initial turn-off and subsequent turn-on fluorescence with the gradual addition of aq. Na2S solution. The stock solutions of the MOFs (100 μM) were prepared by dispersing the finely ground samples in water such that a uniform suspension was formed. The aqueous solution of Zn-bdc was found to exhibit fluorescence at 405 nm with an excitation wavelength of 290 nm, which can be regarded as the ligand-based emission.59 A blue shift by 55 nm was observed in the fluorescence spectra of Zn-bdc in the aqueous phase compared to that of the solid phase (Fig. S8, ESI†). This shift could be due to the differences in the intermolecular interactions in the solid and aqueous phase.60 In order to explore the H2S sensing abilities of the MOFs, an aqueous solution of Na2S was prepared as a source of H2S (10 μM). The quantitative detection of the H2S by Zn-bdc was studied by systematically adding 2 μL portions of the aqueous Na2S solution to the 200 μL solution of MOFs and monitoring its fluorescence. A gradual fluorescence quenching by 65 percent was observed with the addition of 10 μL of Na2S solution (0.5 equivalents) in five portions (Fig. 3a).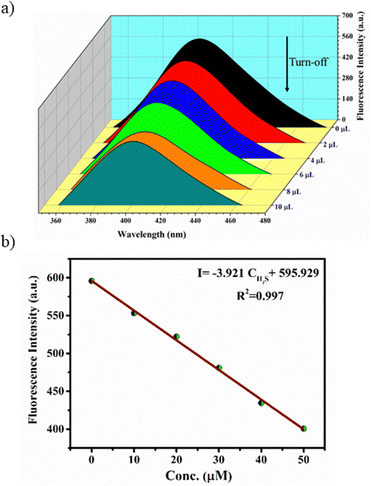 | ||
| Fig. 3 (a) Fluorescence turn-off response of Zn-bdc upon addition of 10 μL H2S and (b) concentration-dependent fitting curve for turn-off. | ||
The subsequent increase of Na2S from 10 μL to 50 μL (2.5 equivalent) resulted in the enhancement of the fluorescence intensity by 4.5-fold (Fig. 4a) with respect to that MOF solution without analyte. To further increase the fluorescence intensity, the addition of Na2S also resulted in a clear 6 nm blue shift (hypsochromic shift) that can be attributed to the nucleophilic addition of H2S to the olefinic double bond (Fig. 4b). Furthermore, the Stern–Volmer equation (I0/I = 1 + KSV[X]) was used to calculate the LOD value and quenching constant. In the equation, I0 and I represent the fluorescence intensities of the probe before and after the addition of the analyte, respectively, [X] is the molar concentration of the H2S solution, and KSV is the quenching constant (M−1) (Fig. S9, ESI†). These calculations reveal that Zn-bdc exhibits a quenching constant (KSV) of 9.747 × 10³ M−1 and the LOD for turn-off is 15.3 μM (Fig. 3b). For the turn-on measurements, the calibration curve showed a perfect linear relationship with the correlation coefficient R2 of 0.99. The slope was calculated to be 5.6 with an intercept of 94.66 from the calibration curve. Therefore, using this slope (S) and the standard deviation (δ), which was calculated by measuring the fluorescence five times with a blank solution, the LOD (3δ/S) for Zn-bdc towards sulfide was estimated to be 10.7 μM (Fig. 4c). A time-dependent fluorescence experiment with Zn-bdc reveals the increase of the fluorescence by 5.6-fold within 18 min for 50 μL of H2S (Fig. S10, ESI†). Along similar lines, the H2S sensing experiments were carried out with Zn-btc. It also exhibited turn-off fluorescence with the gradual addition of 10 μL of H2S solution. However, Zn-btc was not found to show any turn-on fluorescence spectra even after the addition of 50 μL of H2S (Fig. S11, ESI†). Due to the lower selectivity and sensitivity of Zn-btc towards H2S, further detailed investigation was performed with the Zn-bdc MOF.
The sensing medium contains multiple analytes in real-life sensing experiments. Therefore, the selectivity towards the target analyte over other intrusive biomolecules is a very important aspect to consider the probe as a smart sensor. Thus, the selective detection of H2S by Zn-bdc in the presence of other interfering biomolecules, such as cysteine, serine, glutathione, and alanine, and also in the presence of usual biological reducing anions, such as NaCl, NaBr, NaI, NaNO2, and NaNO3, was examined. All fluorescence analyses were performed in the same conditions as above with the presence of other competitive analytes. The fluorescence spectra showed significant fluorescence turn-off and turn-on also with the presence of other interfering biomolecules (Fig. S12, ESI†). In conclusion, Zn-bdc as a fluorescence chemosensor is selective towards H2S in an aqueous medium with the presence of other congeners (Fig. 4d).
To ascertain the H2S sensing mechanism and framework stability, the X-ray powder diffraction (XRPD), fluorescence resonance energy transfer (FRET), Fourier transform infrared spectroscopy (FTIR), time-correlated single photon counting (TCSPC), nuclear magnetic resonance spectroscopy (1H-NMR), and X-ray photoelectron spectroscopy (XPS) analyses were performed. The XRPD pattern of Zn-bdc after the addition of H2S remains to be same as that of as-synthesized Zn-bdc (Fig. S13, ESI†) indicating the phase stability of the material. Notably, the emission spectrum of the Zn-bdc probe was found to be overlapped with the absorption spectra of the aqueous Na2S solution, which indicates possible energy transfer between the analytes and the host (Fig. S14, ESI†).60,61 Therefore, the initial fluorescence turn-off can be attributed to the interaction of Na2S with Zn-bdc in the solution phase. The fluorescence lifetime measurement was performed by monitoring the fluorescence decay profile in the presence and absence of analyte H2S (Fig. S15, ESI†). The excited state lifetime of Zn-bdc is found to be 0.24 ns in the absence of an analyte. No effective overlap was observed in the fluorescence lifetime measurement curves before and after the addition of 10 μL of H2S to the probe solution, which may imply a dynamic quenching effect. Further addition of H2S up to 50 μL increased the fluorescence lifetime by 8.7 times due to the fluorescence turn-on. FTIR spectra were analysed for understanding the sensing mechanism of H2S by Zn-bdc. In FTIR, the disappearance of the characteristic peak of C![[double bond, length as m-dash]](https://www.rsc.org/images/entities/char_e001.gif) C of BP3YF at 1665 cm−1 was observed upon the addition of 50 μL of H2S (Fig. S16a and b, ESI†). This indicates the nucleophilic addition of SH− to the olefinic double bond of BP3YF of Zn-bdc. Furthermore, the appearance of a peak at 630 cm−1 indicates the presence of a C–S bond.62 Furthermore, a peak around 2895 cm−1 appeared indicating the presence of a –SH group that is added to the olefinic carbon atom. In 1H-NMR (Fig. S17 and S18, ESI†), a peak at 6.9 ppm disappeared after the treatment of H2S indicating the nucleophilic addition to the olefinic double bond. Furthermore, the peaks of the aromatic moiety were found to shift around 7–9 ppm due to the addition of –SH to the olefin. These analyses suggest that the H2S sensing mechanism by the MOF occurs through H2S addition to the double bond of BP3YF in Zn-bdc. Furthermore, the XPS analysis on MOF-bdc was carried out before and after the H2S sensing experiments to analyses the changes in the elemental composition. The as-synthesized MOF-bdc displays the signals corresponding to Zn, C, N, and O in the full-survey spectrum, whereas the presence of S was observed after the treatment with H2S (Fig. S19a, ESI†). The Zn 2p peaks were observed at 1021.36 eV and 1044.65 eV for 2p3/2 and for 2p1/2, respectively, both in as-synthesized and H2S-treated MOFs indicating no interaction of H2S with Zn(II) (Fig. S19b, ESI†). The C 1s spectra for the as-synthesized MOF can be deconvoluted into three peaks at the binding energies of 284.30 eV, 285.30 eV, and 287.30 eV corresponding to the C
C of BP3YF at 1665 cm−1 was observed upon the addition of 50 μL of H2S (Fig. S16a and b, ESI†). This indicates the nucleophilic addition of SH− to the olefinic double bond of BP3YF of Zn-bdc. Furthermore, the appearance of a peak at 630 cm−1 indicates the presence of a C–S bond.62 Furthermore, a peak around 2895 cm−1 appeared indicating the presence of a –SH group that is added to the olefinic carbon atom. In 1H-NMR (Fig. S17 and S18, ESI†), a peak at 6.9 ppm disappeared after the treatment of H2S indicating the nucleophilic addition to the olefinic double bond. Furthermore, the peaks of the aromatic moiety were found to shift around 7–9 ppm due to the addition of –SH to the olefin. These analyses suggest that the H2S sensing mechanism by the MOF occurs through H2S addition to the double bond of BP3YF in Zn-bdc. Furthermore, the XPS analysis on MOF-bdc was carried out before and after the H2S sensing experiments to analyses the changes in the elemental composition. The as-synthesized MOF-bdc displays the signals corresponding to Zn, C, N, and O in the full-survey spectrum, whereas the presence of S was observed after the treatment with H2S (Fig. S19a, ESI†). The Zn 2p peaks were observed at 1021.36 eV and 1044.65 eV for 2p3/2 and for 2p1/2, respectively, both in as-synthesized and H2S-treated MOFs indicating no interaction of H2S with Zn(II) (Fig. S19b, ESI†). The C 1s spectra for the as-synthesized MOF can be deconvoluted into three peaks at the binding energies of 284.30 eV, 285.30 eV, and 287.30 eV corresponding to the C![[double bond, length as m-dash]](https://www.rsc.org/images/entities/char_e001.gif) C, C
C, C![[double bond, length as m-dash]](https://www.rsc.org/images/entities/char_e001.gif) O, and C–O, respectively. For the H2S-treated MOF, these three peaks were found to be slightly shifted to 284.10 eV, 285.10 eV, and 287.49 eV as well a new peak appeared at 286.48 eV corresponding to the C–S bond (Fig. S19c, ESI†).63,64 The high-resolution spectra of S 2p were deconvoluted into two peaks at 160.67 eV and 162.05 eV, which can be marked for S 2P3/2 and S 2P1/2 splitting (Fig. S19f, ESI†). Therefore, these studies indicate the nucleophilic addition to the olefinic double bond of Zn-bdc by SH−. In summary, formation of the new C–S bond in the MOF could be the probable reason for fluorescence turn-on.
O, and C–O, respectively. For the H2S-treated MOF, these three peaks were found to be slightly shifted to 284.10 eV, 285.10 eV, and 287.49 eV as well a new peak appeared at 286.48 eV corresponding to the C–S bond (Fig. S19c, ESI†).63,64 The high-resolution spectra of S 2p were deconvoluted into two peaks at 160.67 eV and 162.05 eV, which can be marked for S 2P3/2 and S 2P1/2 splitting (Fig. S19f, ESI†). Therefore, these studies indicate the nucleophilic addition to the olefinic double bond of Zn-bdc by SH−. In summary, formation of the new C–S bond in the MOF could be the probable reason for fluorescence turn-on.
A substantial quantity of H2S is being released every day into water in the form of waste by the pulp and paper industry, natural gas and petroleum refinery, manufacturing industries of chemicals, volcanoes, human wastes, etc. The excellent selectivity and sensitivity of Zn-bdc towards H2S prompted us to test its sensing ability quantitatively. The real water samples are procured from the tap (lab tap water), a lake (collected from the serpentine lake of IIT Kharagpur, India), and a river (Ganga River). The samples are prepared with varied concentrations (100 μM, 150 μM, and 200 μM) of H2S. The H2S concentrations of these solutions were estimated using Zn-bdc and it was found that the estimated values are close to the original added concentrations of H2S in those solutions (Table 1). For all the samples, the found H2S concentrations indicate a good recovery percentage and low Relative Standard Deviation (RSD) value.65 This result concludes that the Zn-bdc sensor was able to detect H2S quantitatively from real water samples.
| Samples | Added (μM) | Found (μM) | Recovery (%) | RSD (%) | |
|---|---|---|---|---|---|
| Tap water | 1 | 100 | 99.92 | 99.92 | 4.98 |
| 2 | 150 | 152.78 | 99.87 | 5.12 | |
| 3 | 200 | 193.74 | 96.87 | 3.42 | |
| Lake water | 1 | 100 | 99.67 | 99.67 | 4.63 |
| 2 | 150 | 147.13 | 98.08 | 2.33 | |
| 3 | 200 | 200.15 | 100.07 | 2.80 | |
| River water | 1 | 100 | 96.10 | 96.10 | 5.18 |
| 2 | 150 | 146.37 | 97.58 | 4.30 | |
| 3 | 200 | 188.65 | 94.32 | 3.22 |
Detection of H2S Gas
According to a survey by the U.S. Bureau of Labor Statistics, about 60 workers expired from 2001 to 2010 due to exposure of H2S gas. Therefore, H2S sensing in its gaseous phase is also as important as its detection in the solution phase.However, most of the MOF-based probes are inadequate for the detection of H2S in the gaseous phase. Therefore, we have explored the H2S gas detection ability of the finely ground powdered form of the MOF and also of the MOF loaded mixed-matrix membrane.
H2S gas detection by powdered MOF
Finely ground powder material of Zn-bdc was taken in two vials and placed in two wider vials containing 10 μL and 50 μL aqueous solution of Na2S as a source of H2S vapor. The fluorescence of the exposed material was monitored at different time intervals. No change in fluorescence intensity was observed for the material that is exposed to 10 μL of H2S. Notably, a fluorescence turn-on phenomenon was observed with the material that is exposed to 50 μL of H2S vapor at an excitation wavelength of 290 nm. The fluorescence intensity of the spectrum increases about 1.2-fold after the vapor deposition of H2S for nucleophilic addition in the olefinic double bond (Fig. S22, ESI†). In summary, we can conclude that the powder form of the Zn-bdc probe can detect H2S in the gaseous phase by following the nucleophilic addition mechanism.Preparation of the mixed-matrix membrane of MOF
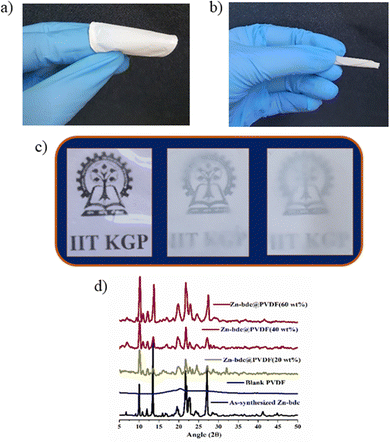
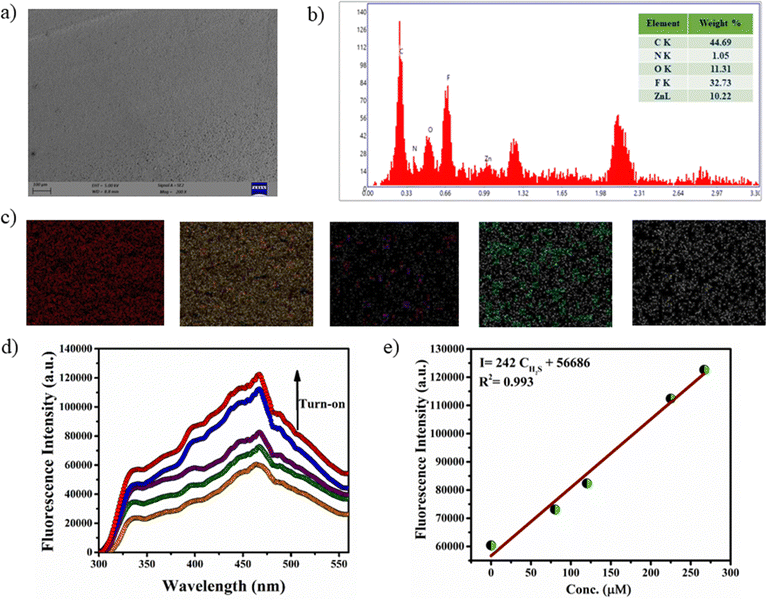
Rapid and selective detection of H2S by the Zn-bdc probe prompted us to explore the H2S sensing application by the mixed-matrix membrane of the MOF. The membrane was synthesized by blending the microparticles of the MOFs with PVDF in DMF solution through the slurry casting method. A total of four membranes were prepared with different loading percentages of MOFs in the membranes: Zn-bdc_0@PVDF, Zn-bdc_20@PVDF, Zn-bdc_40@PVDF and Zn-bdc_60@PVDF with 0%, 20%, 40% and 60% Zn-bdc, respectively (Fig. 5a). Furthermore, it was found that loading of beyond 60% of Zn-bdc resulted in unstable membranes, which leach out the Zn-bdc into the DMF solution due to the lack of proper integration of the MOFs in the polymeric blend. The XRPD pattern of all four membranes was found to exhibit characteristic peaks of Zn-bdc (Fig. 5d) confirming the phase stability and crystallinity of the MOF in the membranes. The membranes were further characterized by field emission scanning electron microscopy (FESEM) (Fig. 6a) and energy-dispersive X-ray spectroscopy (EDX) (Fig. 6b). The elemental mapping shows a uniform distribution of carbon, nitrogen, oxygen, fluorine, and zinc, indicating the uniform dispersion of Zn-bdc in the composite membrane (Fig. 6c). The pure PVDF film was found to be transparent; however, the transparency of the membrane was found to decrease as the loading percentage of Zn-bdc increased (Fig. 5c). We would like to note here that the composite membranes are found to be mechanically robust, free of cracks, and flexible (Fig. 5b). These are some of the very important features for further application in real-time chemical sensing.H2S gas detection by the mixed-matrix membrane of the MOF
The H2S sensing ability of the MOF-loaded membranes is investigated by monitoring the fluorescence of H2S exposed membranes. The bare PVDF membrane exhibited no fluorescence and exhibited a negligible spectral change after H2S vapor deposition, suggesting that the pure PVDF does not influence the fluorescence intensity of the H2S detection process. Interestingly, a remarkable increase in fluorescence intensity was observed with increasing the loading percentage of Zn-bdc in the membranes (Fig. S23, ESI†). More interestingly, Zn-bdc_60@PVDF showed more pronounced fluorescence enhancement upon H2S vapor treatment, and hence 60% film loading was selected for further investigation in detail. Similar to the solution detection, fluorescence turn-on was observed with the incremental addition of H2S vapor (Fig. 6d). As described earlier, the nucleophilic addition reaction to the olefinic bond of the ligand is responsible for the turn-on fluorescence. Furthermore, the calibration curve for turn-on shows a perfect linear relationship with the correlation co-efficient R2 0.99. From the linear fitted curve, the calculated slope value was 242 with an intercept of 56![[thin space (1/6-em)]](https://www.rsc.org/images/entities/char_2009.gif) 686 (Fig. 6e). By using the slope value (S) and the standard deviation, which is calculated with five times blank fluorescence measurements (δ) using the PVDF film, the value of detection limit (LOD = 3δ/S) of Zn-bdc_60@PVDF toward sulfide (S2−) was calculated to be 5.3 μM. Interestingly, the LOD value of the Zn-bdc_60@PVDF membrane is considerably lower than that of the Zn-bdc in aqueous solution. We note here that this LOD value is the lowest among all the reported Zn-based probes to date.
686 (Fig. 6e). By using the slope value (S) and the standard deviation, which is calculated with five times blank fluorescence measurements (δ) using the PVDF film, the value of detection limit (LOD = 3δ/S) of Zn-bdc_60@PVDF toward sulfide (S2−) was calculated to be 5.3 μM. Interestingly, the LOD value of the Zn-bdc_60@PVDF membrane is considerably lower than that of the Zn-bdc in aqueous solution. We note here that this LOD value is the lowest among all the reported Zn-based probes to date.
In vitro cell imaging of LN-18 glioblastoma cells
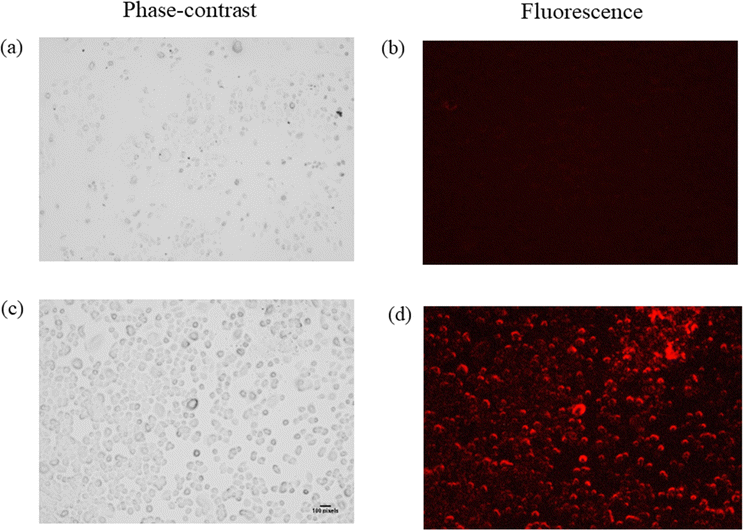
The fast response, excellent selectivity, and sensitivity of Zn-bdc towards extracellular H2S in an aqueous medium motivated us to investigate the detection ability of Zn-bdc for intracellular H2S. In this regard, cellular imaging was investigated by LN-18 glioblastoma cells in a biological medium. For a live cell imaging study of a probe, it is important to test the biocompatibility of the cell. Therefore, cytotoxicity assay analysis was performed, and the percentage of cell viability was plotted against the dose concentration of Zn-bdc, from which fifty percent cell growth inhibition (IC50) was calculated at 98.38 μM (Fig. S26, ESI†). The cellular morphology of the LN-18 glioblastoma cell remained intact with the different probe concentrations even after 48 hours of incubation. These results suggest that Zn-bdc can be considered a convenient probe for conducting cellular imaging analysis. Thus, no fluorescence was detected when cells were treated with the probe at the concentration of 98.38 μM. However, when 10 μM Na2S solution was added as a source of endogenous H2S and the cells were incubated for 48 hours in that solution a signal of bright red fluorescence was observed in LN-18 glioblastoma cells while maintaining their entire morphology (Fig. 7). In brief, Zn-bdc proved itself to be an excellent potential aspirant for in vitro cell imaging.Conclusion
In conclusion, herein, three Zn(II) MOFs containing acryl-amide functionalized bis pyridyl ligands and different polycarboxylates are synthesized and structurally characterized. Two of the three MOFs (Zn-bdc & Zn-btc) were found to exhibit water stability and their utility towards H2S sensing was explored in detail. These studies reveal that Zn-bdc has better H2S sensing ability in terms of sensitivity, selectivity and stability, and exhibits turn-off and subsequent turn-on fluorescence upon exposure with the gradual addition of H2S in the solution phase. The detection limits for Zn-bdc are found to be 10.7 μM in the solution phase for the nucleophilic addition. The real-time application of the MOF in a device has been demonstrated by synthesizing a mixed-matrix membrane of the Zn-bdc MOF using PVDF binder. Interestingly, the MOF as a film offers a brand-new sensing platform with improved permeation fluxes and contact area with the analyte. The 60% Zn-bdc MOF-loaded membrane exhibited highly sensitive (5.3 μM) and selective sensing capacity for gaseous phase H2S detection. The mechanism of sensing has been established by characterizing the resultant chemical changes in the MOF upon exposure to H2S. These studies reveal that the sensing mechanism operates through the nucleophilic addition of H2S to the olefinic double bonds of the BP3YF of the MOF. Furthermore, it was also shown that the MOFs are useful for biomedical imaging as they produce red fluorescence in LN-18 glioblastoma cells upon exposure to H2S. These results reveal that the incorporation of the MOF into mixed-matrix membranes results in an increase in the sensitivity of H2S detection by the MOF.Conflicts of interest
There are no conflicts to declare.Acknowledgements
We acknowledge the financial support from DST-SERB (CRG/2022/000606), New Delhi, India, and DST-FIST for providing the single-crystal X-ray diffractometer. MDD thanks CSIR for the research fellowship. MM acknowledges the Indian Council of India, New Delhi, UGC, Govt of India, and SERB India for providing the JC Bose Fellowship.References
- D. J. Wales, J. Grand, V. P. Ting, R. D. Burke, K. J. Edler, C. R. Bowen, S. Mintovab and A. D. Burrows, Chem. Soc. Rev., 2015, 44, 4290 RSC.
- H. Wang, W. P. Lustig and J. Li, Chem. Soc. Rev., 2018, 47, 4729 RSC.
- R. J. Reiffenstein, W. C. Hulbert and S. H. Roth, Annu. Rev. Pharmacol. Toxicol., 1992, 32, 109 CrossRef CAS PubMed.
- T. L. Guidotti, Int. J. Toxicol., 2010, 29, 569 CrossRef CAS.
- H. Peng, Y. Cheng, C. Dai, A. L. King, B. L. Predmore, D. J. Lefer and B. A. Wang, Angew. Chem., Int. Ed. Engl., 2011, 50, 9672 CrossRef CAS PubMed.
- K. Eto, T. Asada, K. Arima, T. Makifuchi and H. Kimura, Biochem. Biophys. Res. Commun., 2002, 293, 1485 CrossRef CAS PubMed.
- C. Szabo, Antioxid. Redox Signaling, 2012, 17, 68 CrossRef CAS PubMed.
- V. Vitvitsky and R. Banerjee, Methods Enzymol., 2015, 554, 111 CAS.
- N. Sharma, V. Kumar and A. Jose, Dalton Trans., 2023, 52, 675 RSC.
- J. Cui, Y.-L. Wong, M. Zeller, A. D. Hunter and Z. Xu, Angew. Chem., Int. Ed., 2014, 53, 14438 CrossRef CAS PubMed.
- M. G. Choi, S. Cha, H. Lee, L. Jeon and S. K. Chang, Chem. Commun., 2009, 7390 RSC.
- N. S. Lawrence, J. Davis, L. Jiang, T. G. J. Jones, S. N. Davies and R. G. Compton, Electroanalysis, 2000, 12, 1453 CrossRef CAS.
- F. Wang, L. Wang, X. Chen and J. Yoon, Chem. Soc. Rev., 2014, 43, 4312 RSC.
- D. Wu, A. C. Sedgwick, T. Gunnlaugsson, E. U. Akkaya, J. Yoon and T. D. James, Chem. Soc. Rev., 2017, 46, 7105 RSC.
- D. Cao, Z. Liu, P. Verwilst, S. Koo, P. Jangjili, J. S. Kim and W. Lin, Chem. Rev., 2019, 119, 10403 CrossRef CAS PubMed.
- S. Nath, S. K. Pathak, B. Pradhan, R. K. Gupta, K. A. Reddy, G. Krishnamoorthy and A. S. Achalkumar, New J. Chem., 2018, 42, 5382 RSC.
- W. Sun, S. Guo, C. Hu, J. Fan and X. Peng, Chem. Rev., 2016, 116, 7768 CrossRef CAS PubMed.
- F. Yu, X. Han and L. Chen, Chem. Commun., 2014, 50, 12234 RSC.
- N. Kumar, V. Bhalla and M. Kumar, Coord. Chem. Rev., 2013, 257, 2335 CrossRef CAS.
- V. S. Lin and C. J. Chang, Curr. Opin. Chem. Biol., 2012, 16, 595 CrossRef CAS PubMed.
- B. Peng and M. Xian, Asian J. Org. Chem., 2014, 3, 914 CrossRef CAS.
- M. Strianese and C. Pellecchia, Coord. Chem. Rev., 2016, 318, 16 CrossRef CAS.
- M. Strianese, M. Lamberti and C. Pellecchia, Dalton Trans., 2018, 47, 17392 RSC.
- M. Strianese, D. Guarnieri, M. Lamberti, A. Landi, A. Peluso and C. Pellecchia, Inorg. Chem., 2020, 59, 15977 CrossRef CAS PubMed.
- T. Xu, P. Zhang, F. Cui, J. Li, L. Kan, B. Tang, X. Zou, Y. Liu and G. Zhu, Adv. Mater., 2023, 35, 2204553 CrossRef CAS PubMed.
- Q. Yang, S. Vaesen, F. Ragon, A. D. Wiersum, D. Wu, A. Lago, T. Devic, C. Martineau, F. Taulelle, P. L. Llewellyn, H. Jobic, C. Zhong, C. Serre, G. D. Weireld and G. A. Maurin, Angew. Chem., Int. Ed., 2013, 52, 10316 CrossRef CAS PubMed.
- H. Zhang, Y. Muhammad, X. Cui, Z. Zhang, L. Liu, Z. Chu, J. Li, Y. Zhang, S. J. Shah and Z. Zhao, J. Mater. Chem. A, 2021, 9, 4066 RSC.
- D. D. Borges, P. Normand, A. Permiakova, R. Babarao, N. Heymans, D. S. Galvao, C. Serre, G. D. Weireld and G. Maurin, J. Phys. Chem. C, 2017, 121, 26822 CrossRef.
- G. Benedetto, B. M. Cleary, C. T. Morrell, C. G. Durbin, A. L. Brinks, J. Tietjen and K. A. Mirica, J. Chem. Educ., 2023, 100, 1289 CrossRef CAS PubMed.
- A. A. Sapianik, E. R. Dudko, K. A. Kovalenko, M. O. Barsukova, D. G. Samsonenko, D. N. Dybtsev and V. P. Fedin, ACS Appl. Mater. Interfaces, 2021, 13, 14768 CrossRef CAS PubMed.
- K. Biradha, A. Goswami, R. Moi and S. Saha, Dalton Trans., 2021, 50, 10655 RSC.
- A. H. Assen, O. Yassine, O. Shekhah, M. Eddaoudi and K. N. Salama, ACS Sens., 2017, 2, 1294 CrossRef CAS PubMed.
- S. Fajal, P. Samanta, S. Dutta and S. K. Ghosh, Inorg. Chim. Acta, 2020, 502, 119359 CrossRef CAS.
- S. Tripathi and G. Anantharaman, CrystEngComm, 2015, 17, 2754 RSC.
- S. K. Sachan and G. Anantharaman, Inorg. Chem., 2022, 61, 18340 CrossRef CAS PubMed.
- W. Li, X. Yu, Y. Tang, Z. Li, S. J. Shah, Y. Liu, H. Zhao, M. Song, J. Li, G. Wang, L. Zhou, Z. Zhao, S. Liu and Z. Zhao, Sens. Actuators, B, 2023, 390, 133954 CrossRef CAS.
- D. I. Pavlov, X. Yu, A. A. Ryadun, V. P. Fedin and A. S. Potapov, Chemosensors., 2023, 11, 52 CrossRef CAS.
- A. E. Thorarinsdottir and D. T. Harris, Chem. Rev., 2020, 120, 8716 CrossRef CAS PubMed.
- C. Pagis, M. Ferbinteanu, G. Rothenberg and S. Tanase, ACS Catal., 2016, 6, 6063 CrossRef CAS.
- S. Li, T. Wang, D. Tang, Y. Yang, Y. Tian, F. Cui, J. Sun, X. Jing, D. S. Sholl and G. Zhu, Adv. Sci., 2022, 9, 2203712 CrossRef CAS PubMed.
- H. Min, Z. Han, M. Wang, Y. Li, T. Zhou, W. Shi and P. Cheng, Inorg. Chem. Front., 2020, 7, 3379 RSC.
- L. Guan, Z. Jiang, Y. Cui, Y. Yang, D. Yang and G. Qian, Adv. Opt. Mater., 2021, 9, 2002180 CrossRef CAS.
- S. S. Nagarkar, B. Joarder, A. K. Choudhari, S. Mukherjee and S. K. Ghosh, Angew. Chem., Int. Ed., 2013, 52, 2881 CrossRef CAS PubMed.
- X. Zhang, Q. Hu, T. Xia, J. Zhang, Y. Yang, Y. Cui, B. Chen and G. Qian, ACS Appl. Mater. Interfaces, 2016, 8, 32259 CrossRef CAS PubMed.
- S. Nandi, H. Reinsch and S. Biswas, Microporous Mesoporous Mater., 2020, 293, 109790 CrossRef CAS.
- Y. Li, X. Zhang, L. Zhang, K. Jiang, Y. Cui, Y. Yang and G. Qian, J. Solid State Chem., 2017, 255, 97 CrossRef CAS.
- H. Yu, C. Liu, Y. Li and A. Huang, ACS Appl. Mater. Interfaces, 2019, 11, 41972 CrossRef CAS PubMed.
- H. Li, X. Feng, Y. Guo, D. Chen, R. Li, X. Ren, X. Jiang, Y. Dong and B. Wang, Sci. Rep., 2014, 4, 4366 CrossRef PubMed.
- S. Saha, P. K. Roy, K. Maity, M. Mandal and K. Biradha, Chem. – Eur. J., 2021, 28, e202103830 CrossRef PubMed.
- X. Zhang, Q. Zhang, D. Yue, J. Zhang, J. Wang, B. Li, Y. Yang, Y. Cui and G. Qian, Small, 2018, 14, 1801563 CrossRef PubMed.
- X. Han, J. Liu, K. Yu, Y. Lu, W. Xiang, D. Zhao and Y. He, Inorg. Chem., 2022, 61, 5067 CrossRef CAS PubMed.
- S. G. Surya, S. Bhanoth, S. M. Majhi, Y. D. More, V. M. Teja and K. N. Chappanda, CrystEngComm, 2019, 21, 7303 RSC.
- S. S. Nagarkar, A. V. Desai and S. K. Ghosh, Chem. – Eur. J., 2015, 21, 9994 CrossRef CAS PubMed.
- S. H. Hosseini-Shokouh, J. Zhou, E. Berger, Z. P. Lv, X. Hong, V. Virtanen, K. Kordas and H. P. Komsa, ACS Appl. Mater. Interfaces, 2023, 15, 7063 CrossRef CAS PubMed.
- X. Zheng, R. Fan, Y. Song, A. Wang, K. Xing, X. Du, P. Wang and Y. Yang, J. Mater. Chem. C, 2017, 5, 9943 RSC.
- L. Rajput, S. Singha and K. Biradha, Cryst. Growth Des., 2007, 7, 2788 CrossRef CAS.
- K. Nath, K. Maity and K. Biradha, Cryst. Growth Des., 2017, 17, 4437 CrossRef CAS.
- D. Sun, Z. H. Yan, V. A. Blatov, L. Wang and D. F. Sun, Cryst. Growth Des., 2013, 13, 1277 CrossRef CAS.
- R. Moi, K. Nath and K. Biradha, Chem. – Asian J., 2019, 14, 3742 CrossRef CAS PubMed.
- Z. W. Zhai, S. H. Yang, M. Cao, L. K. Li, C. X. Du and S. Q. Zang, Cryst. Growth Des., 2018, 18, 7173 CrossRef CAS.
- K. E. Sapsford, L. Berti and I. L. Medintz, Angew. Chem., Int. Ed., 2006, 45, 4562 CrossRef CAS PubMed.
- C. N. R. Rao, R. Venkataraghavan and T. R. Kasturi, Can. J. Chem., 1964, 42, 36 CrossRef CAS.
- A. Munir, T. u Haq, A. Qurashi, H. U. Rehman, A. U. Hamid and I. Hussain, ACS Appl. Energy Mater, 2019, 2, 363 CrossRef CAS.
- D. Chen, C. Gan, X. Fan, L. Zhang, W. Li, M. Zhu and X. Quan, Materials, 2019, 12, 2800 CrossRef CAS PubMed.
- D. Harvey, Modern Analytical Chemistry, 2000 Search PubMed.
Footnote |
| † Electronic supplementary information (ESI) available: Synthesis of BP3YF, Synthesis of MOF, Membrane preparation, XRPD patterns, TGA analysis, XPS plot, FTIR, 1H-NMR data, cytotoxicity assay analysis, and a comparison table of H2S sensing by MOFs. CCDC 2282228–2282230. For ESI and crystallographic data in CIF or other electronic format see DOI: https://doi.org/10.1039/d3ma00681f |
| This journal is © The Royal Society of Chemistry 2023 |

