Photoisomerization and local stability in molecular and polymer-network glasses
K. Michael
Salerno
a,
Joseph L.
Lenhart
a,
Juan
de Pablo
 *b and
Timothy W.
Sirk
 *a
*a
aPolymers Branch, US Army Research Laboratory, Aberdeen Proving Ground, Maryland, USA. E-mail: timothy.w.sirk.civ@army.mil
bUniversity of Chicago, Institute of Molecular Engineering, University of Chicago, Chicago, Illinois, USA. E-mail: depablo@uchicago.edu
First published on 29th September 2022
Abstract
Although experiments have shown that photoactive molecules can actuate mechanical and optical responses in soft materials, previous computational studies of the photoresponsive molecules have largely focused on molecules in solution or vacuum. Here we use molecular dynamics simulations to study the behavior of azobenzene (AB) and disperse red one (DR1) in molecular and polymer-network glasses during and after photoactivation. In such a rigid matrix environment, the interaction of the molecule with the local environment is as important as the molecule's intrinsic electronic excitation properties, and is less understood. Simulations show that the waiting time between photoactivation and isomerization varies by orders of magnitude and depends on both intermolecular interactions and density. Specifically, we find that the distribution of waiting times follows a power-law with exponent b ≈ 1.0–1.25, where the extent of the power-law distribution grows with decreasing temperature or increasing density. The change in the wait-time distribution with density across sample composition, quench-rate and temperature is characterized, and features of the local molecular interactions are correlated with the wait time. In contrast to initial isomerization events, we find that the dynamics of photoactivated molecules and the surrounding solid after isomerization are not closely linked to the sample density or temperature.
Design, System, ApplicationThis work explores photo-responsive azobenzene compositions as a new avenue for developing durable polymer materials. In the initial steps presented here, we characterize the features of the molecular response of azobenzene compounds embedded in epoxy matrices. The composition we consider is a common industrial adhesive found in layered and filled composite materials, where the overall composite properties are strongly influenced by the adhesive interface. One of the key chemical design considerations is the time needed for the epoxy to change properties after a photo stimulus. This macroscopic property change is driven by the onset of a molecular conformational change, photo-isomerization, that is controlled by the chemical details of the azobenzene and the glassy epoxy matrix. Our results establish a power law form for the distribution of molecular response times, demonstrate the shift of the response time with chemical composition, and show a divergence of the response time at high mass density. Although these results are derived from low-level molecular data, key abstractions are provided that we anticipate will be integrated into macroscopic material models and ultimately into the design of the fast-responding composites and devices composed of polymeric glasses. |
1. Introduction
Photoresponsive molecules, such as stilbenes or those containing the azo group, have been demonstrated experimentally to actuate changes in soft materials1–7 with variations in response due to chemical features such as hydrogen-bonding, chain stiffness, and density. These experiments built on past work using photoisomerization to measure local free volume in polymer glasses with a range of conditions and preparations.8–13 In addition, experimental studies have linked the isomerization rate to the size of the probe-molecule.10,14 In contrast, computational efforts have largely focused on using ab initio quantum calculations to study the energy levels and mechanisms of excitation and isomerization in the isolated molecule.15–19 In this study, we bridge the scale gap by using a classical molecular dynamics (MD) potential derived from ab initio calculations20–25 to simulate azobenzene (AB) and disperse red 1 (DR1) molecules within large molecular and polymer-network glass (PNG) samples for times up to tens of nanoseconds.Our previous MD simulations established that, in an AB molecular glass, the time-scale for response after photoexcitation could vary over several orders of magnitude, depending on the sample density.26 These findings were consistent across bulk-cooled and physical vapor-deposited samples, and showed that density, rather than inherent structure energy, governed the characteristic response time. The strong link between density and response time suggests why previous experimental results13,14,27,28 were successfully interpreted using theories of free-volume fluctuations.29–32
In this work, we consider photoresponsive molecules within a polymer matrix material, with the goal of understanding how specific molecular interactions or matrix properties change the characteristic time for photoresponse. We anticipate the results here will establish design principles for engineering responsive materials, such as epoxy and similar thermosetting networks that are broadly useful in industrial and consumer products. The remainder of the paper is structured as follows: first, details of the simulation models, glass preparation, and photoactivation simulations are given. Next, photoactivation simulation results link the isomerization wait time with the sample properties. A connection is made between the local potential energy and the isomerization wait time. Finally, the conclusions and future directions are presented.
2. Simulation methods
Force fields
Simulations of both the molecular and network glasses use the OPLS-AA force field with modified bonded interactions near the azo-group dihedral (C–N![[double bond, length as m-dash]](https://www.rsc.org/images/entities/char_e001.gif) N–C). In this model, the dihedral energy is represented by a piece-wise function of the dihedral angle φ that approximates the excited-state energy from ab initio calculations. Parameters for the bond, bond-angle, dihedral and improper-dihedral interactions involving one or more of the carbon or nitrogen atoms also depend on the value of the dihedral angle φ; the full set of interaction parameters and functional forms are given in Böckmann et al.21 We make the approximation that the effective energy surface of an excited DR1 molecule can be represented by the same classical potential as AB, i.e., the asymmetry of the electronic structure due to the DR1 side groups is not considered.
N–C). In this model, the dihedral energy is represented by a piece-wise function of the dihedral angle φ that approximates the excited-state energy from ab initio calculations. Parameters for the bond, bond-angle, dihedral and improper-dihedral interactions involving one or more of the carbon or nitrogen atoms also depend on the value of the dihedral angle φ; the full set of interaction parameters and functional forms are given in Böckmann et al.21 We make the approximation that the effective energy surface of an excited DR1 molecule can be represented by the same classical potential as AB, i.e., the asymmetry of the electronic structure due to the DR1 side groups is not considered.
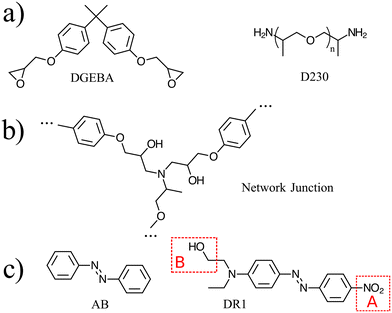
All simulations were performed with the LAMMPS MD simulator.33 All samples used a Nosé–Hoover barostat with pressure time constant of 1 ps, thermostat with time constant of 0.1 ps, and timestep of 1 fs.34 The Coulomb interactions were computed using the particle–particle particle–mesh method.35 For a subset of simulations, the DR1 molecules were modified to reduce the effect of electrostatic interactions, as shown in Fig. 1(d). In these simulations, referred to below as “no-charge”, the charges of a single molecule are modified upon activation of the dihedral-angle as follows (see Fig. 1d). In region A: the oxygen atoms in the nitro group are set to zero charge; the nitrogen and its neighboring carbon are set to small charges corresponding to aromatic carbon; in region B, the methyl is left unchanged, while the hydroxyl atoms are set to zero charge. The neighboring carbon atom takes a small negative charge (q = −0.085515qe) to balance the surrounding partial charges.
Sample preparation
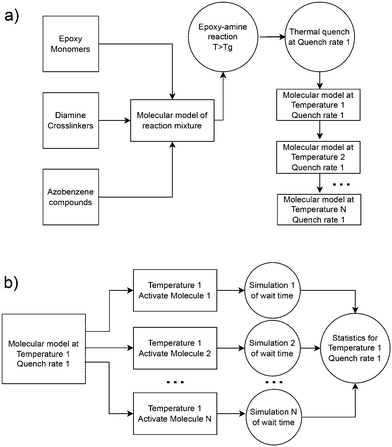
Atomistic simulations were prepared with AB and DR1 molecules dispersed with epoxy–diamine networks, labeled here as PNG-AB and PNG-DR1, respectively. In this work the photoactive molecules are not covalently bonded within the PNG, and interact solely with the network via nonbonded interactions. The composition of the polymer network, azobenzene compounds, and details of the sample preparation are summarized in Fig. 1 and 2a, respectively. First, a stoichiometric reaction mixture of monomer and cross-linker molecules was equilibrated at 1 atm and 730 K. The monomer DGEBA (Fig. 1a) and crosslinker polypropylene-glycol chain (n = 3) (Fig. 1b) were crosslinked to form an epoxy–amine network as shown in Fig. 1c. Cross link bonds were assigned between epoxide and amine groups using a Monte Carlo simulated annealing approach,36 which we have previously used to build various epoxy networks. In this approach, the total length of the newly created crosslink bonds is minimized. A constraint on the connectivity prevented first order loops, i.e., two bonds between a cross-linker and a single linear segment were not permitted. The new bonds were relaxed to their equilibrium length, excess hydrogen atoms were removed, and force field parameters were updated. More details on constructing similar epoxy thermoset networks are available elsewhere.37 Fifteen independent replica structures with different network connectivity were created for the PNG-DR1 samples, while eighteen independent structures were created for PNG-AB samples. Samples were cooled independently using the procedure given in Fig. 2a; the uncertainties for data points were taken as the standard error of values from the replica. The cross-linked networks with responsive molecules were then equilibrated at 1 atm and 730 K for 0.5 ns, followed by a quench into the glassy state by continuously cooling the samples. Two quench rates![[Q with combining dot above]](https://www.rsc.org/images/entities/i_char_0051_0307.gif) of 100 K ns−1 and 10 K ns−1 were applied by repeating the process given in Fig. 2a. The PNG-AB and PNG-DR1 samples were quenched to 200 K (PNG-DR1) and 60 K (PNG-AB), respectively, with a barostat maintaining a pressure of 1 atm. Both PNG-AB and PNG-DR1 samples contain 40 responsive molecules dispersed throughout the PNG, which corresponds to roughly 1.5% of the total sample mass. The resulting densities compare well with experimental values for neat epoxy matrices (i.e., without azobenzenes) of 1.186 g cm−3.38
of 100 K ns−1 and 10 K ns−1 were applied by repeating the process given in Fig. 2a. The PNG-AB and PNG-DR1 samples were quenched to 200 K (PNG-DR1) and 60 K (PNG-AB), respectively, with a barostat maintaining a pressure of 1 atm. Both PNG-AB and PNG-DR1 samples contain 40 responsive molecules dispersed throughout the PNG, which corresponds to roughly 1.5% of the total sample mass. The resulting densities compare well with experimental values for neat epoxy matrices (i.e., without azobenzenes) of 1.186 g cm−3.38
Simulations of pure AB and DR1 molecular glasses were carried out in the same fashion. Samples of AB molecular glass were created with 4096 molecules (≈98![[thin space (1/6-em)]](https://www.rsc.org/images/entities/char_2009.gif) 000 atoms) and were prepared by continuously quenching samples from 500 to 60 K at quench rates
000 atoms) and were prepared by continuously quenching samples from 500 to 60 K at quench rates ![[Q with combining dot above]](https://www.rsc.org/images/entities/i_char_0051_0307.gif) = 10 K ns−1 or 2 K ns−1 as shown in Fig. 2a. Samples of pure DR1 containing 1000 molecules (≈41
= 10 K ns−1 or 2 K ns−1 as shown in Fig. 2a. Samples of pure DR1 containing 1000 molecules (≈41![[thin space (1/6-em)]](https://www.rsc.org/images/entities/char_2009.gif) 000 atoms) were prepared in a similar way at
000 atoms) were prepared in a similar way at ![[Q with combining dot above]](https://www.rsc.org/images/entities/i_char_0051_0307.gif) = 10 K ns−1 and 2 K ns−1, as well as additional quench rates
= 10 K ns−1 and 2 K ns−1, as well as additional quench rates ![[Q with combining dot above]](https://www.rsc.org/images/entities/i_char_0051_0307.gif) = 100, 20, 5, and 1 K ns−1.
= 100, 20, 5, and 1 K ns−1.
Isomerization simulations
For all simulations of isomerization, the initial state was taken from snapshots saved during a temperature quench. As described above, several quench rates were applied for each sample, resulting in a set of glassy samples at different temperatures and densities. From these samples, one independent simulation for each responsive molecule was spawned, where the dihedral interaction for a single AB or DR1 molecule was activated and all other interactions are unchanged. The sampling procedure is shown in Fig. 2b. All simulations were performed in the NVE ensemble with the initial volume and temperature maintained from the starting snapshot. During each simulation, the angle of the activated dihedral of the responsive group was monitored. The simulation was ended after the dihedral angle rotates past π/2 and the corresponding time was recorded as the isomerization wait time tf. For the PNG systems, we include 40 responsive AB or DR1 molecules in each PNG sample, and use 15 independent samples for a total of 600 independent simulations. From each simulation, the atomic coordinates, velocities, and forces are available from the activation at time t = 0 until 50 ps after isomerization. Below, we report the statistics of the time tf and other dynamics of the activated molecule and the surrounding atoms. Similarly, a total of 1000 and 4096 independent simulations were carried out for DR1 and AB, respectively, corresponding to one simulation for each AB or DR1 molecule.3. Results and discussion
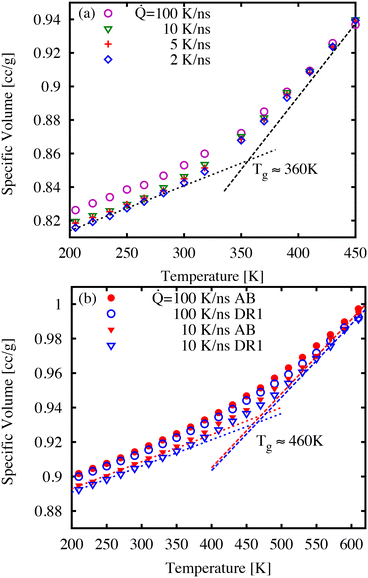
First, we discuss the thermal properties, which were obtained as function of temperature during the quench simulations. It is understood that the quench rate is closely linked to the glass transition temperature, glass density, and ultimately the dynamics of the glass.39Fig. 3 shows examples of specific volume curves (i.e., inverse density) during a temperature quench for three cooling rates. As expected, the sample volume decreases with slower quench rates as well as showing differences in thermal expansion at low and high temperatures. We estimate the glass transition temperature Tg as the point of intersection of linear fits to the high- and low-temperature regions as shown in Fig. 3. For the lowest cooling rates, the Tg-values correspond to 250, 360, 460, and 460 K for AB (not shown), DR1, PNG-AB, and PNG-DR1, respectively. These values are used below to refer to the value of T/Tg for different samples.The values of Tg for polymer network materials (PNG-AB, and PNG-DR1) are similar to one another, and similar to the earlier simulations finding a Tg of 445 K for pure DGEBA-D230 matrices.40 Experimentally, the Tg is typically obtained by finding the change of thermodynamic or mechanical properties in response to a temperature change, such as the trends in specific volume, heat capacity, or viscoelastic moduli. From the perspective of these experiments, the Tg is a temperature at which the relaxation time is comparable to the time-scale of the observation. Because the observational time is much shorter in molecular simulations, the corresponding glass transition temperature is expected to be higher than the typical values of 360 K observed in experiments. Previously, we have shown through time–temperature superposition that an increase of approximately 75–96 K can be expected for DGEBA-D230, a result that is consistent with our predicted Tg here of 460 K.38,40–42
3.1. Wait time distributions
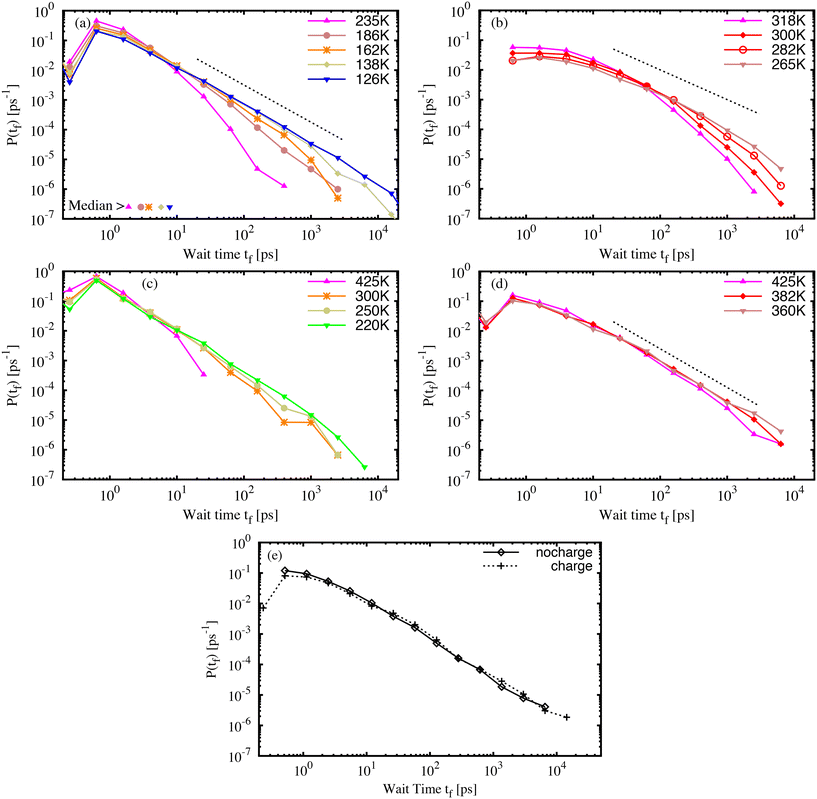
The isomerization model was activated for the azo-groups in the glassy molecular structures, as described in the simulation details. First, it must be emphasised that each material sample contains many AB or DR1 molecules, each with slightly different environments, and each with a different barrier to isomerization. Therefore, both the variations of the local environment as well as the chosen temperature and quench rate of the sample contribute to the process of isomerization. Within each material sample, we capture the effect of the local environment by activating each azo-group, one by one, to develop many individuals samples of isomerization, which are aggregated into statistics that represent an entire sample.The wait time tf between the activation and isomerization depends strongly on the preparation and state of the glassy sample. For all samples, we recorded the wait time for each of the photo-active molecules and examined variations in the wait time characteristics. Fig. 4 shows the probability distribution P(tf) of wait times tf for photoactivated molecules in molecular AB (a) and DR1 (b) glass samples. For both molecules, the distribution of wait times becomes broader with decreasing specific volume. The wait times span more than four decades, from less than one picosecond to more than ten nanoseconds. Interestingly, an approximate linear region develops on the log–log plot as the temperature is lowered. This suggests a power-law distribution of wait times. The exponent of the power-law varies from b ≈ 1.25, shown in Fig. 4(a) and (d), to b ≈ 1.00, shown in Fig. 4(b). The PNG-AB system in (c) also exhibits a power law with b ≈ 1.25.
In addition to the difference in slope, another striking feature of the DR1 molecular glass shown in Fig. 4(b) is the much longer wait times as compared with AB. This appears as a rightward shift in the distribution. For DR1, the peak of the distribution has shifted by over one order of magnitude relative to AB, from a fraction of a picosecond to several picoseconds. Further, for similar values of T/Tg, the distribution of DR1 wait times extends about one order of magnitude longer than the distribution for AB. This is consistent with a smaller power-law exponent than AB. For both AB and DR1, the large tf part of the distribution is difficult to resolve due to computational limits (a single count in the largest histogram bin, located at 20 ns, requires of order 2 × 10⁴ cpu core-hours to simulate).
Fig. 4(c) and (d) show, respectively, the wait time distributions P(tf) for PNG samples with AB (c) and DR1 (d) dispersed throughout the polymer matrix. The curves share some common features with the molecular glasses in Fig. 4(a) and (b). There is a broad distribution that follows a power law with slope b ≈ 1.25 for both the PNG-AB and PNG-DR1 samples. As in the molecular glasses, the samples with DR1 have much longer wait times for the same temperature or density. One feature of the PNG data is that the matrix density is nearly identical for both dispersed responsive molecule types. This feature allows us to isolate the effects of the molecule from that of the matrix. It is notable that the PNG-DR1 data in (d) experience a shift relative to the PNG-AB data in (c) while the molecular glass data in (b) experience both a shift relative to (a) and a change in slope. This strongly suggests the role of the matrix in determining the power-law slope. The power-law slope can be related to a characteristic energy scale of the distribution of energy barriers in glassy systems as b − 1 = kBT/Um, with Um the characteristic energy scale and T the effective temperature due to photoactivation.14,26,43 The smaller slope for DR1 in Fig. 4(b) suggests that the characteristic energy scale for barriers is much larger for DR1 than for AB. All our results confirm that a broad, power-law distribution of wait times develops over a range of densities, as found previously.26
Previous results for molecular AB indicated that density rather than interaction energy or inherent structure energy defines the wait-time distribution. For both the molecular and PNG glasses the distribution of the isomerization wait time for DR1 shifts by about one order of magnitude relative to AB. It is important to understand the origin of this shift, which occurs in addition to the change of slope for the DR1 molecular glass, and at comparable densities in the PNG samples. In order to determine whether side-group electrostatic interactions or steric effects are dominant we simulated the PNG-DR1 sample at 360 K with the side-group partial charges set to zero.
Results for simulations with and without side-group partial charges are shown in Fig. 4(e). The two distributions are strikingly similar, though the visual similarities belie two small, important differences. The “charge” distribution extends beyond the “no charge” distribution, and there is a small but significant reduction of the peak at small time for the “charge” distribution. These two features lead to a two-fold increase in the median of the distribution. We show below that the difference between the AB and DR1 median values at a common density is about a factor of twenty. Thus, we estimate that electrostatic interactions account for a factor of two of this change, while the added volume and nonbonded interactions of the side-group atoms account for about an order of magnitude shift in the median wait time. These results are in accord with previous experimental results that linked isomerization dynamics with molecule size.14 It is important to stress that, although these two effects shift the wait-time distribution in the PNG samples, the effect of such a shift is ultimately small compared to the change of slope seen in the molecular DR1 sample (shown in Fig. 4(b)).
3.2. Characteristic response times
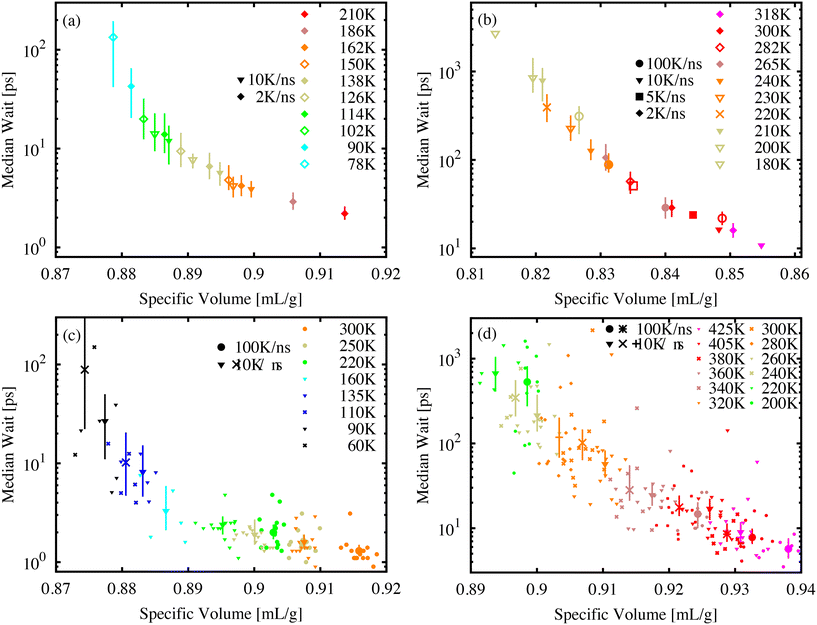
The power-law form of the wait-time distribution, P(tf) ∼ t−bf, makes measuring the distribution mean or higher moments difficult since the mean wait time 〈tf〉 = ∫∞0P(tf)tfdtf depends critically on the cutoff of the distribution P(tf). Further, with decreasing temperature and volume, it becomes difficult to measure this cutoff due to an increasing number of molecules that do not isomerize during our finite simulation time. Instead, it is more useful to measure and record the median wait time. As long as the value of the median is much less than the simulation-time limit, the exact value of tf for events that exceed the simulation-time limit does not influence the median value. It is only necessary to count the number of simulations where tf exceeds the median value.Fig. 5 shows the median wait time as a function of specific volume for molecular AB (a) and DR1 (b). PNG systems with dispersed AB (c) and DR1 (d) are shown below. For all systems, combinations of different temperatures and cooling-rate preparations are shown. As seen in the figure, the median time depends strongly on density, with a good collapse onto a single curve for different temperatures and quench rates. A strong density and temperature dependence was experimentally recorded for azobenzene within different polymer matrix materials.13
The increase in median wait times shown from Fig. 5(a) to (b) and from (c) to (d) reiterate the shift to longer times for DR1 relative to AB. The molecular glasses in (a) and (b) have significantly different specific volumes, highlighting the utility of the direct comparison between (c) and (d). For these PNG samples there is an increase in the wait time corresponding to a factor of approximately 20–30 from the AB to DR1-PNG samples at a common specific volume of 0.915 cm3 g−1.
For each of the systems in Fig. 5 there appears to be a diverging median wait time with decreasing specific volume. A significant computational effort was made to decrease the sample specific volume until the median wait time exceeded the exponential extrapolation from large specific volume (i.e., a straight line on the log-linear axes) by at least one order of magnitude. The logarithmic y-axis shows the dramatic increase over small changes in specific volume or temperature. In the AB and DR1 molecular glasses the median time increases by over one order of magnitude over a temperature range as small as 40 K. For the PNG systems in Fig. 5(c) and (d), the DR1 molecules appear to reach the critical point of diverging median time at significantly higher specific volume than AB. This is consistent with the steric effects dramatically increasing the isomerization wait time. Previously, experimental studies of isomerization were carried out for glasses containing azobenzene derivatives at different densities obtained from physical vapor deposition.44 We note that, in those studies, the isomerization rate was observed as an exponential decrease with increasing density. Fig. 5 predicts a similar pattern, where a divergence in wait time occurs as the specific volume is decreased.
3.3. Post-isomerization dynamics
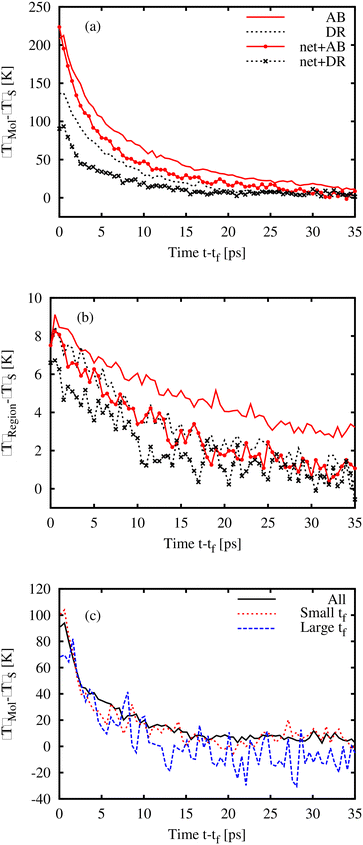
Fig. 6(a) shows the temperature change within the AB or DR1 photoactivated molecule at a time (t − tf) after isomerization. The rise in the molecule temperature is found by subtracting the bulk temperature 〈T〉S from the molecular temperature. Several patterns are present. First, for the samples shown here, molecular glasses of AB and DR1 at 162 K and 318 K respectively, and polymeric glasses at PNG-AB and PNG-DR1 at 300 K and 360 K, respectively, the peak temperature depends on the mass and size of the molecule. The larger DR1 has a lower peak temperature, likely due to additional molecular degrees of freedom. Second, the decay of the kinetic energy in the activated molecule is faster within the crosslinked PNG samples. The temperature for an 8 nm3 region 〈T〉Region around the activated molecule is shown in Fig. 6(b). There is a relatively small shift down in the peak and decay temperature in the PNG samples, likely due to more effective thermal diffusion. In both Fig. 6(a) and (b) curves represent the data averaged over approximately 300 realizations to reduce noise (before averaging, the curves have been shifted by the value of tf so that the isomerization time locations coincide.). Data from the PNG-DR1 system are also shown in Fig. 6(c), with separate curves representing the molecule temperature for all photoactivated molecules, and for molecules with long or short isomerization time tf. Molecules with large tf (defined here as tf > 1 ns) have slightly lower peak temperature values than molecules with small tf < 100 ps. This corresponding reduction in kinetic energy is approximately the difference between the dihedral potential energy (PE) at 180° and that at 90°. When the isomerization dynamics is fast, all the PE associated with the dihedral angle is converted to KE immediately upon activation, while for large wait times this conversion occurs more slowly, over the timescale tf. Finally, we note that the magnitude of the local temperature rise in our MD simulations is very close to local temperature changes of 100–200 K measured in experiments.45 In those experiments IR spectral band shifts due to photoactivation were compared with spectra at different temperatures to impute an effective temperature Teff for the local chemical structure associated with each band.3.4. Local environment
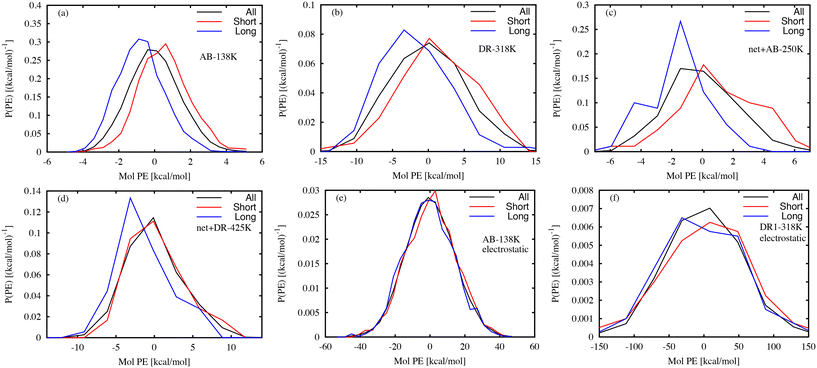
Several previous experimental efforts have used photoresponsive molecules as probes of the local free volume.8,10–14 MD simulations are well-suited for characterizing the link between the local environment and the photoresponse time. Previously, we used MD simulations of AB molecular glasses to identify the local volumes that have a large influence on the isomerization time.26 Below, we examine links between the local interaction energy and the characteristic photoresponse time.The potential energy (PE) is a useful scalar quantity that encodes information about both local atomic configurations and local interactions. Previous studies have shown that the potential energy reflects information about local stability in a glass,46 and that the local molecular stability is linked to the wait time tf for isomerization after photoactivation. Fig. 7 shows the distribution of local interaction energy between each photo-activated molecule and the surrounding matrix, where the energy is taken from only non-bonded interactions. Separate curves are shown for the 10% of DR1 or AB molecules with the largest or smallest tf values. Because the distribution of tf is so broad, the smallest and largest 10% of values can vary by up to five orders of magnitude, from a fraction of a picosecond to tens of nanoseconds. Representative systems shown in Fig. 7(a–d) indicate that molecules with large tf typically have lower interaction energy, while events with small tf typically follow the overall distribution or have higher PE. Intuitively, this indicates that events with large tf values have a more stable local environment relative to events with small tf. At the population level it is clear that long and short events have different mean PE values. However, it is difficult to distinguish molecules using this measure due to the small difference in the distribution averages relative to the distribution widths. A similar analysis of only the electrostatic interactions was carried out, given in Fig. 7(e) and (f). In this case, the electrostatic PE distributions for the long and short wait-time molecules are similar to the distribution found for all molecules.
One way to quantify the difference in the mean relative to the width is the “informedness”  , which measures the rate of true-positive (TP) and true-negative (TN) identifications relative to false identifications (FP & FN), and varies from zero for a random guess to unity for perfect classification. In this case, we use the PE distributions to choose a single value of PE such that lower values can be classified as “long” and higher as “short”. Using Fig. 7(a) as an example, choosing an optimal value of −0.2 kcal mol−1 (unshifted −35.3 kcal mol−1), which is slightly less than the average of −35.1 kcal mol−1, would correctly classify 1369 “long” tf environments and 1382 “short” tf environments out of 2000, or J = 0.37. For other systems, J = 0.3, 0.45, and 0.27, respectively for the systems in Fig. 7(b)–(d). The electrostatic energies in (e) and (f) are clearly more difficult to partition as stable or unstable, with J values near zero. Based on the values J, we find that the total nonbonded potential energy does contain enough information about the local density, atomic configuration and interactions to loosely reflect the local stability, whereas the electrostatic energy is not indicative.
4. Conclusion
We have applied a classical forcefield derived from ab initio quantum calculations to understand the stability of photoresponsive molecules embedded in molecular and polymer network glasses (PNGs) through the use of large-scale molecular dynamics (MD) simulations. MD simulations scale to thousands of molecules, and are still fast enough to simulate hundreds of glassy systems over tens of nanoseconds. This relatively large sampling allowed the distribution of isomerization wait times P(tf) to be characterized over more than five decades in time. A power-law distribution is evident for both PNG and molecular glasses, with a power-law exponent of b ≈ 1.25 or b ≈ 1.0, depending on the molecule and surrounding matrix. The range of the power-law behavior extends to longer time with decreasing temperature or specific volume. Importantly, for each combination of molecule and surrounding matrix, data for the median wait time collected from differing temperatures and quench rates![[Q with combining dot above]](https://www.rsc.org/images/entities/i_char_0051_0307.gif) was found to follow a single master curve as a function of specific volume. Further, the median wait time was seen to diverge at a specific volume that depends on both the molecule and the matrix. We anticipate this data collapse of the isomerization times will simplify the design of new photo-responsive glasses to be used under different temperatures or environmental conditions.
was found to follow a single master curve as a function of specific volume. Further, the median wait time was seen to diverge at a specific volume that depends on both the molecule and the matrix. We anticipate this data collapse of the isomerization times will simplify the design of new photo-responsive glasses to be used under different temperatures or environmental conditions.
In both the molecular glass and PNG systems, DR1 responded slower than AB, resulting in a shift of the wait-time distribution by more than an order of magnitude. The significantly smaller slope, b ≈ 1, of the wait-time distribution for the DR1 molecular glass indicates that higher overall system densities are closely linked to the distribution of energy barriers for isomerization. Thus, the broadening of the wait-time distribution dramatically increases the characteristic isomerization time scale and consequently decreases the isomerization rate.
After isomerization, local heating was observed with temperature increases in the range of 100 to 200 K for atoms within the azobenzene or DR1 molecule. These values are close to that observed in isomerization experiments.45 Like the isomerization wait time, the post-isomerization temperature increase and dynamics depended on the choice of the isomerizing molecule and the composition of the surrounding matrix. However, these post-isomerization differences were 20–50%, smaller than the change of the isomerization wait time (or rate). This smaller difference can be attributed to several factors related to the molecule and matrix: (1) the peak temperature of the larger DR1 molecules is lower than that of the AB molecules due to its larger molar mass and corresponding higher heat capacity; (2) the PNG glass samples allow heat to quickly diffuse away from the isomerizing molecule and the region around it; and (3) molecules that have a large isomerization wait time tf also have a smaller peak temperature during isomerization.
Finally, we note that the detailed information available from MD simulations provides an opportunity to link local measures of the molecular environment to the isomerization wait time. Experimental work on other azo-loaded epoxy networks indicate that strong interactions with the matrix environment, such as covalently attaching the azo-molecules, can essentially lock in the cis or trans state of the isomer.47 In the present work, we examined the local non-bonded interaction energies of the molecule and matrix finding that, although clear statistical differences were present between the long and short isomerization wait time populations, the strength of the potential energy interaction did not predict the wait time with high confidence. Because the interactions of azo-molecules with the matrix can be tuned by a variety of physical or chemical bonds,48 future efforts to closely correlate the chemical environment with isomerization features should prove critical for a rational chemical design of responsive glasses.
Conflicts of interest
There are no conflicts to declare.Acknowledgements
KMS acknowledges support of the ORAU fellowship. Research was sponsored by the Army Research Laboratory and was accomplished under Cooperative Agreement Number W911NF-18-2-0105. The views and conclusions contained in this document are those of the authors and should not be interpreted as representing the official policies, either expressed or implied, of the Army Research Laboratory or the U.S. Government. The U.S. Government is authorized to reproduce and distribute reprints for Government purposes notwithstanding any copyright notation herein.Notes and references
- B. K. M. Lee, H. Koerner, D. H. Wang, L.-S. Tan, T. J. White and R. A. Vaia, Macromolecules, 2012, 45, 7527–7534 CrossRef CAS.
- D. H. Wang, K. M. Lee, Z. Yu, H. Koerner, R. A. Vaia, T. J. White and L.-S. Tan, Macromolecules, 2011, 44, 3840–3846 CrossRef CAS.
- D. H. Wang, J. J. Wie, K. M. Lee, T. J. White and L.-S. Tan, Macromolecules, 2014, 47, 659–667 CrossRef CAS.
- J. J. Wie, D. H. Wang, V. P. Tondiglia, N. V. Tabiryan, R. O. Vergara-Toloza, L.-S. Tan and T. J. White, Macromol. Rapid Commun., 2014, 35, 2050–2056 CrossRef CAS PubMed.
- M. L. Baczkowski, D. H. Wang, D. H. Lee, K. M. Lee, M. L. Smith, T. J. White and L.-S. Tan, ACS Macro Lett., 2017, 6, 1432–1437 CrossRef CAS PubMed.
- J. J. Wie, D. H. Wang, K. M. Lee, T. J. White and L.-S. Tan, J. Mater. Chem. C, 2018, 6, 5964–5974 RSC.
- N. Hosono, M. Yoshikawa, H. Furukawa, K. Totani, K. Yamada, T. Watanabe and K. Horie, Macromolecules, 2013, 46, 1017–1026 CrossRef CAS.
- C. S. Paik and H. Morawetz, Macromolecules, 1972, 5, 171–177 CrossRef CAS.
- Y. Imai, K. Naka and Y. Chujo, Macromolecules, 1999, 32, 1013–1017 CrossRef CAS.
- J. S. Royal and J. M. Torkelson, Macromolecules, 1992, 25, 4792–4796 CrossRef CAS.
- L. Lamarre and C. S. P. Sung, Macromolecules, 1983, 16, 1729–1736 CrossRef CAS.
- T. Kondo, K. Yoshii, K. Horie and M. Itoh, Macromolecules, 2000, 33, 3650–3658 CrossRef CAS.
- T. Naito, K. Horie and I. Mita, Polymer, 1993, 34, 4140–4145 CrossRef CAS.
- T. Naito, K. Horie and I. Mita, Macromolecules, 1991, 24, 2907–2911 CrossRef CAS.
- E. Wei-Guang Diau, J. Phys. Chem. A, 2004, 108, 950–956 CrossRef.
- Y.-C. Lu, E. W.-G. Diau and H. Rau, J. Phys. Chem. A, 2005, 109, 2090–2099 CrossRef CAS.
- J. A. Gámez, O. Weingart, A. Koslowski and W. Thiel, J. Chem. Theory Comput., 2012, 8, 2352–2358 CrossRef PubMed.
- M. Pederzoli, J. Pittner, M. Barbatti and H. Lischka, Nanoengineering: Fabrication, Properties, Optics, and Devices IX, 2012, pp. 152–161 Search PubMed.
- R. S. H. Liu and G. S. Hammond, Proc. Natl. Acad. Sci., 2000, 97, 11153–11158 CrossRef CAS.
- M. Böckmann, N. L. Doltsinis and D. Marx, J. Chem. Phys., 2012, 137, 22A505 CrossRef.
- M. Böckmann, S. Braun, N. L. Doltsinis and D. Marx, J. Chem. Phys., 2013, 139, 084108 CrossRef.
- M. Böckmann and N. L. Doltsinis, J. Chem. Phys., 2016, 145, 154701 CrossRef.
- M. Böckmann, C. Peter, L. D. Site, N. L. Doltsinis, K. Kremer and D. Marx, J. Chem. Theory Comput., 2007, 3, 1789–1802 CrossRef.
- M. Böckmann, N. L. Doltsinis and D. Marx, Phys. Rev. E: Stat., Nonlinear, Soft Matter Phys., 2008, 78, 036101 CrossRef PubMed.
- M. Böckmann, N. L. Doltsinis and D. Marx, J. Phys. Chem. A, 2010, 114, 745–754 CrossRef PubMed.
- K. M. Salerno, J. L. Lenhart, J. J. de Pablo and T. W. Sirk, J. Phys. Chem. B, 2020, 124, 6112–6120 CrossRef CAS PubMed.
- I. Mita, K. Horie and K. Hirao, Macromolecules, 1989, 22, 558–563 CrossRef CAS.
- T. Naito, K. Horie and I. Mita, Eur. Polym. J., 1990, 26, 1295–1300 CrossRef CAS.
- R. E. Robertson, J. Polym. Sci., Polym. Phys. Ed., 1979, 17, 597–613 CrossRef CAS.
- S. H. Glarum, J. Chem. Phys., 1960, 33, 1371–1375 CrossRef CAS.
- J. Klafter and M. F. Shlesinger, Proc. Natl. Acad. Sci., 1986, 83, 848–851 CrossRef CAS PubMed.
- M. F. Shlesinger and E. W. Montroll, Proc. Natl. Acad. Sci., 1984, 81, 1280–1283 CrossRef CAS.
- S. Plimpton, J. Comput. Phys., 1995, 117, 1–19 CrossRef CAS.
- W. Shinoda, M. Shiga and M. Mikami, Phys. Rev. B: Condens. Matter Mater. Phys., 2004, 69, 134103 CrossRef.
- R. Hockney and J. Eastwood, Computer Simulation Using Particles, Taylor & Francis, 1988 Search PubMed.
- R. Khare, M. E. Paulaitis and S. R. Lustig, Macromolecules, 1993, 26, 7203–7209 CrossRef CAS.
- R. M. Elder, D. B. Knorr, J. W. Andzelm, J. L. Lenhart and T. W. Sirk, Soft Matter, 2016, 12, 4418–4434 RSC.
- L. M. McGrath, R. S. Parnas, S. H. King, J. L. Schroeder, D. A. Fischer and J. L. Lenhart, Polymer, 2008, 49, 999–1014 CrossRef CAS.
- R. M. Elder, A. L. Forster, A. Krishnamurthy, J. M. Dennis, H. Akiba, O. Yamamuro, K. Ito, K. M. Evans, C. Soles and T. W. Sirk, Soft Matter, 2022, 18, 6511–6516 RSC.
- T. W. Sirk, K. S. Khare, M. Karim, J. L. Lenhart, J. W. Andzelm, G. B. McKenna and R. Khare, Polymer, 2013, 54, 7048–7057 CrossRef CAS.
- A. Lee and G. B. McKenna, Polymer, 1988, 29, 1812–1817 CrossRef CAS.
- L. Shan, K. Verghese, C. Robertson and K. Reifsnider, J. Polym. Sci., Part B: Polym. Phys., 1999, 37, 2815–2819 CrossRef CAS.
- G. Fang, J. Maclennan, Y. Yi, M. Glaser, M. Farrow, E. Korblova, D. Walba, T. Furtak and N. Clark, Nat. Commun., 2013, 4, 1–10 Search PubMed.
- Y. Qiu, L. W. Antony, J. M. Torkelson, J. J. de Pablo and M. D. Ediger, J. Chem. Phys., 2018, 149, 204503 CrossRef PubMed.
- J. Vapaavuori, A. Laventure, C. G. Bazuin, O. Lebel and C. Pellerin, J. Am. Chem. Soc., 2015, 137, 13510–13517 CrossRef CAS PubMed.
- J. Helfferich, I. Lyubimov, D. Reid and J. J. de Pablo, Soft Matter, 2016, 12, 5898–5904 RSC.
- M. Adeel, B. Zhao, S. Xu and S. Zheng, J. Phys. Chem. B, 2019, 123, 10110–10123 CrossRef CAS PubMed.
- P. Weis and S. Wu, Macromol. Rapid Commun., 2018, 39, 1700220 CrossRef PubMed.
| This journal is © The Royal Society of Chemistry 2023 |

