 Open Access Article
Hydrothermal synthesis and characterization of the antimony–tin oxide nanomaterial and its application as a high-performance asymmetric supercapacitor, photocatalyst, and antibacterial agent
Eswaran
Amutha
a,
Subramanian
Rajaduraipandian
b,
Minnalkodi
Sivakavinesan
 a and
Gurusamy
Annadurai
 *a
*a
aSri Paramakalyani Centre of Excellence in Environmental Sciences, Manonmaniam Sundaranar University, Alwarkurichi - 627412, India. E-mail: gannadurai@msuniv.ac.in
bSri Paramakalyani College, Manonmaniam Sundaranar University, Alwarkurichi - 627412, India
First published on 21st November 2022
Abstract
We have synthesized antimony-tin oxide (ATO) nanoparticles chemically for use in antibacterial, photocatalytic, and supercapacitor applications. The XRD pattern reveals the hexagonal structure, while the FTIR spectra validate the functional groups. The agglomerated nanostructures, which are 40–50 nm thick and 100 nm long, are shown in the SEM images as having spherical, cube, square, and rod form morphologies. In a DLS test, ATO has a zeta potential of 28.93/−28.00 mV, demonstrating strong colloidal stability in the suspension. With minimum inhibitory concentrations (MIC) ranging from 25 to 100 g mL−1, ATO is also tested for its antibacterial activity against a variety of Gram-positive and Gram-negative bacteria. Additionally, rhodamine dye was broken down by ATO nanoparticles in 240 minutes with a degradation efficiency of 88 percent. The specific capacitance (Cs) and energy density (E) values of ATO nanoparticles further demonstrated their suitability for use in supercapacitors.
1. Introduction
Researchers have created revolutionary clean renewable energy storage technologies in response to energy issues and environmental damage.1 Due to their exceptional qualities, such as high power density, long lifetime, and a quick charge/discharge process, supercapacitors, a type of energy conversion and storage devices, have drawn a lot of attention.2,3 There have been numerous reports of nanostructured materials for use in supercapacitors.4 It was thought that these nanostructured materials outperform bulk materials in terms of capacitance.5Since they have fast charging times, high power densities, and long cycle lives over repeated charge and discharge times, supercapacitors-one of the most popular electrical energy storage devices—are attractive candidates for backup power, cell phone cameras, regenerative braking, and hybrid electric vehicles.6,7
Tin oxide is one of the significant wide direct band gap semiconductors (Eg = 3.6 eV) at RT with a lot of excellent applications in various fields, for example, chemical sensors, lithium-ion batteries, solar cells, catalysis, etc.8 Tin oxide (SnO2) possesses a wide energy gap and be regarded as an n-type semiconductor oxide.9 Antimony (Sb) as an n-type dopant is one of the most common dopants for SnO2. The dopant Sb modifies the SnO2 structure, such as the band structure.10 The lattice structure of SnO2 greatly increases after the addition of Sb atom into tin oxide solution. The electron conductivity of the nanomaterial increases with the increase in crystal lattice planes.11,12 A Sb atom can be regarded as an excellent conductive doped material. A SnO2 doped Sb atom (ATO) possesses high conductivity that provides a high tunnel for the easy transfer of electrons between the electrode material and electrolyte.13
Nanoparticles have long been known for their antimicrobial behavior against Gram-positive and Gram-negative bacteria, pathogens, and other microbes.14 Metal oxide nanoparticles serve as antimicrobial agents owing to their large surface area. Out of several metal oxide nanomaterials, scientists have more interest in SnO2 nanoparticles because of their novel properties such as high chemical stability, high transparency, low electrical sheet resistance, etc.15 Other than these applications, SnO2 has received attention as an antimicrobial agent and has played an essential role against the growth of various bacterial strains like Staphylococcus aureus, Bacillus subtilis, Enterobacter sp., Pseudomonas fluorescens, and Escherichia coli.16
Dyes from textile, paper, and other industries are prime examples of environmental contaminants. Among these methods, photocatalytic degradation of dyes using UV light is one of the most prominent techniques because the reactions are carried out under ambient conditions that are cost-effective and simple.17 Various photocatalysts like TiO2, ZnO, WO3, CeO2, and ZrO2 nanoparticles are used for degradation of organic dyes. Out of these catalysts, ATO nanoparticles have been proven to be competent photocatalysts for environmental applications because of their strong redox ability, nontoxicity, long-term stability, and low cost. However, metal oxides such as TiO2, SnO2, ZnO have been found to be better photocatalysts for the degradation of organic dyes in aqueous solution.18 SnO2 as an n-type semiconductor has also been reported for the degradation of various azo dyes. Besides antimicrobial activities, ATO finds improved results in photocatalytic activities.13
The creation of antimony tin oxide (ATO) nanoparticles utilising the hydrothermal method under UV light irradiation was discussed in terms of catalysis, high performance asymmetric supercapacitor and antibacterial research. Ultraviolet-visible (UV-vis) spectroscopy, Fourier transform infrared (FT-IR) spectroscopy, X-ray diffraction (XRD) analysis, dynamic light scattering (DLS) analysis, and scanning electron microscopy (SEM) were used to evaluate the produced ATO nanoparticles.
2. Materials and methods
2.1 Chemicals, reagents, and media
Sigma Aldrich Pvt Ltd, in India, supplied analytical grade tin chloride, antimony chloride, ethanol, polyvinyl pyrrolidone (PVP), poly vinyl alcohol (PVA), and ethylene glycol. Gram-positive Staphylococcus aureus and Bacillus subtilis, as well as Gram-negative Escherichia coli, Enterobacter sp., and Pseudomonas fluorescens bacterial isolates, were purchased from MTCC, Chandigarh.2.2 Synthesis of antimony tin oxide (ATO) nanoparticles
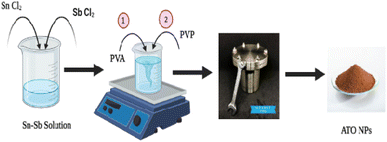
Antimony tin oxide (ATO) nanoparticles were synthesized using the hydrothermal method. Using a magnetic stirrer, 100 mL of ethanol and distilled water were combined with 0.06 M of tin chloride and 0.04 M of antimony chloride. The solution was heated steadily and vigorously for 30 minutes to combine the two salts into a homogenous mixture. Then, 1 g of PVP and PVA were gradually added, drop by drop, to the aforementioned mixture. To the aforementioned solution 10 mL of ethylene glycol solution was added and constantly swirled for 30 minutes. The mixture was sealed in a Teflon autoclave with a capacity of 100 mL and kept at 120 °C for 12 hours and cooled to ambient temperature. The precipitate was centrifuged and then washed numerous times with distilled water and ethanol. The particles are then dried for 24 hours in a hot air oven at 80 °C. The particles are then annealed for 2 hours at 600 °C (Scheme 1).2.3 Electrochemical measurement
Electrochemical behavior of ATO nanoparticles was examined using cyclic voltammetry (CV), galvanostatic charge–discharge (CD), and electrochemical impedance spectroscopy (EIS). The working electrode was created by mixing nanocomposite materials in a 85![[thin space (1/6-em)]](https://www.rsc.org/images/entities/char_2009.gif) :
:![[thin space (1/6-em)]](https://www.rsc.org/images/entities/char_2009.gif) 15
15![[thin space (1/6-em)]](https://www.rsc.org/images/entities/char_2009.gif) :
:![[thin space (1/6-em)]](https://www.rsc.org/images/entities/char_2009.gif) 10 weight ratio with conductive carbon (carbon black) and binder (PDFE). The resulting electrode paste (∼2 mg) was placed on a Ni foam current collector that had been pre-treated and employed as a working electrode. Electrochemical experiments were performed in a 3 M KOH electrolyte using a three-electrode cell with Pt foil as the counter electrode and Ag/AgCl as the reference electrode. Different scan rates and current rates were used in CV and CD investigations. The specific capacitance, energy density and power density of the system were calculated from the discharge profile by using the following formula:
10 weight ratio with conductive carbon (carbon black) and binder (PDFE). The resulting electrode paste (∼2 mg) was placed on a Ni foam current collector that had been pre-treated and employed as a working electrode. Electrochemical experiments were performed in a 3 M KOH electrolyte using a three-electrode cell with Pt foil as the counter electrode and Ag/AgCl as the reference electrode. Different scan rates and current rates were used in CV and CD investigations. The specific capacitance, energy density and power density of the system were calculated from the discharge profile by using the following formula: | (1) |
 | (2) |
2.4 Antibacterial properties
2.5 Photocatalytic activity and kinetic studies
The photocatalytic performance of ATO nanoparticles was assessed by measuring the photocatalytic degradation of rhodamine dye under UV irradiation. In a typical process, 0.1 g of ATO was added to 100 mL of aqueous rhodamine dye solution with a 1 ppm starting concentration. The suspension of ATO nanoparticles and dye solution was agitated in the dark for 30 minutes prior to irradiation to reach adsorption/desorption equilibrium. The suspension was then exposed to UV radiation. Approximately 2 mL of the suspension was withdrawn from the combination at regular intervals (30 minutes) and centrifuged to separate the photocatalyst particles during irradiation. The concentration of rhodamine solution in the supernatant was then measured using a UV-vis spectrophotometer, which has a distinctive absorbance at λmax = 550 nm.The degradation efficiency was calculated using the formula mentioned below:
 | (3) |
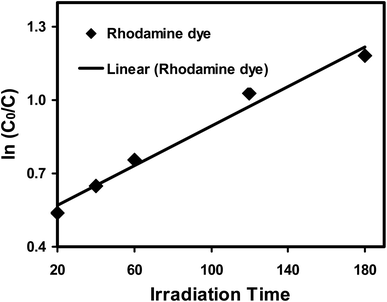
The kinetics of the photodegradation of rhodamine dye was investigated using the Langmuir–Hinshelwood model.19 The following pseudo-first-order equation, according to this approach, can describe the reaction's kinetics:
| ln(C0/C) = kt + s | (4) |
2.6 Embryo toxicity test
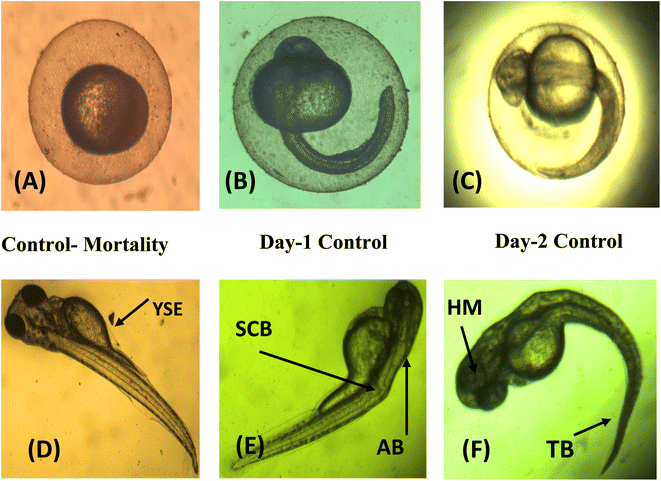
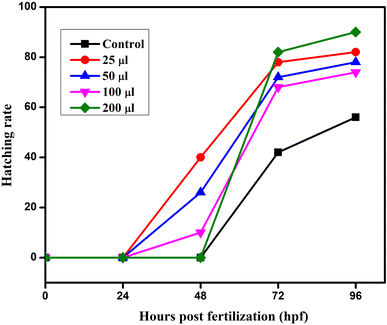
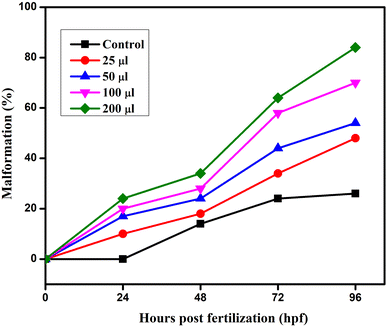
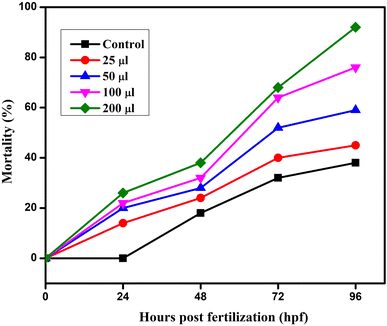
The embryonic developmental stage of a zebrafish embryo was studied under a stereomicroscope for the whole exposure period following fertilisation. For 24–96 hpf, the embryos were treated to doses of ATO nanoparticles (0, 25, 50, 100, and 200 μg mL−1). Every 24 hours, the hatching rate and embryonic death were assessed. The ratio of hatching embryos to the remaining viable embryos in each well is known as the hatching rate. The embryos and larvae from the control and treatment groups both had malformations that were documented and photographed. A stereomicroscope (Optica, Italy Model; T3 15 A) was used to image the deformed embryos, and every 24 hours, the proportion of malformed embryos was recorded.2.7 Characterization of ATO nanoparticles
The chemical composition of the synthesized ATO nanoparticles was studied by using an FTIR spectrometer (PerkinElmer LS-55- Luminescence spectrometer). The phase variety and grain size of the synthesized ATO nanoparticles were determined by X-ray diffraction spectroscopy (Philips PAN analytical). Dynamic light scattering (DLS) which is based on the laser diffraction method with multiple scattering techniques was employed to study the average particle size of ATO nanoparticles (ZETA sizer Nanoseries, Malvern instrument Nano Zs). TGA is considered as the most important method for studying thermal stability of polymers and nanoparticles. The thermal stability of the ATO nanoparticles was investigated by using a TGDTA (Hitachi-Thermo Gravimetry/Differential Thermal Analyzer STA7000, Japan). The scanning electron microscopic analysis was done using a Carl Zeiss Evo 18 secondary electron microscope with an EDS machine with the magnification up to 50–100 K depending on the sample. Fluorescence characterization of the ATO Nanoparticles was performed using an Instrument model L S4 5.3. Results and discussion
3.1 Fourier transform infrared spectroscopy
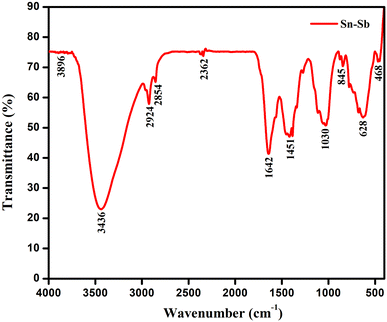
The FT-IR spectra of the produced ATO nanoparticles was analysed to determine the groups responsible for nanoparticle capping and stability. Fig. 1 shows the FTIR spectra of the as-prepared materials, determined in the frequency20 range of 4000 to 350 cm−1.The presence of a peak at 3896 cm−1 was for the O–H stretch of alcohols and a peak at 3436 cm−1 corresponds to the O–H stretch of H–bonded alcohols and phenols. The peak located at 2924 and 2854 cm−1 corresponds to the stretching mode vibration of the C–H stretch of alkanes. The absorption peak at 1642 cm−1 might be due to the C![[double bond, length as m-dash]](https://www.rsc.org/images/entities/char_e001.gif) C stretch (conjugated) of alkenes.21 The peaks at 1451 cm−1 and 1030 cm−1 represent the C–F stretching of alkyl halides and C–C stretch of ketones. The peaks at 845 cm−1 correspond to C–H bend of (mono) aromatics. The peaks at around 628 cm−1 are for acetylenic C–H bend alkynes, and the one at 468 cm−1 for C–X stretch of bromoalkanes.
C stretch (conjugated) of alkenes.21 The peaks at 1451 cm−1 and 1030 cm−1 represent the C–F stretching of alkyl halides and C–C stretch of ketones. The peaks at 845 cm−1 correspond to C–H bend of (mono) aromatics. The peaks at around 628 cm−1 are for acetylenic C–H bend alkynes, and the one at 468 cm−1 for C–X stretch of bromoalkanes.
3.2 Structural analysis
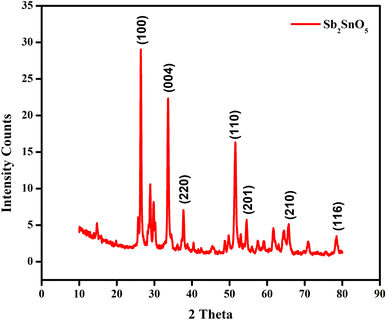
The crystallinity and phase purity of the ATO nanoparticles was characterized by using X-ray diffraction (XRD) in the diffraction angle (2θ) ranges between 10° to 80° with a scanning rate of 5° per minute. The XRD pattern of ATO nanoparticles contains several peaks as shown in Fig. 2. The obtained XRD characteristics peaks show that the intensity peaks were observed at 17.61°, 25.64°, 28.08°, 29.61°, 33.98°, 42.94° and 50.2° corresponding to the (hkl) values of the peaks (100), (004), (220), (110), (201), (210) and (116). The well extended intensity peaks indicate the polycrystalline nature and size reduction of ATO.22 All the identified ATO nanoparticle peaks are in good agreement with the JCPDS card number 73-2141 and LCSD card number 4242. It clearly indicates the formation of hexagonal structured ATO.The average crystallite size of the ATO nanoparticles was found by using the Debye–Scherrer formula, where K is a constant (0.91), λ is the wavelength of the X-ray (λ = 1.5418 Å), θ is the diffraction angle for the peak and β is the full width at half maximum (FWHM).5 The average crystallite size of the samples synthesized by this method is 32.24 nm.23
3.3 Particle size analyzer
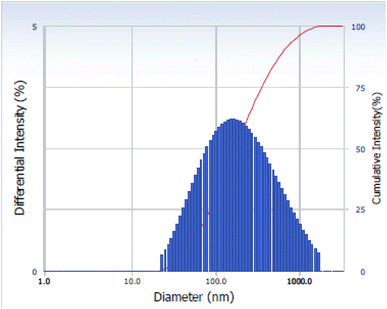
Dynamic light scattering (DLS) was used to determine the size distribution of ATO nanoparticles. The DLS method measures the amount of scattered light travelling through a nanoparticle solution. The average size distribution of the ATO nanoparticles is 55 nm, as shown in Fig. 3.3.4 Thermogravimetric analysis
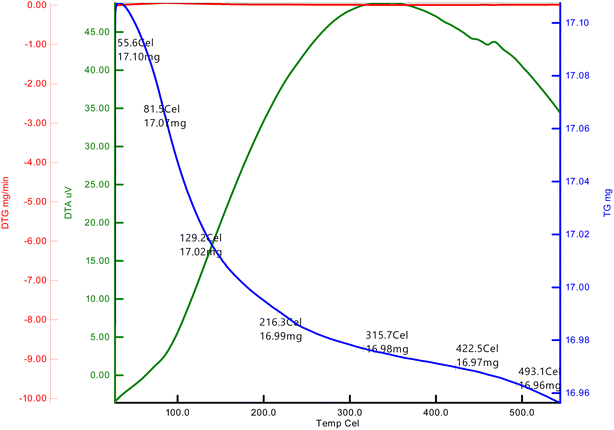
The TGA of dried ATO nanoparticles aged in air for 24 hours at optimal concentration before being analysed in nitrogen at a heating rate of 20 °C min−1, as shown in Fig. 4. In the temperature range of 50–80 °C, the first weight loss was 17.10 mg in ATO. The second weight loss occurred at 130–129 °C, which was attributed to water evaporation from Sb–SnCl2 during the production of ATO nanoparticles.24 The third weight loss was at 210–216 °C, which is due to Sb–SnCl2 breakdown. In the temperature range of 430–422 °C, a sharp weight loss of 16.97 mg in ATO was observed. Then Sb–SnCl2 decomposes to generate SnO and CO2, resulting in a 28 percent weight loss.83.5 Scanning electron microscopy (SEM) and EDAX
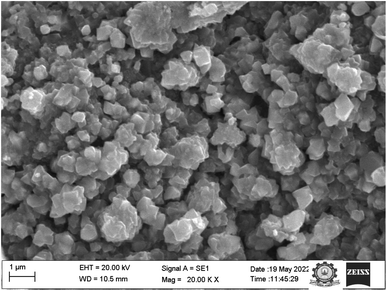
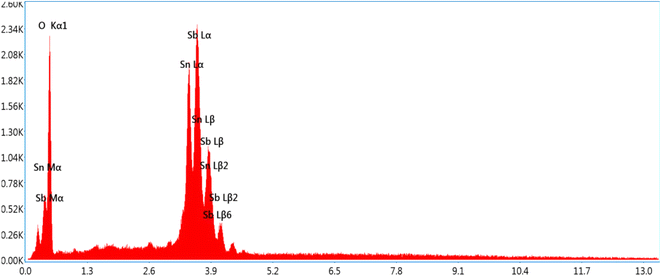
Fig. 5 shows SEM imaging of the ATO nanoparticles. The structure and morphological behaviour of the bimetallic nanoparticles are supported by SEM images. When PVP and PVA were utilised as reducing and capping agents, distinct morphologies of ATO nanoparticles were produced.25 With agglomerated nanostructured ATO nanoparticles, ATO nanoparticles produced approximately spherical, cube, square, and rod shapes, respectively. This could be owing to the fact that different chemical compounds have varied quantities and types of capping agents. The shifts and differences in the regions of the peaks found in the FTIR study also support this.26EDX analysis was carried out to understand the semi quantitative elemental composition of ATO nanoparticles. The peaks showed the presence of antimony and tin (Fig. 6) particles. The total metal content was quite high to justify the purity of metallic nanoparticles.27
3.6 Fluorescence spectroscopy
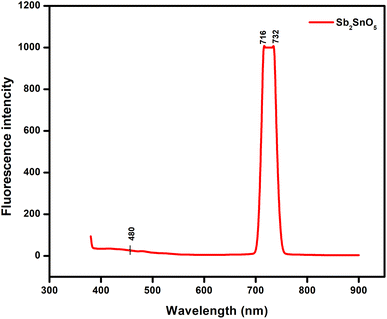
A fluorescence spectrophotometer was used to characterize the fluorescence spectra of the ATO nanoparticles, as shown in Fig. 7. The fluorescence spectrum is an excellent tool for determining energy levels.28Fig. 7 shows the fluorescence spectra of ATO nanoparticles measured with an excitation wavelength. At 716 and 732 nm, the fluorescence (FL) band's centre appears. The fluorescence intensity increased as the size of the ATO nanoparticles grew larger. The intensity of the fluorescence emission band and the absorption band of ATO nanoparticles were both concentration and particle size dependent, according to these findings.29
3.7 The energy storage mechanism
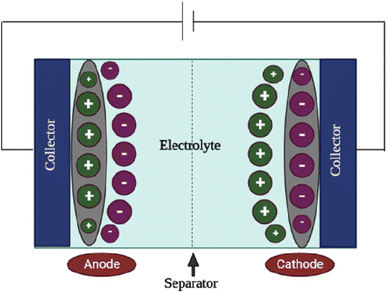
The supercapacitor, as depicted in Scheme 2, is primarily made up of numerous elements, including current collectors, electrodes, electrolytes, and separators. The role of separator is similar to the separator in the battery. In addition to allowing ions to pass through, it isolates the two electrodes to prevent short circuits between the electrodes. Supercapacitors work on the simple premise that they can store electrical energy by forming an electric double-layer capacitance at the interface between the electrolyte and the bath solution.3.8 Electrochemical studies
Using cyclic voltammetry (CV) in a 3 M KOH solution, the electrochemical behaviour of the produced nano-crystalline electrode materials (ATO) for electrochemical capacitors was investigated. The CV experiments were carried out at different scan rates (5, 10, 20, 30, 40, 50, and 100 mV s−1), with the findings displayed in Fig. 8. The CV tests were carried out with a potential voltage range of 0.7 to 0.4 V vs. SCE. The cyclic voltammograms of all samples were rectangular and oval in form, indicating that a typical pseudocapacitve response occurs at the graphite electrode/active material (ATO)/electrolyte interface, as stated.30 By resembling a pseudocapacitive nature, these CV curves improve as scan rates increase. Furthermore, as the scan rate is increased, the current increases because the electrolyte ions have more time to penetrate into the pores of the material at lower scan rates, whereas at higher scan rates, they are only collected on the electrode's outermost surface due to current dependence on the scan rate.31 The CV curves varied from one another, which could be owing to the various concentrations of ATO nanoparticles. The specific capacitance values were calculated as per eqn (2): | (1) |
 | (2) |
 is the absolute surface area, ‘S’ is the scan rate, ‘M’ is the mass of active material and ‘ΔV’ is V2 − V1 = potential window. The specific capacitance values calculated for ATO nanoparticle nanostructured materials at different scan rates are shown in Table 1. Among the electrode materials, ATO nanoparticles resulted in a superior specific capacitance (56.49 F g−1) at a scan rate of 10 mV s−1.
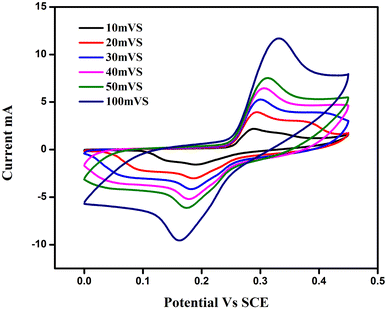 | ||
| Fig. 8 Cyclic voltammogram obtained on ATO nanostructured electrode materials at different scan rates in 3 M KOH electrolyte. | ||
| Specific capacitance values at different scan rates | ||||||
|---|---|---|---|---|---|---|
| Electrode material | 100 mV s−1 | 50 mV s−1 | 40 mV s−1 | 30 mV s−1 | 20 mV s−1 | 10 mV s−1 |
| ATO | 84.53 F g−1 | 66.4 F g−1 | 66.6 F g−1 | 62.33 F g−1 | 55.94 F g−1 | 51.67 F g−1 |
Galvanostatic charge discharge (GCD) tests were carried out in a 3 M KOH solution to better understand the electrochemical characteristics of electrode materials such as ATO nanoparticles. The results are displayed in Fig. 9. The charge–discharge curves of ATO nanoparticle based electrode materials were obtained at current densities ranging from 0.5 to 20 A g−1. All of the GCD curves had a symmetrical triangle, indicating that optimal capacitor behaviour was present in all of the samples.32
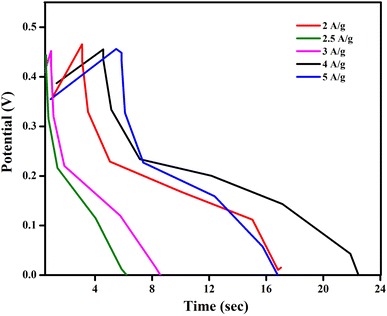 | ||
| Fig. 9 Galvanostatic charge–discharge curves obtained on ATO nanostructured electrode materials at different current densities. | ||
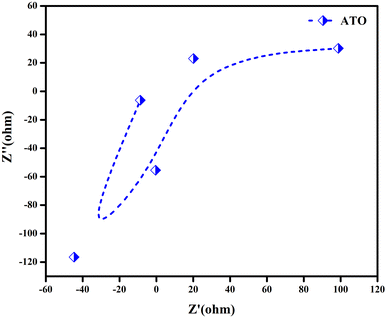
EIS measurements were used to look into the charge transport kinetics of the electrode materials. As reported, the Nyquist plot offers data on equivalent series resistance (ESR), electrode–electrolyte interactions, and interfacial effects. The EIS study of ATO nanoparticle electrode materials was performed with an amplitude of V in the frequency range of 1 Hz to 1 kHz. Fig. 10 show the Nyquist plots produced on ATO bimetallic nanoparticle electrode materials. The Nyquist plot depicted a straight line that was nearly parallel to the imaginary components. The presence of perfect capacitance behaviour in all four samples is revealed by the straight line obtained in the low frequency range, as described.27 Furthermore, the EIS spectrum generated from the intercept at the actual impedance axis is a mixture of electrode/electrolyte resistance, internal resistance of the active material, electrolyte interface resistance, and electrode/current collector contact resistance.33 The Warburg behaviour resulting from rapid ion diffusion across the electrolyte/electrode interface is related to the straight line slope of the low frequency area in the Nyquist plot. As a result, we can conclude that supercapacitors can display optimal capacitive behaviour at low frequencies and blocking behaviour at high frequencies.34 It is possible that this study may reveal a clear method for making ATO nanoparticle-based electrode materials for high-performance supercapacitors.35
3.9 Antibacterial activity
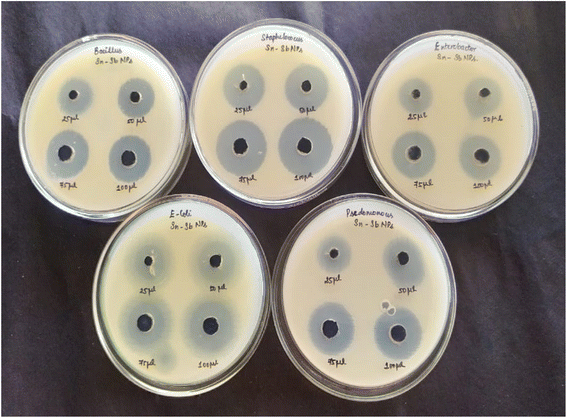
The agar well diffusion method was used to test the antibacterial activity of integrated ATO nanoparticles against Staphylococcus aureus, Bacillus subtilis, Enterobacter sp., Pseudomonas fluorescens, and Escherichia coli (Fig. 11).Pathogenic bacteria (24 hour culture) were cultured in a nutrient broth and swabbed uniformly onto separate plates with Mueller Hinton agar using a sterile L-rod. Purified ATO nanoparticles of various concentrations, such as 25 μL, 50 μL, 75 μL and 100 μL, were added to each well on all plates. The plates were incubated in an incubator, for 24 hours at 37 °C. The varying amounts of zone formation surrounding the well were measured after incubation.36 The results in Table 2 indicate that the nanoparticles are more effective against E. coli than against other bacterial strains. The greater biocidal efficiency of ATO nanoparticles for E. coli is due to the difference in the cell wall structure between Gram negative and Gram positive microorganisms.
| Concentration | Zone of inhibition (cm in diameter) | ||||
|---|---|---|---|---|---|
| Bacillus subtilis | Escherichia coli | Enterobacter sp. | Staphylococcus aureus | Pseudomonas fluorescens | |
| 25 μL | 1.6 | 1.8 | 1.8 | 2.0 | 0.8 |
| 50 μL | 1.8 | 2.2 | 2.1 | 2.1 | 0.9 |
| 75 μL | 2.1 | 2.5 | 2.2 | 2.4 | 1.1 |
| 100 μL | 2.4 | 2.7 | 2.6 | 2.6 | 1.1 |
3.10 Photocatalytic properties of ATO nanoparticles
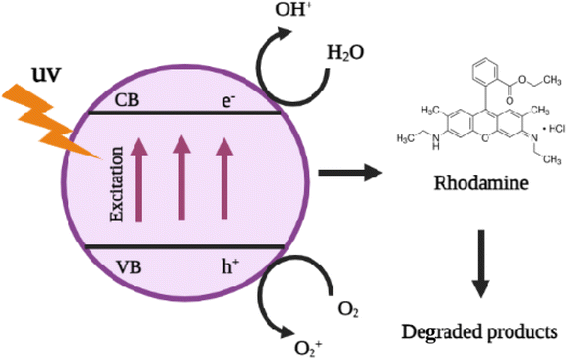
The photocatalytic activity of the ATO nanoparticles was investigated by choosing the photocatalytic degradation of rhodamine dye as a model system. The characteristic absorption peak at 520–540 nm of rhodamine dye was used for monitoring the catalytic degradation process. The absorption spectra of aqueous solution of rhodamine dye tested at different time intervals in the presence of ATO nanoparticles are shown in Fig. 12. The main absorption peak at 520 nm decreased gradually with the extension of the exposure time, indicating the photocatalytic degradation of rhodamine dye. Under UV irradiation, the produced ATO nanoparticles decolorized rhodamine dye by 88 percent in about 240 minutes, implying that ATO nanoparticles are capable of complete dye molecular breakdown. In the absence of nanocatalysts (control) the reaction did not have any progress. Literature in photocatalysis research reveals that photocatalytic activity can be strongly dependent on the crystallographic structure, morphology, and size of the particles.18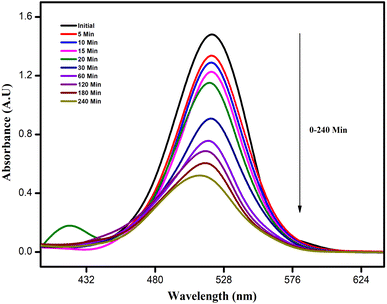 | ||
| Fig. 12 UV-visible spectra of rhodamine dye with ATO nanoparticles. Rhodamine dye degradation using the as-prepared photocatalyst | ||
| ATO + hν → e− + h + | (5) |
| H2O + h+ → OH˙ + H + | (6) |
| O2 + e− → O2˙− | (7) |
| OH + dye → degradable product | (8) |
| O2− + dye → degradable product | (9) |
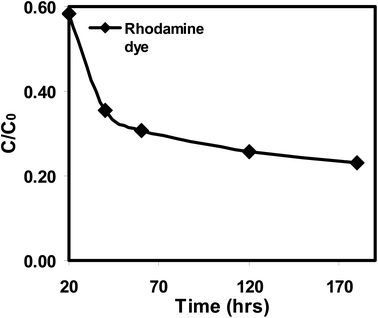
The photocatalytic degradation of rhodamine dye under UV light irradiation was used to assess the photocatalytic activity of the photocatalyst in its as-prepared state. The rhodamine dye solution naturally has a pH of 6.8, a starting rhodamine dye concentration of 0.6 mg L−1, and a photocatalyst dose (ATO nanoparticles) of 0.1 g L−1. The photocatalytic tests were carried out at various times (hours). Fig. 13 shows the charts of C/C0versus time. Rhodamine dye's concentration is seen to marginally drop in the dye solution with the photocatalyst, demonstrating its photostability when exposed to UV light. The photocatalyst exhibits rhodamine dye absorption upon UV light exposure. Rhodamine dye ATO nanoparticles had an adsorptive removal efficacy of 88%, correspondingly. The greater adsorption capacity of the ATO nanoparticles favours photocatalytic degradation as a result. Rhodamine dye concentration reduced as a result of light irradiation, and after 70–170 minutes of exposure, rhodamine dye removal efficiency increased. More active sites are made available to the dye species and the breakdown rate of rhodamine dye is accelerated by higher adsorption capacity. This boosts the quantity of photogenerated electrons and holes and speeds up rhodamine dye's decomposition.37
Adsorption and photodegradation are both effective ways to remove rhodamine dye, however at lower concentrations; adsorption predominates while photodegradation contributes less (Table 3). The ideal circumstances were attained with a catalyst dosage of 0.1 g L−1, an initial rhodamine dye concentration of 0.6 mg L−1, and an inherent pH of 6.8 for the rhodamine dye solution. A final removal efficiency of 88% was achieved under these circumstances (Fig. 16).
| Nanomaterial | Organism | Zone of inhibition | Reference |
|---|---|---|---|
| Zn/FeO | Staphylococcus aureus | No significant activity | 40 |
| Escherichia coli | |||
| Polyaniline/Ag–Pt | Staphylococcus aureus | 30 ± 1.25 mm | 41 |
| AgAu | Acinetobacter baumannii | 16 mm | 42 |
| Staphylococcus aureus | 8 mm | ||
| Escherichia coli | 4 mm | ||
| Ag–Cu | Listeria monocytogenes | No significant activity | 43 |
| Salmonella enterica sv typhimurium | |||
| Co@AgNP | Escherichia coli | 8.51 mm | 44 |
| Bacillus subtilis | 4.41 mm | ||
| AgPdNPs | Staphylococcus aureus | 14 mm | 45 |
| Pseudomonas aeruginosa | 16 mm | ||
| ATO | Staphylococcus aureus | 26 mm | Our result |
| Bacillus subtilis | 24 mm | ||
| Enterobacter sp. | 26 mm | ||
| Pseudomonas fluorescens | 11 mm | ||
| Escherichia coli | 27 mm |
| Type of catalyst | Light source | Type of pollutant | Concentration of pollutant | % of degradation | Reference |
|---|---|---|---|---|---|
| ZnS NPs | UV | RB5 | 20 ppm | 100 | 46 |
| CdS/Ni | UV | MO | 15 ppm | 98 | 47 |
| Bi2S3/Fe3O4 | Xe-lamp | CR | 30 mg L−1 | 91.60 | 48 |
| Ag2S/TiO2 | Visible | MO | 20 mg L−1 | 69 | 49 |
| CdS NPs | Visible | MB | 10 mg L−1 | 83.8 | 50 |
| ATO | UV | Rhodamine | 86 | Our result |
4. Conclusion
In this research study, a simple and direct hydrothermal method to prepare ATO nanoparticles was studied. X-Ray diffraction (XRD), scanning electron microscopy (SEM), Fourier transform infrared (FT-IR) spectroscopy, fluorescence spectroscopy (FL), a particle size analyser (PSA), and thermogravimetric analysis were used to evaluate the characteristics of ATO nanoparticles (TGA). The structural, optical, and thermal properties of ATO nanoparticles were confirmed based on the characterized results. A scanning electron microscopy study of the as-synthesized powders revealed spherical, cube, and rod shapes with agglomerated particles with diameters in the range of lower than 100 nm, according to XRD analyses. DLS is a method for determining the average particle size of bimetallic nanoparticles made of ATO. As a result, preparing ATO nanoparticles could be a useful tool in antibacterial research, allowing researchers to develop new antibodies for difficult-to-treat pathogens. At 240 minutes, the produced ATO nanoparticles were also effective in degrading rhodamine dye. The toxicity study of the photocatalyst was studied and the results showed that the photocatalyst has a negligible effect on zebra fish growth.Conflicts of interest
The authors did not declare any conflict of interest.Acknowledgements
E. Amutha (Register No: 19214542052003) acknowledges the Research centre, Sri Paramakalyani Centre of Excellence in Environmental Sciences, Manonmaniam Sundaranar University, Alwarkurichi, for providing the support for this research work.References
- M. Dashti Najafi, S. Kholghi Eshkalak, B. Amiri, H. R. Naderi, E. Kowsari, A. Chinnappan and S. Ramakrishna, Mater. Today Chem., 2022, 23, 100633 CrossRef CAS.
- Z. H. Mahmoud, R. A. AL-Bayati and A. A. Khadom, J. Oleo Sci., 2022, ess21283 Search PubMed.
- Q. Xiong, B. Liu, Y. Liu, P. Wang, H. Cheng, H. Li, Z. Lu and M. Yang, Nano Res., 2022, 15, 7759–7768 CrossRef CAS.
- A. Subramanian, D. Karuppiah and B. Baskaran, J. Electron. Mater., 2022, 51, 3958–3969 CrossRef CAS.
- P. I. Ekwere, Microwave synthesized ruthenium antimony oxide-graphene nanocomposite materials for asymmetric supercapacitors, PhD thesis, 2022, http://etd.uwc.ac.za/xmlui/handle/11394/9097.
- C. Mevada, P. S. Chandran and M. Mukhopadhyay, J. Energy Storage, 2020, 28, 101197 CrossRef.
- M. R. Zakaria, M. F. Omar, M. S. Zainol Abidin, H. Md Akil and M. M. A. B. Abdullah, Composites, Part A, 2022, 154, 106756 CrossRef CAS.
- B. Saravanakumar, G. Ravi, V. Ganesh, F. Ameen, A. Al-Sabri and R. Yuvakkumar, J. Sol-Gel Sci. Technol., 2018, 86, 521–535 CrossRef CAS.
- S. Sivakumar, E. Manikandan, B. Mahalakshmi, N. Ahmad mala and L. Nelson prabu, Vacuum, 2020, 173, 109116 CrossRef CAS.
- J. Zhang and L. Gao, Mater. Res. Bull., 2004, 39, 2249–2255 CrossRef CAS.
- H. Lee, S. Jin and S. Yim, J. Phys. Chem. Solids, 2020, 138, 109264 CrossRef CAS.
- V. Velmurugan, U. Srinivasarao, R. Ramachandran, M. Saranya and A. N. Grace, Mater. Res. Bull., 2016, 84, 145–151 CrossRef CAS.
- M. M. Rahman, J. Ahmed and A. M. Asiri, Sens. Actuators, B, 2017, 242, 167–175 CrossRef CAS.
- K. Chand, D. Cao, D. E. Fouad, A. H. Shah, M. N. Lakhan, A. Q. Dayo, H. J. Sagar, K. Zhu and A. M. A. Mohamed, J. Mol. Liq., 2020, 316, 113821 CrossRef CAS.
- D. Chandran, L. S. Nair, S. Balachandran, K. Rajendra Babu and M. Deepa, J. Sol-Gel Sci. Technol., 2015, 76, 582–591 CrossRef CAS.
- E. Ferdosi, H. Bahiraei and D. Ghanbari, Sep. Purif. Technol., 2019, 211, 35–39 CrossRef CAS.
- A. El Mragui, O. Zegaoui and J. C. G. Esteves da Silva, Chemosphere, 2021, 266, 128931 CrossRef CAS.
- S. Sharma, M. Vats, J. Sharma, A. Chhabra, R. K. R. Kumar and C.-H. Chuang, Curr. Nanosci., 2021, 17, 612–619 CrossRef CAS.
- L. Yu, Q. Wang, Z. Zhang, J. He, L. Guo, K. Dong and Y. Zhang, J. Nanosci. Nanotechnol., 2017, 17, 1350–1355 CrossRef CAS PubMed.
- V. Velmurugan, U. Srinivasarao, R. Ramachandran, M. Saranya and A. N. Grace, Mater. Res. Bull., 2016, 84, 145–151 CrossRef CAS.
- Y. Zhang, Q. Shao, B. Zhao, B. Zhang, V. Murugadoss, S. Wu, T. Ding and Z. Guo, Colloids Surf., A, 2019, 583, 123965 CrossRef CAS.
- M. Sharma, R. Adalati, A. Kumar, M. Mehta and R. Chandra, ACS Appl. Mater. Interfaces, 2022, 14(23), 26791–26802 CrossRef CAS PubMed.
- L. Ren, B. Xu, G. Wang, X. Yin, Y. Liu, W. Yang and Y. Chen, RSC Adv., 2020, 10, 39130–39136 RSC.
- Y. Watanabe, K. Kanazawa, Y. Komazaki, T. Nobeshima and S. Uemura, AIP Adv., 2020, 10, 035226 CrossRef CAS.
- T.-W. Kim and S.-J. Park, J. Colloid Interface Sci., 2017, 486, 287–295 CrossRef CAS.
- Y.-H. Chan, C.-Y. Tsai, Y.-J. Shih and M.-S. Wu, Electrochim. Acta, 2020, 364, 137329 CrossRef CAS.
- Y. Zhang and Y. Mo, Electrochim. Acta, 2014, 142, 76–83 CrossRef CAS.
- N. Parveen, M. O. Ansari, T. H. Han and M. H. Cho, J. Solid State Electrochem., 2017, 21, 57–68 CrossRef CAS.
- M. Asadzadeh, F. Tajabadi, D. Dastan, P. Sangpour, Z. Shi and N. Taghavinia, Ceram. Int., 2021, 47, 5487–5494 CrossRef CAS.
- G.-H. An, D.-Y. Lee, Y.-J. Lee and H.-J. Ahn, ACS Appl. Mater. Interfaces, 2016, 8, 30264–30270 CrossRef CAS PubMed.
- M. A. Dheyab, A. A. Aziz, M. S. Jameel and N. Oladzadabbasabadi, Surf. Interfaces, 2022, 28, 101677 CrossRef CAS.
- K. Selvam, C. Sudhakar, T. Selvankumar, B. Senthilkumar, W. Kim, M. M. Al-Ansari and L. Al-Humaid, Appl. Nanosci., 2022 DOI:10.1007/s13204-021-02148-0.
- G. K. Dalapati, H. Sharma, A. Guchhait, N. Chakrabarty, P. Bamola, Q. Liu, G. Saianand, A. M. Sai Krishna, S. Mukhopadhyay, A. Dey, T. K. S. Wong, S. Zhuk, S. Ghosh, S. Chakrabortty, C. Mahata, S. Biring, A. Kumar, C. S. Ribeiro, S. Ramakrishna, A. K. Chakraborty, S. Krishnamurthy, P. Sonar and M. Sharma, J. Mater. Chem. A, 2021, 9, 16621–16684 RSC.
- K.-K. Liu, Q. Jiang, C. Kacica, H. Gholami Derami, P. Biswas and S. Singamaneni, RSC Adv., 2018, 8, 31296–31302 RSC.
- C. Xiang, M. Li, M. Zhi, A. Manivannan and N. Wu, J. Mater. Chem., 2012, 22, 19161–19167 RSC.
- M. Lava, U. Muddapur, N. Basavegowda, S. More and V. More, Characterization, anticancer, antibacterial, anti-diabetic and anti-inflammatory activities of green synthesized silver nanoparticles using Justica wynaadensis leaves extract, 2020, vol. 46 Search PubMed.
- H. Wang, L. Zhang, Z. Chen, J. Hu, S. Li, Z. Wang, J. Liu and X. Wang, Chem. Soc. Rev., 2014, 43, 5234–5244 RSC.
- R. Sivaranjani, A. Thayumanavan and S. Sriram, Bull. Mater. Sci., 2019, 42, 185 CrossRef.
- X. H. Vu, L. H. Phuoc, N. D. Dien, T. T. H. Pham and L. D. Thanh, J. Electron. Mater., 2019, 48, 2978–2985 CrossRef CAS.
- T. Gordon, B. Perlstein, O. Houbara, I. Felner, E. Banin and S. Margel, Colloids Surf., A, 2011, 374, 1–8 CrossRef CAS.
- P. Boomi, H. G. Prabu and J. Mathiyarasu, Colloids Surf., B, 2013, 103, 9–14 CrossRef CAS PubMed.
- G. R. Salunke, S. Ghosh, R. Santosh Kumar, S. Khade, P. Vashisth, T. Kale, S. Chopade, V. Pruthi, G. Kundu, J. R. Bellare and B. A. Chopade, Int. J. Nanomed., 2014, 9, 2635–2653 Search PubMed.
- Y. A. Arfat, J. Ahmed and H. Jacob, Carbohydr. Polym., 2017, 155, 382–390 CrossRef CAS PubMed.
- Z. Kanwal, M. A. Raza, S. Riaz, S. Manzoor, A. Tayyeb, I. Sajid and S. Naseem, R. Soc. Open Sci., 2019, 6, 182135 CrossRef CAS PubMed.
- B. S. Sivamaruthi, V. S. Ramkumar, G. Archunan, C. Chaiyasut and N. Suganthy, J. Drug Delivery Sci. Technol., 2019, 51, 139–151 CrossRef CAS.
- T. Mahvelati-Shamsabadi and E. K. Goharshadi, Ultrason. Sonochem., 2017, 34, 78–89 CrossRef CAS PubMed.
- A. Sridevi, S. Krishnamohan, M. Thairiyaraja, B. Prakash and R. Yokeshwaran, Inorg. Chem. Commun., 2022, 138, 109311 CrossRef CAS.
- N. Chandel, K. Sharma, A. Sudhaik, P. Raizada, A. Hosseini-Bandegharaei, V. K. Thakur and P. Singh, Arabian J. Chem., 2020, 13, 4324–4340 CrossRef CAS.
- X. Liu, L. Zhu, X. Wang and X. Meng, Environ. Sci. Pollut. Res. Int., 2020, 27, 13590–13598 CrossRef CAS PubMed.
- A. Bhadwal, R. Tripathi, R. Gupta, N. Kumar, R. Singh and A. Shrivastav, RSC Adv., 2014, 4, 9484–9490 RSC.
- S. Malar, M. Venkatesan, V. Arumugam, N. Geetha, N. Saravanan, S. Murugesan, S. Ramachandran, R. Ayyasamy and A. Pugazhendhi, Process Biochem., 2019, 80, 197–202 CrossRef.
| This journal is © The Royal Society of Chemistry 2023 |

