 Open Access Article
Ultrasmall porphyrin-silica core–shell dots for enhanced fluorescence imaging-guided cancer photodynamic therapy†
Sadaf
Hameed
 d,
Pravin
Bhattarai
e,
Zhuoran
Gong
a,
Xiaolong
Liang
 b,
Xiuli
Yue
*c and
Zhifei
Dai
 *a
*a
aDepartment of Biomedical Engineering, College of Future Technology, Peking University, Beijing, 100871, China. E-mail: zhifei.dai@pku.edu.cn
bDepartment of Ultrasonography, Peking University Third Hospital, Beijing, 100191, China
cSchool of Environment, Harbin Institute of Technology, Harbin, 150001, China. E-mail: xiulidx@163.com
dFaculty of Science and Technology, University of Central Punjab, Lahore, 54000, Pakistan
eCÚRAM-SFI Research Centre for Medical Devices, Biomedical Sciences, University of Galway, Ireland
First published on 29th November 2022
Abstract
Clinically used small-molecular photosensitizers (PSs) for photodynamic therapy (PDT) share similar disadvantages, such as the lack of selectivity towards cancer cells, short blood circulation time, life-threatening phototoxicity, and low physiological solubility. To overcome such limitations, the present study capitalizes on the synthesis of ultra-small hydrophilic porphyrin-based silica nanoparticles (core–shell porphyrin-silica dots; PSDs) to enhance the treatment outcomes of cancer via PDT. These ultra-small PSDs, with a hydrodynamic diameter less than 7 nm, have an excellent aqueous solubility in water (porphyrin; TPPS3-NH2) and enhanced tumor accumulation therefore exhibiting enhanced fluorescence imaging-guided PDT in breast cancer cells. Besides ultra-small size, such PSDs also displayed an excellent biocompatibility and negligible dark cytotoxicity in vitro. Moreover, PSDs were also found to be stable in other physiological solutions as a function of time. The fluorescence imaging of porphyrin revealed a prolonged residence time of PSDs in tumor regions, reduced accumulation in vital organs, and rapid renal clearance upon intravenous injection. The in vivo study further revealed reduced tumor growth in 4T1 tumor-bearing bulb mice after laser irradiation explaining the excellent photodynamic therapeutic efficacy of ultra-small PSDs. Thus, ultrasmall hydrophilic PSDs combined with excellent imaging-guided therapeutic abilities and renal clearance behavior represent a promising platform for cancer imaging and therapy.
1. Introduction
Despite the tremendous achievement made in treating cancer during the past few decades, the key challenge is to attain the adequate concentration of therapeutic agents at the desired tumor site, thereby destroying cancerous cells more efficiently while minimizing potential damage to healthy tissues.1–3 In this regard, it is highly imperative to design a single therapeutic agent with enormous potential to make significant contributions in preventing cancer proliferation. Nanotechnology has significantly contributed to the advances in medicine as nanoscale assemblies pledge to improve on earlier established diagnostic and therapeutic strategies as a consequence of enhanced delivery.4,5 Over the past decades, numerous efforts have been made for the investigation of smart drug delivery systems as innovative medicines by taking advantage of newly developed multifunctional nano-agents.6,7 Among the various types of multifunctional nanomaterials, silica-based nanomaterials have been highlighted as promising candidates due to their unique structural and functional properties. Recently, tremendous efforts have been made for the development of nanoscale siliceous materials for biomedical applications.8–10 In particular, by incorporating photosensitizers (PSs), siliceous nanoparticles (NPs) have been well designed and employed as promising therapeutic agents for photodynamic therapy (PDT) of cancer cells.11–13 These siliceous NPs can effectively integrate PSs as building units, offering a high loading capacity of PSs to generate reactive oxygen species (ROS), under light irradiation, for efficient destruction of cancer cells.14,15Despite the promising results acquired from the preclinical investigation, several drawbacks of the current siliceous NP based PDT system still remain, which hinder their clinical translations and further medical usage.16–18 Nevertheless, surface-functionalized mesoporous silica NPs (MSNs) have gained tremendous attention from researchers, but their clinical applications confronted great difficulty mainly due to the fact that the silica often required a pretty long time to be dissolved under normal physiological conditions, causing particle accumulation and long-term toxicity.19,20
To overcome these challenges, Wiesner et al. synthesized water-based ultra-small fluorescent silica NPs (size <10 nm) by co-condensing silane-conjugated dye molecules/fluorophores into the matrix of silica.21 The incorporation of fluorescent dyes into the silica matrix can tune the optical properties of silica NPs from visible to NIR part of the spectrum. They also revealed that additional shells of silica can be easily added during the synthesis process while keeping the overall diameter of the particles below 10 nm.21,22 The core–shell architecture of silica NPs can improve the fluorescence brightness of dyes compared to the parent core and dye molecules alone.23 The newer generation of silica dots prepared in water is referred to as Cornell prime dots (C′ dots).21
It is well known that the size of NPs can influence their accumulation level in tumors, circulation half-lives, and biodistribution in different organs, since they can control various biological processes, including cellular uptake, diffusion in tumor tissues, crossing blood vessels, and so on.24,25 Through analysis of previously reported results, NPs with a hydrodynamic diameter ranging from 10 to 200 nm are eventually accumulated in reticuloendothelial system (RES) organs like livers or spleens and can be retained by the body for a prolonged period, which causes potential toxicity and compromises their uptake by cancer. However, NPs with a hydrodynamic diameter between 5 and 10 nm usually showed better diffusion and fast accumulation in the tumor. Besides, these ultra-small NPs can easily pass through the kidney filtration and have renal clearance properties in their intact form. Thus, ultrasmall NPs can exquisitely balance the requirement between high tumor specificity and clearance efficacy.
Moreover, most of the PSs used for PDT, including those approved for human use, tend to form face-to-face aggregates, causing extremely low solubility in aqueous media,26 which renders the PSs photodynamically inactive in water and considerably restricts their in vivo therapeutically and medical applications.27 Thereby, water-soluble and NIR-absorbing PSs are urgently required for efficient PDT.
Inspired by the aforementioned features and taking advantage of the excellent theranostic properties of porphyrin, herein we report the facile synthesis of water-soluble porphyrin (TPPS3-NH2) and its conjugation with ultra-small silica NPs for imaging-guided enhanced PDT of cancer. Due to their ultrasmall size and surface modification (PEGylation), these well-defined water-soluble porphyrin-loaded silica NPs (porphyrin-silica dots: PSDs) exhibit higher tumor accumulation and renal clearance properties compared to the free porphyrin (TPPS3-NH2) molecules. Besides, by taking advantage of the imaging system, PSDs were easily tracked in vivo providing information regarding the tumor size, location, and biodistribution of NPs in healthy organs and importantly the therapeutic efficacy can be monitored before and after PDT. All these collective properties of PSDs not only highlight their candidacy for imaging-guided enhanced PDT of cancer but also promote further development of ultrasmall silica-based nano-theranostic agents for clinical translation.
2. Results and discussion
2.1. Synthesis of hydrophilic porphyrin (TPPS3-NH2)
Porphyrins and their derivatives are usually insoluble in water mainly due to their hydrophobic planar structure and their consequent capability to aggregate easily through π–π stacking. Therefore, in order to solubilize porphyrins in water, a formal charge is usually positioned on the structure to enable porphyrins to interact with water molecules. To this end, we have synthesized 4,4′,4′′-(20-(4-aminophenyl)porphyrin-5,10,15-triyl)tri-benzenesulfonate (TPPS3-NH2) according to a previously reported protocol with slight modifications28 and the synthetic route is shown in Fig. S1.† Briefly, TPP was first prepared from benzaldehyde and pyrrole in the presence of AlCl3 as a catalyst, accompanied by nitration with fuming HNO3, followed by reduction and reaction with concentrated H2SO4 to get TPPS3-NH2. The prepared TPPS3-NH2 was well dissolved in water. Furthermore, the structure of the compound was further confirmed by high-resolution mass spectroscopy (HRMS) (Fig. S2†). Then the obtained TPPS3-NH2 was used to assemble into nanoparticles.2.2. Synthesis of sub-10 nm porphyrin-silica dots
It was observed that the meso-substituted charged aromatic rings located outside the porphyrin planar structure can block face-to-face (H-type) aggregation, however, some aggregation is still possible, resulting in aggregation-caused fluorescence quenching and low 1O2 production. To address this issue, TPPS3-NH2 was covalently encapsulated within silica nanoparticles through a modified Ströber sol–gel method of Cornell prime dots (C′ dots). Briefly, TMOS and the TPPS3-NH2-silane conjugate was added in an aqueous solution of ammonium hydroxide (pH ∼ 8). The growth of homogeneous sub-10 nm silica nanoparticles was triggered by fast hydrolysis and condensation of silane molecules in water. The particle growth was then terminated through the addition of silane-functionalized polyethylene glycol (PEG-silane). A subsequent overnight heat treatment (80 °C) was applied to enhance the covalent attachment of PEG-silane on the surface of particles. In order to remove the reaction reagents, the synthesized nanoparticles were cleaned by dialysis for 6 days. The nanoparticles were filtered through a syringe filter (200 nm) to eliminate any possible dust or aggregated particles. As-synthesized porphyrin-silica dots (referred to as PSDs) were then purified through gel permeation chromatography (GPC) and characterized through a DSL, TEM, and UV and fluorescence spectrophotometer.2.3. Characterization of porphyrin-silica dots
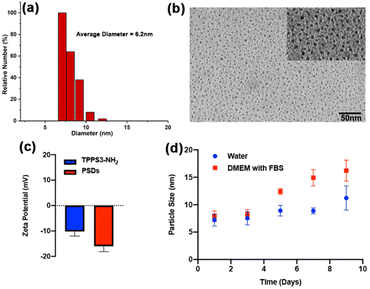
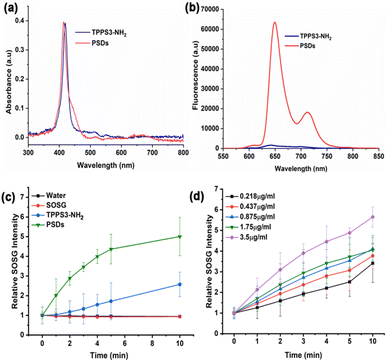
The morphological dimensions and optical properties of PSDs were carefully investigated. The TEM images disclosed that designed PSDs exhibited uniform spherical morphology with a size distribution of 6.2 ± 2.3 nm (Fig. 1b), ensuring their preferential accumulation in tissues via the EPR effect. DSL measurements further revealed that PSDs showed a relatively uniform size dispersion in DI water, with an average diameter of 7 nm (Fig. 1a). Besides, zeta potential measurements revealed a negative surface charge of −16 mV on PSDs (Fig. 1c). Furthermore, negligible variation in the size of PSDs was observed over a span of one week in aqueous solution and DMEM, suggesting their good stability without any aggregation (Fig. 1d), besides, the hydrodynamic diameter of PSDs was also observed when incubated with water and fetal bovine serum (FBS) containing Dulbecco's modified eagle medium (DMEM) at 4 °C, indicating minimal chances of aggregation of this nanoformulation in the presence of serum proteins (Fig. 1d).The UV-vis spectrum of PSDs in water exhibited the characteristic peak of the typical porphyrin ring, with an intense Soret band (400–500 nm) and less intense Q bands (500–700 nm), which is consistent with the absorbance peak of TPPS3-NH2 (Fig. 2a). In addition, this UV-vis peak at 420 nm was further used to determine the concentration of TPPS3-NH2 in PSD samples. Therefore, we investigated the link between the feeding concentration of TPPS3-NH2 and the amount of TPPS3-NH2 finally loaded on PSDs from UV-vis spectra. It was found that the loading content of TPPS3-NH2 at PSDs is ∼28.9% (W TPPS3-NH2 in PSDs/W TPPS3-NH2 initially added × 100 = 1.15752 mg/4 mg × 100 = 28.9%).
The fluorescence spectra of PSDs and TPPS3-NH2 at the same concentration of porphyrin were also recorded at an excitation wavelength of 420 nm. The fluorescence intensity of TPPS3-NH2 in water was significantly lower, which might be due to the self-aggregation of porphyrin molecules themselves.29 On the other hand, PSDs were remarkably fluorescent in an aqueous solution. This enhancement in the fluorescence intensity is mainly attributed to the silica matrix of PSDs, which might prevent the porphyrin molecules from aggregation and thus avoids fluorescence self-quenching (Fig. 2b).19
2.4. Generation of singlet oxygen (1O2) in solution
To explore the role of water-soluble porphyrin in PSDs for successful photodynamic therapy (PDT), we first detected the generation of singlet oxygen (1O2) in solution. 1O2, the first excited electronic state of molecular oxygen, is usually produced when a photosensitizer (PS) is irradiated with laser light of a suitable wavelength. It is highly reactive and can trigger cellular damage and apoptosis.30 Moreover, a handful of literature has been reported demonstrating that the silica matrix is permeable to oxygen and the entrapped photosensitizers (e.g. Hp IX),31 upon irradiation, generate 1O2 which diffuses very efficiently to the solution. Therefore, we assumed that the silica matrix is porous enough to allow the interaction of porphyrin molecules with molecular oxygen, which must diffuse through the pores to reach the entrapped porphyrin molecules. In the presence of light, this process leads to the generation of singlet oxygen (1O2), which needs to diffuse out of the matrix to produce the cytotoxic effect on diseased cells. Therefore, we investigated the light-triggered 1O2 generation ability of TPPS3-NH2 and PSDs indirectly using a fluorescence probe, singlet oxygen sensor green (SOSG). In the presence of 1O2, SOSG transformed into SOSG endoperoxides (SOSG-EP) resulting in an increase in its fluorescence intensity (Ex = 504 nm and Em = 525 nm), and thus, offering a straight forward approach of monitoring 1O2 generation ability.32 As shown in Fig. 2c, minimal 1O2 was generated with TPPS3-NH2 under 650 nm irradiation (0.2 W cm−2) because of the presence of high aggregation in porphyrin molecules. With PSDs, the relative fluorescence intensity of SOSG increased (∼4 fold compared to TPPS3-NH2) as a function of irradiation time, indicating efficient 1O2 generation ability. In addition, the 1O2 generation ability of PSDs was also examined against a series of concentrations of PSDs. An obvious increase in the relative fluorescence intensity of SOSG was observed for increasing the concentration of porphyrin in PSDs from 0.218 μg mL−1 to 3.5 μg mL−1, indicating that the PSDs can induce sufficient 1O2 for PDT (Fig. 2d).2.5. Detection of singlet oxygen (1O2) in cancer cells
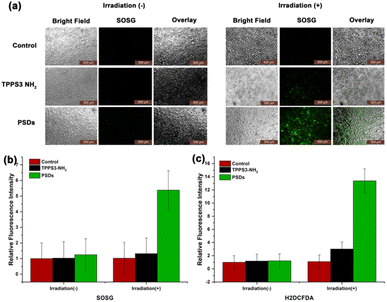
After successful monitoring of 1O2 generation in solution, we next established the fact that the mechanism of cell death in cancer cells is also initiated by the generation of 1O2. Therefore, the 1O2 level was observed in 4T1 cells treated with TPPS3-NH2 and PSDs in the dark as well as under irradiation with 650 nm (0.2 W cm−2). To access this, 4T1 cells were incubated with TPPS3-NH2 and PSDs for 4 h, followed by 5 min of laser treatment (650 nm; 0.2 W cm−2). An increased level of 1O2 was observed in the case of irradiated samples of TPPS3-NH2 and PSDs as compared to control and samples in the dark (Fig. 3a). Moreover, the higher green fluorescence of SOSG was observed in cells treated with PSDs than TPPS3-NH2. The fluorescence intensity of SOSG was also quantified with a microplate reader at Ex/Em: 490/530 nm, indicating a 4.5-fold increase in the relative fluorescence intensity of SOSG in cells treated with PSDs in comparison to the cells treated with TPPS3-NH2 (Fig. 3b).To further estimate the intracellular production of 1O2 from TPPS3-NH2 and PSDs in 4T1 cells, H2DCFDA as a fluorescent probe was used. H2DCFDA is a nonfluorescent cell-permeable indicator for 1O2 in the cells, however, after the cleavage of its protective acetate group by intracellular esterases, it becomes fluorescent.33 Under excitation, H2DCFDA exhibited bright green fluorescence, which can be easily detected under a fluorescence microscope. To access this, 4T1 cells were treated with PBS, TPPS3-NH2, and PSDs, with or without laser irradiation.
As anticipated, 4T1 cells treated with TPPS3-NH2 and PSDs without laser irradiation showed negligible fluorescence signals of H2DCFDA, indicating low or no 1O2 generation. However, as shown in Fig. S3,† the stronger green fluorescence of H2DCFDA has emerged in 4T1 cells incubated with PSDs than those incubated with TPPS3-NH2 under irradiation, which is mainly due to the increase in total 1O2 and in good agreement with previous results. Moreover, the higher 1O2 generation ability of PSDs was also quantitatively detected by measuring the fluorescence intensity of H2DCFDA (Ex = 485 nm, Em = 535 nm) with a fluorescence microplate reader. As confirmed by the quantitative experiment, the relative fluorescence intensity of H2DCFDA increased almost 10-fold in the PSDs group as compared to the other groups (Fig. 3c). These results further confirmed that PSDs can greatly kill cancer cells by generating a large amount of 1O2.
2.6. Cellular uptake of porphyrin-silica dots
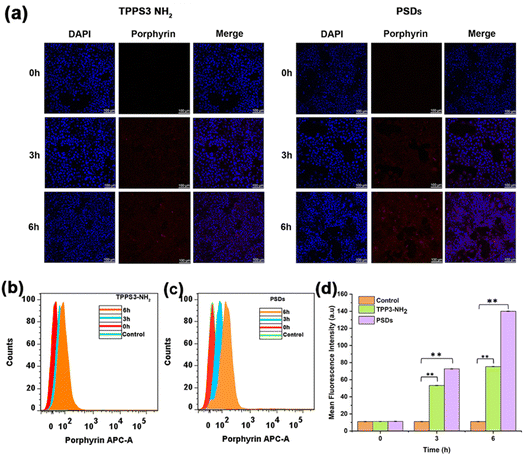
To explore the cellular internalization behavior of TPPS3-NH2 and PSDs, we used confocal laser scanning microscopy (CLSM) and flow cytometry. Briefly, TPPS3-NH2 and PSDs (10 μM equivalent porphyrin concentration) were incubated with 4T1 cells for pre-determined time intervals of 0, 3, 6 h, and examined by CLSM to investigate the cellular uptake.As depicted in Fig. 4a, the cytoplasm of 4T1 cells was lit up by the red fluorescence of porphyrin, suggesting that both TPPS3-NH2 and PSDs were efficiently taken up into the cytoplasm by an endocytosis mechanism even after 3 h of incubation. When the incubation time was further prolonged to 6 h, remarkably enhanced red fluorescence signals of porphyrin were found in the cytoplasm of the 4T1 tumor cells treated with PSDs as compared to those treated with TPPS3-NH2, indicating that sub-10 nm PSDs can readily be internalized into the tumor cells.
Cellular internalization of TPPS3-NH2 and PSDs was further quantified by flow cytometry analysis. As compared to TPPS3-NH2, an obvious enhancement in the fluorescence intensity of PSDs was observed with a prolonged incubation time (Fig. 4b and c). After 6 h of incubation, the average fluorescence intensity of PSDs taken up by the 4T1 cells was 13.3 folder than the control and 1.8-fold higher than TPPS3-NH2 (Fig. 4d). Both CSLM and flow cytometry analysis revealed remarkably enhanced intracellular delivery of the photosensitizer by using PSDs as the nanocarrier.
2.7. Evaluation of in vitro photodynamic therapy
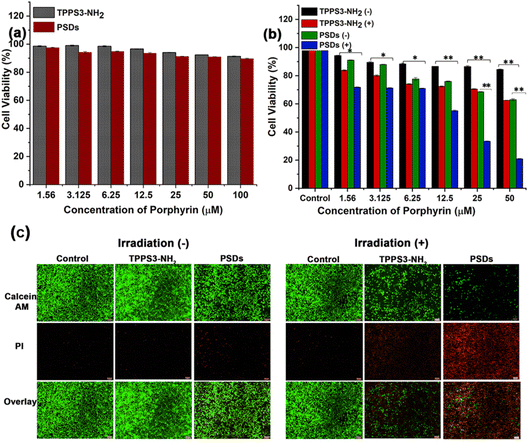
Subsequently, in order to assay the biocompatibility of TPPS3-NH2 and PSDs, HUVEC cells were incubated with different concentrations of TPPS3-NH2 and PSDs for the specified time duration. In vitro cytotoxicity was determined without light exposure by the MTT assay. As shown in Fig. 5a, both TPPS3-NH2 and PSDs showed minimal cytotoxicity towards HUVEC cells without light exposure. The cell viability of HUVEC can be maintained at about 91.28% and 89.72% with a concentration of the TPPS3-NH2 and PSDs as high as 100 μM. These results validated the biocompatible nature of both TPPS3-NH2 and PSDs towards HUVEC cells. Furthermore, to establish the potential of TPPS3-NH2 and PSDs in anti-tumor photodynamic therapy, the 4T1 tumor cells were treated with different concentrations of TPPS3-NH2 and PSDs. After 4 h of incubation, the cells were washed (as mentioned in the Materials and methods) and further incubated for 12 h. As expected, no significant differences in the cytotoxicity were found in the 4T1 tumor cells treated with TPPS3-NH2 and PSDs without laser irradiation, suggesting that the material itself couldn't cause distinct damage to living cells (Fig. 5b).For the TPPS3-NH2 group, laser irradiation (650 nm, 0.2 W cm−2) could lead to a decrease in the viability of 4T1 cells to around 62%. On the other hand, PSDs with laser irradiation can significantly decrease the viability of cells to ∼18%. Such dramatically enhanced photodynamic therapeutic efficacy offered by PSDs, as compared to the TPPS3-NH2, is greatly attributed to the enhanced cellular uptake of ultra-small PSD nanocarriers by tumor cells which eventually generates 1O2 inside the cells under 650 nm laser irradiation for effective cancer cell killing. Hence, in vitro cytotoxicity studies consistently suggest that ultra-small nanocarriers (PSDs) as a photosensitizer delivery system are more effective for photodynamic therapy of cancer cells.
To visually observe the photodynamic therapeutic efficacy of PSDs, a live/dead assay was used to distinguish the cell viability, in which dead cells were stained with propidium iodide (PI, red) and the live cells were stained with Calcein AM (green). A previously reported protocol was adopted to conduct this assay.34 As expected, widespread green fluorescence signals were observed in the group treated with control, TPPS3-NH2, and PSDs without laser exposure (Fig. 5c), suggesting negligible cytotoxicity of both TPPS3-NH2 and PSDs without irradiation. In addition, a control group treated with 650 nm (0.2 W cm−2) for 10 min was unable to induce cell death as no obvious red signal was monitored, indicating that the laser itself can't inhibit the tumor growth. However, widespread green signals and little red signals were monitored in the group treated with TPPS3-NH2 followed by laser irradiation, which indicates a slightly higher viability of 4T1 tumor cells under this condition. In stark contrast, 4T1 cells treated with PSDs and laser irradiation exhibited much stronger cytotoxicity as very clear red fluorescence signals along with fewer green signals (Fig. 5c). This enhanced phototherapeutic effect is primarily due to the stronger 1O2 generation by PSDs. These results also suggest that the inhibition of cell proliferation by PSDs was partially attributed to its apoptotic effect.
To further confirm the photodynamic efficiency of PSDs, the apoptotic and necrosis cell distribution was observed using an annexin V-FITC/PI apoptosis detection kit using flow cytometry. In this assay, annexin V+/PI+ are usually necrotic/late apoptotic cells, while annexin V+/PI− cells are considered as early apoptotic cells. As shown in Fig. 6, compared with the apoptosis ratio of the TPPS3-NH2 group without laser irradiation (4.34% and 4.40% for early and late apoptosis), the PSDs group without laser irradiation showed a slightly enhanced apoptosis ratio with 7.27% for early apoptosis and 13.7% for late apoptosis. However, upon 650 nm laser irradiation, the TPPS3-NH2 group showed obvious apoptosis with 38.9% for early and 34.3% for late apoptosis respectively, which was largely due to the NIR laser-induced phototoxicity of the photosensitizer. Meanwhile, the 4T1 cells when exposed to PSDs followed by laser treatment (650 nm; 0.2 W cm−2) showed a maximum apoptotic ratio (45.5% for early apoptosis and 33.9% for late apoptosis) (Fig. 6). Under light exposure, the total apoptotic ratio of the PSD group (79.3%) was higher than that of the TPPS3-NH2 group (73.2%), probably because of the higher internalization ability of PSDs into the tumor cells owing to the ultra-small size. The results obtained from flow cytometry analysis disclosed that the early and late apoptosis are the basic modes of death in 4T1 cells, which was caused by the efficient 1O2 production.
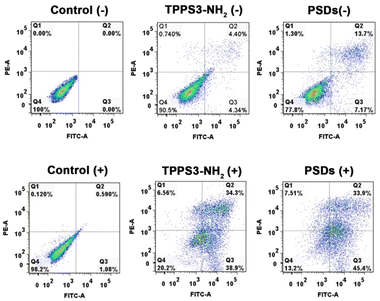 | ||
| Fig. 6 Flow cytometry analysis of 4T1-tumor cell apoptosis induced by TPPS3-NH2 and PSDs with or without laser irradiation based on annexin V-FITC/PI staining. | ||
2.8. Pharmacokinetics and biodistribution profile of porphyrin-silica dots
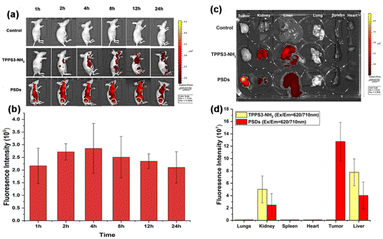
In order to maximize the therapeutic efficiency of in vivo photodynamic therapy, it is critical to investigate the time-dependent biodistribution of the photosensitizer in the mice, especially its accumulation in the tumor region, which is crucial for choosing the suitable time point for laser irradiation. Therefore, to monitor the biodistribution and tumor accumulation of ultra-small PSDs in 4T1 tumor-bearing female nude mice, a fluorescence imaging approach was adopted. PBS, TPPS3-NH2, and PSDs were intravenously injected via the tail-vein and fluorescence images were acquired until 24 h. Briefly, TPPS3-NH2 and PSDs at a dose of 2.5 mg kg−1 were injected intravenously in 4T1 tumor-bearing BALB/c female nude mice, and then the fluorescence signals at an excitation wavelength of 650 nm were traced at various pre-determined time points with an animal imaging system. As shown in Fig. 7a, in the TPPS3-NH2 group, the fluorescence signals of porphyrin were observed in major organs of the mice at 1 h of intravenous injection, but no tumor accumulation was observed. Consistent with our spectrophotometric results, we assumed that the intramolecular attachment between the TPPS3-NH2 molecules would lead to fluorescence quenching, and it seems difficult to observe any accumulated dye in the tumor region using the fluorescence imaging system. On the other hand, in the PSDs group, strong fluorescence signals in the tumor region, the organ of interest for PDT, were observed even at 1 h post-injection. The fluorescence intensity reached the maximum within 4 h. This indicates that PSDs passively accumulate in the tumor region, which is attributed to their small size that allowed the enhanced permeability and retention (EPR) effect to happen in the tumor region. After that, fluorescence signals of porphyrin began to gradually become week but still remained at a reasonably high level even at 24 h post-injection, as indicated in Fig. 7b. Nevertheless, PSDs exhibited higher tumor accumulation and a longer retention time compared to the TPPS3-NH2. Moreover, the highest tumor accumulation of PSDs in the tumor was observed at 4 h post-injection, we selected this time point for tumor light irradiation for the in vivo PDT cancer therapy.Furthermore, to quantitatively examine the biodistribution of PSDs in major organs or tissues, these mice were sacrificed at 24 h post-injection, and organs were excised for ex vivo fluorescence imaging. The fluorescence intensity of porphyrin was measured and it was found that the tumor region in the PSDs-treated mice displayed the highest fluorescence signals among all the other organs, implying higher tumor accumulation efficacy of these ultra-small nanocarriers (Fig. 7c and d).
Moreover, the pharmacokinetics of PSDs was further quantified by monitoring the blood circulation of PSDs in vivo. The fluorescence of porphyrin in PSDs was measured in blood plasma samples, which were collected at different time points. The long blood circulation half-life, which is encouraging for passive tumor targeting and accumulation of nanomaterials due to the EPR effect, was determined to be ∼2.294 h by fitting the data to a single exponential equation using GraphPad Prism (Fig. S4†). After 1 h of i.v injection of PSDs, the urine of the mice was collected, and the fluorescence signals of porphyrin were observed. Time-dependent analysis of fluorescence intensity of porphyrin revealed that injected PSDs were excreted from the mouse bodies mainly through the renal pathways (Fig. S5†).
2.9. In vivo antitumor efficacy of porphyrin-silica dots
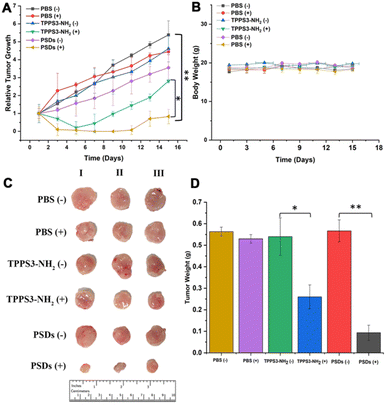
Encouraged by the superior in vitro antitumor performance and in vivo biodistribution analysis, we further evaluated the antitumor activity of PSDs in 4T1 tumor-bearing mice. When the mice tumors reached a normalized volume (100–200 mm3), they were divided into six groups including PBS, PBS (+), TPPS3-NH2 (−), TPPS3-NH2 (+), PSDs (−), and PSDs (+). PBS, TPPS3-NH2 (5 mg kg−1) and PSDs (equivalent porphyrin concentration 5 mg kg−1) were intravenously injected into the tumor-bearing mice.In order to evaluate the PDT efficacy, mice in the groups PBS (+), TPPS3-NH2 (+), and PSDs (+) were irradiated with a laser of 650 nm (0.2 W cm−2) for 30 min 4 h post-injection. As shown in Fig. 8a, in PBS, PBS (+), TPPS3-NH2 (−), and PSDs (−) groups, the tumor of the mice was observed to grow approximately 10-times larger in volume, indicating the negligible therapeutic effect of laser, TPPS3-NH2 and PSDs alone. In contrast, the mice treated with TPPS3-NH2 (+) showed partial inhibition of tumor growth, which was prominent in the first 5 days, afterward the tumor started to regrow and reached a size of ∼468 mm3. This limited tumor growth inhibition of TPPS3-NH2 (+) is due to its poor and non-specific tumor accumulation. On the other hand, mice treated with PSDs (+) exhibited the most efficient tumor delayed growth with no tumor recurrence within 11 days of treatment. For this group, the tumor regions left with black scars immediately after PST treatment (Fig. S6†). All these results indicated that PSD (+) treatment was found to be more effective in retarding tumor growth compared to the other groups, which is mainly attributed to the better tumor accumulation efficacy and enough cytoplasmic distribution of PSDs.
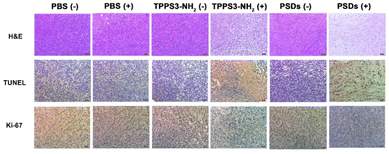
After confirmation of the inhibition trend of tumor growth by directly comparing the weight of the extracted tumor (Fig. 8d), hematoxylin and eosin (H&E), terminal deoxynucleotidyl transferase dUTP nick and labeling (TUNEL), and Ki-67 assays were performed. H&E staining of tumor sections also confirmed that the most potent tumor tissue apoptosis was caused by the PSDs-mediated PDT (Fig. 9). Ki-67 is regarded as the reference biomarker for cell proliferation and the TUNEL assay is widely used to observe the apoptotic cells in tumor tissues. Ki-67 and TUNEL assays further confirmed that PSDs with laser irradiation largely inhibited the tumor proliferation and improved the cell apoptosis compared with the other treatment groups (Fig. 9).
Additionally, the potential toxicity of a particular treatment is accessed by monitoring the body weight and evaluating the damage to healthy tissues. No significant body weight loss or obvious abnormality was observed in all the treatment groups during the course of therapy (Fig. 8b). Meanwhile, H&E staining analysis of major organ slices (i.e., heart, liver, spleen, lung, and kidney) didn't reveal any pathological abnormality or lesions (Fig. S7†), suggesting negligible toxicity of our therapeutic agents.
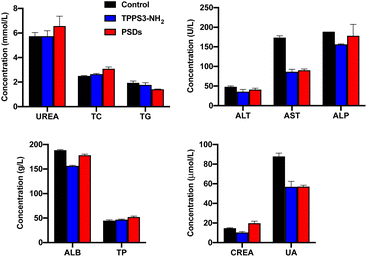
The liver and kidney are generally considered as the most important toxicological organs against harmful substances or nanomaterials. Therefore, blood toxicology profile analysis was performed by collecting the blood samples of the mice 24 h post-injection. As shown in Fig. 10, liver function indicators including ALT, ALP, AST, TP, and ALB in both TPPS3-NH2 and PSDs-treated groups were not statistically different from the control group. Similarly, the absence of renal damage or toxicity was also confirmed by the measurement of CREA, UREA, and UA concentrations as standard kidney function biomarkers. Moreover, the blood lipids (TG and TC) were also within the normal range and were at a similar level or slightly lower than those of the control group. All these results reveal no obvious injury to the liver and kidney with exposure of mice to PSDs, indicating their potential application for cancer treatments with negligible systemic toxicity.
3. Conclusions
In brief, we synthesized seemingly ultra-small organic–inorganic hybrid fluorescent core–shell silica NPs (referred to as PSDs) covalently encapsulating a highly water-soluble PS (TPPS3-NH2) for fluorescence imaging-guided PDT against breast cancer in vivo. In this system, high loading of PS, and sufficient aqueous solubility were easily achieved by the simplicity and versatility of the as-synthesized silica nanocarrier. Besides, the optimized ultra-small size, PEG surface, the hydrophilicity of PS, and the high stability of the silica shell under physiological conditions enable improved tumor accumulation, prolonged circulation, and a high therapeutic index. The PSDs demonstrated good biocompatibility in the HUVEC cell line even at higher concentrations explaining the excellent biocompatibility for their further use in vivo. Moreover, the cellular photocytotoxicity during exposure to the laser was significantly higher than the controls and TPPS3-NH2 depicting excellent 1O2 generation ability of designed PSDs. The in vivo animal study further confirmed the therapeutic efficacy by eliminating tumors in a 4T1-bearing mice model. Collectively, PSDs can provide a promising platform for effective diagnosis and treatment and improve therapeutic outcomes of cancer cells via fluorescence imaging-guided photodynamic therapy.4. Experimental
4.1 Chemicals and materials
Benzaldehyde, pyrrole, aluminum chloride (AlCl3), sodium nitrite (NaNO2), sodium carbonate (Na2CO3), magnesium sulfate (MgSO4), tin(II) chloride (SnCl2), and trifluoroacetic acid (TFA) were purchased from Sigma-Aldrich and used without further purification. All the other reagents such as N,N-dimethylformamide (DMF), dichloromethane (DCM), ethanol, and methanol were bought from Beijing Chemicals (Beijing, China) and were used without further purification. 3-Isocyanatopropyltrimethoxysilane (MW-205.28 g mol−1), N,N-diisopropylethylamine, tetramethyl orthosilicate (TMOS), and 2.0 M ammonia in ethanol were purchased from Sigma-Aldrich. Methoxy-terminated poly(ethylene glycol) chains (PEG-silane, MW ∼500 g mol−1) were purchased from Gelest. Fetal bovine serum (FBS), penicillin/streptomycin (P/S), trypsin-EDTA (0.25%), and Rose Park Memorial Institute (RPMI-1640) cell culture medium were supplied by Thermo Fisher Scientific. Singlet oxygen sensor green (SOSG) and methylthiazolyol tetrazolium (MTT) were obtained from KeyGEN (Nanjing, China). The annexin-V/propidium iodide (PI) apoptosis detection kit and calcine-AM (live-dead detection kit) were purchased from Yeasen Biotechnology Cooperation (Shanghai, China). De-ionized water (resistivity, 18.2 MΩcm−1) produced by the Mili-Q-purification system was used in all the experiments. All the other chemicals and reagents not mentioned here were of analytical grade.4.2. Synthesis of water-soluble porphyrin (TPPS3-NH2)
TPPS3-NH2 was synthesized and purified according to the procedures described previously with slight modification.28,35![[thin space (1/6-em)]](https://www.rsc.org/images/entities/char_2009.gif) :
:![[thin space (1/6-em)]](https://www.rsc.org/images/entities/char_2009.gif) 1 as the eluent. MS (MALDI-TOF) calculated for C44H29N5O2 [M + H]+m/z 660.24, found 660.27.
1 as the eluent. MS (MALDI-TOF) calculated for C44H29N5O2 [M + H]+m/z 660.24, found 660.27.
4.3. Synthesis of sub-10 nm porphyrin-silica dots
For the synthesis of sub-10 nm PEGylated porphyrin-silica dots (PSDs), TPP3-NH2 was first covalently conjugated with (3-isocyanatopropyl)trimethoxysilane (silane-CNO) in the presence of N,N-diisopropylethylamine. Briefly, a mixture of TPPS3-NH2 (4 mg), silane-CNO (4.5 μL), and N,N-diisopropylethylamine (3.04 μL) in ethanol (1 mL) was stirred overnight at room temperature. MS (MALDI-TOF) calculated for C44H28N5O9S33− [M + H]+m/z 357.06, found 346.03.The PSDs with ultra-small sizes were synthesized based on a previously reported protocol.21,36 More specifically, for the synthesis of sub-10 nm PSDs, 1 mL of 0.02 M ammonia was added into DI water (9 mL) and stirred for 10 min. The silane-conjugated TPPS3-NH2 was then added together with TMOS (0.43 mmol) under vigorous stirring in the reaction mixture, followed by overnight magnetic stirring at room temperature. The molar ratio of TMOS to silane-conjugated TPPS3-NH2 was ∼100![[thin space (1/6-em)]](https://www.rsc.org/images/entities/char_2009.gif) :
:![[thin space (1/6-em)]](https://www.rsc.org/images/entities/char_2009.gif) 1. Subsequently, 0.21 mmol of PEG-silane was added and the solution was further stirred overnight by magnetic stirring at room temperature. After that, the stirring of the reaction mixture was stopped, and the temperature was raised to 80 °C. The solution was then left static overnight at this temperature. After cooling the reaction mixture to room temperature, the resulting PSDs were transferred to a dialysis membrane tube (MW cutoff = 10
1. Subsequently, 0.21 mmol of PEG-silane was added and the solution was further stirred overnight by magnetic stirring at room temperature. After that, the stirring of the reaction mixture was stopped, and the temperature was raised to 80 °C. The solution was then left static overnight at this temperature. After cooling the reaction mixture to room temperature, the resulting PSDs were transferred to a dialysis membrane tube (MW cutoff = 10![[thin space (1/6-em)]](https://www.rsc.org/images/entities/char_2009.gif) 000). The PSDs in the dialysis membrane tube were dialyzed in DI water (∼2000 mL) for ∼6 days and water were changed once a day to rinse away any unreacted reagent. Afterward, any particle aggregates or dust particles were removed by filtering the as-synthesized PSDs through a 200 nm-syringe filter. The resulting PSD sample was then stored at 4 °C and characterized by DLS, TEM, UV-vis, and fluorescence spectroscopy.
000). The PSDs in the dialysis membrane tube were dialyzed in DI water (∼2000 mL) for ∼6 days and water were changed once a day to rinse away any unreacted reagent. Afterward, any particle aggregates or dust particles were removed by filtering the as-synthesized PSDs through a 200 nm-syringe filter. The resulting PSD sample was then stored at 4 °C and characterized by DLS, TEM, UV-vis, and fluorescence spectroscopy.
4.4. Characterization of porphyrin-silica dots
The morphological dimensions particularly the size distribution of PSDs were investigated by transmission electron microscopy (TEM, Hitachi, H-7650). A 90Plus/BI-MAS DLS analyzer (Brookhaven Zeta PALS instruments) was used to acquire the value of zeta potential, hydrodynamic particle size, and size distribution. Each DLS sample was measured 3-times. UV-visible absorption spectra of PSDs were measured using an Evolution 220 spectrophotometer, while a Lumina spectrophotometer (Thermo Fisher Scientific) was used to measure the fluorescence emission spectra.4.5. Loading efficiency of porphyrin in porphyrin-silica dots
The loading efficiency (LE) of porphyrin in PSDs was measured using a UV-visible spectrophotometer. Briefly, freshly prepared PSDs were suspended in water and the absorption band of the porphyrin at 420 nm was evaluated. A linear calibration curve was then used to measure the amount of porphyrin encapsulated inside the PSDs. Moreover, the loading efficiency was then calculated using the following equation:| LE% = weight of porphyrin in PSDs/weight of porphyrin initially used × 100. |
4.6. Generation of singlet oxygen (1O2) in solution
The generation of singlet oxygen by TPPS3-NH2 and PSDs upon light irradiation was conducted using SOSG (molecular probe, USA). Briefly, 10 μL of SOSG (0.5 mM), 5 μL of TPPS3-NH2, and PSDs (different concentrations of TPPS3-NH2 and PSDs were considered to investigate the effect of concentration of photosensitizer on 1O2 production) were mixed with 85 μL of water and transferred to 96-well plates. The solution was kept in the dark and irradiated with a 650 nm laser for predefined time intervals and the fluorescence intensity of SOSG was monitored at Ex/Em: 490/520 nm using a BioTek Synergy HT microplate reader. Error bars are based on triplicate samples.4.7. Cellular uptake of porphyrin-silica dots
For in vitro studies, the 4T1 cell line was used. The cells were cultured in a regular growth medium consisting of RPMI 1640 medium, supplemented with 1% penicillin/streptomycin and 10% fetal bovine serum (FBS) under an atmosphere of 37 °C under 5% CO2.To observe the cellular uptake of PSDs, 4T1 cancer cells with 1 × 10⁵ density were cultured on a cover-glass in a 24-well plate and left for 24 h until confluency. Subsequently, the cell culture medium was removed, and the cells were rinsed twice with phosphate-buffered saline (PBS, pH 7.4). The cells were incubated with a fresh medium containing porphyrin (10 μM) and PSDs (10 μM porphyrin equivalence) for different periods of time (0 h, 3 h, and 6 h). After washing the cell-containing glass slides with PBS three times, the cells were fixed with 4% paraformaldehyde at 4 °C for 15 min, followed by staining with DAPI, as per the standard protocol.37 Finally, the cells were rinsed twice with PBS, and cellular internalization of TPPS3-NH2 and PSDs was observed under a Zeiss LSM 410 confocal laser scanning microscope (CLSM). The red channel for porphyrin and PSDs was excited at 420 nm and its red emission was collected in the range of 650–800 nm, while the blue channel for DAPI was excited at 402 nm and its blue emission was collected in the range of 435–480 nm.
In order to further quantify the cellular uptake of PSDs, flow cytometric analysis was performed. 4T1 cells were pre-seeded in 6-well plates at a density of 2.0 × 10⁵ per well and maintained for ∼24 h. Afterward, the cells were separately incubated with 10 μM of TPPS3-NH2 and PSDs for 0 h, 3 h, and 6 h at 37 °C. For flow cytometry measurements, the cells were washed with PBS thrice, treated with trypsin, washed with medium, centrifuged, and finally dispersed in 500 μL PBS. Finally, the cellular fluorescence intensity of porphyrin in PSDs was measured with excitation at 405 nm by flow cytometry (FACSAria IIII, BD).
4.8. Cellular ROS detection
To verify the intracellular 1O2 generation, 4T1 cells at a density of 5 × 10⁴ per well were cultured on 24-well plates and kept at 37 °C in a 5% CO2 humidified atmosphere for 24 h. Then, the medium was replaced with a fresh medium containing TPPS3-NH2, and PSDs (equivalent porphyrin concentration of 20 μM). After 4 h of incubation, a sample containing medium was removed, and the cells were washed twice with PBS, followed by the addition of fresh medium (serum-free) containing SOSG (50 μM) and incubation for 30 min. The cells were then consecutively subjected to 650 nm laser irradiation (0.2 W cm−2) for 5 min. After 30 min of incubation, the 4T1 cells were washed with PBS twice and the SOSG fluorescence intensity (Ex/Em: 490/530 nm) was measured using a microplate reader (BioTek Synergy HT), and the cells were imaged using a fluorescence microscope (Leica DM 13000B (Wetzlar, Germany).Cellular ROS generation was also confirmed by using another ROS probe (H2DCFDA, 20 μM). The ROS detection experiment was performed with a similar procedure mentioned above except that the fluorescence intensity of H2DCFDA was measured at an excitation wavelength of 485 nm.
4.9. Photodynamic treatment and cytotoxicity assessment
The cytotoxicity assessment of PSDs was carried out against 4T1 tumor cells by the MTT assay. Briefly, 4T1 cells at a density of 1 × 10⁵ per well were seeded in 96-well plates and incubated for 24 h. Then, the dead cells containing media were removed and the cells were washed twice with PBS.The cells were replenished with medium containing TPPS3-NH2 and PSDs at various concentrations (1.56–50 μM) or only medium (for the control group) and incubated for 4 h for optimal uptake. Afterward, the drug-containing medium was removed, and the cells were replenished with fresh medium, accompanied by irradiation treatment with 650 nm light irradiation (0.2 W cm−2, 5 min). After dark incubation for 12 h, the MTT solution (10 μL, 5 mg mL−1), an indicator to probe the viability of cells, was added to each well for quantitative evaluation of the photodynamic cytotoxicity and the plates were incubated for 4 h. Subsequently, the media were removed and 100 μL of DMSO was added to dissolve the purple formazan crystals. After shaking the plates for 15 min, the plates were scanned using a microplate reader at 570 nm.
Except for the MTT assay, the cytotoxicity of PSDs was also investigated by the calcein-AM and propidium iodide (PI) assay. For co-staining of live and dead cells, 4T1 cells were seeded on 24-well plates at a density of 5 × 10⁴ cells per well. The cells were then incubated with porphyrin and PSDs (equivalent porphyrin concentration of 20 μM) for 4 h followed by irradiation with a 650 nm laser (0.2 W cm−2) for 10 min. After 1 h of further incubation, the cells were co-stained with calcein-AM/PI (10 μM calcein-AM, 5 μM PI) and incubated for 30 min at 37 °C. The 4T1 cells were washed with PBS three times and images were captured with a fluorescence microscope (calcein AM λex = 488 nm, λem = 515 nm: PI λex = 535 nm, λem = 617 nm).
The apoptotic and necrotic cell distributions were identified by the annexin V-FITC/PI apoptosis assay, as per the protocol provided by the manufacturer. More specifically, 4T1 tumor cells (2.5 × 10⁵ cells per well) were pre-seeded in triplicate in 6-well plates and cultured for 24 h to ensure the firm attachment of cells on the plate. Six groups named; (i) control without laser irradiation, (ii) control with laser irradiation, (iii) TPPS3-NH2 without laser irradiation, (iv) TPPS3-NH2 with laser irradiation, (v) PSDs without laser irradiation, and (vi) PSDs with laser were prepared in triplicate. The 4T1 cells of groups (iii) and (iv) were co-incubated with TPPS3-NH2 (20 μM), while the 4T1 cells of groups (v) and (vi) were co-incubated with PSDs at an equivalent concentration of 20 μM of porphyrin for 4 h. The cells in the control group were refreshed with a fresh medium only. After 4 h, the medium of all the groups was refreshed and the cells of groups (ii), (iv), and (vi) were irradiated at 650 nm (0.2 W cm−2) for 10 min.
After 12 h of additional incubation at 37 °C, the cells were trypsinized, harvested, washed with PBS twice, and resuspended in 200 μL of binding buffer containing 5 μL Annexin V-FITC and 5 μL PI solution for 15 min under dark conditions. 300 μL of binding buffer was then added to each sample and analyzed by flow cytometry (FACSAria, III, BD). The data were interpreted and reported using FlowJo 7.6 software.
4.10. Establishment of a tumor model
Healthy female BALB/c nude mice (4 week-old, 16–18 g) were handled according to the approved procedure and guidelines by the Institutional Animal Care and Use Committee of Peking University. The subcutaneous xenograft tumor model was established by efficiently injecting 4T1 murine breast cancer cells (at a density of 1 × 10⁷ cells in 80 μL PBS) into the right hindlimb of the anesthetized mice. When the tumor volume reached ∼100–200 mm3, the subsequent animal studies were conducted.4.11. Pharmacokinetics and biodistribution analysis
Tumor-bearing mice were i.v. injected with PBS, TPPS3-NH2, and PSDs (concentration of porphyrin = 5 mg kg−1) via tail vein administration. In vivo fluorescence imaging was carried out at designated time intervals (1, 2, 4, 8, 12, 24 h) using an IVISTM-200 (Xenogen Corp) with an excitation filter of 660 nm, and the emission filter was set at 710 nm. Mice were anesthetized with isoflurane gas in oxygen flow during the imaging process. After 24 h post-injection, the mice were sacrificed and the tumor and other organs, including heart, liver, spleen, lungs, and kidneys were excised and analyzed for ex vivo imaging and semi-quantitative biodistribution of porphyrin and PSDs. The acquisition parameter was Ex/Em = 660/710 nm.For monitoring the blood clearance rate of PSDs, 6 weeks old female BALB/c nude mice were i.v. injected with the PSD solution at a porphyrin dose of 5 mg kg−1. At pre-determined time intervals (0, 2, 4, 8, 12, and 24 h), blood samples were collected with heparin-coated capillary tubes from the orbital plexus. The blood plasma samples were obtained after centrifugation (3000 rmp, 10 min). The content of porphyrin in the collected plasma was measured by recording the fluorescence intensity of porphyrin at 650 nm as a function of time using a microplate reader. The half-life (t1/2) was calculated using GraphPad Prism software.
For renal clearance analysis, the BALB/c nude mice were i.v. injected with the PSD solution (concentration of porphyrin = 5 mg kg−1). Afterward, the urine of the mice was collected at different time-points. The content of porphyrin in the collected urine was measured by recording the fluorescence intensity of porphyrin at 650 nm as a function of time.
4.12. In vivo antitumor efficacy
When the tumor volume reached about 100 mm3, the 4T1 tumor-bearing mice were randomly distributed into six groups (n ≥ 5). Different treatments were applied to each group: (i) PBS group injected with saline, (ii) PBS with laser group injected with saline and subjected to laser irradiation, (iii) porphyrin group treated with porphyrin (5 mg kg−1) only, (iv) porphyrin with laser group injected with porphyrin (5 mg kg−1) and irradiated, (v) PSDs group injected with PSDs (5 mg kg−1), (vi) PSDs with laser group treated with PSDs (5 mg kg−1) and laser irradiation. Aliquots (100 μL) of freshly prepared formulations were i.v. injected into the mice only once throughout the in vivo study. After 4 h, laser treatment was performed on the groups (ii), (iv), and (vi) by irradiating the tumor region with a 650 nm laser (0.2 W cm−2) for approximately 30 min. All treatment groups were kept under dark conditions throughout the experimental period. The tumor size was monitored with a Vernier caliper into two perpendicular dimensions every third day for 15 days. The tumor volume was calculated as V = length × width2/2. Besides, the bodyweight of each mice was also recorded to ensure negligible treatment-induced toxicity. After 15 days, some mice were sacrificed, and tumors were collected and washed with saline. The tumor photos were captured using a digital camera (Nikon, Japan).4.13. Histological analysis
After 15 days of PDT, mice from each treatment group (n = 3) were isolated and sacrificed. Tumor and major organs were collected, washed with saline, and fixed in 4% formalin. After that, these formalin-fixed paraffin-embedded tissues of major organs and tumors were stained with hematoxylin and eosin (H&E) to ensure biosafety and biocompatibility. Besides, paraffin-embedded tumor tissues were also analysed by TUNEL and Ki-67 assays to evaluate apoptosis and cell proliferation. All the stained tissues were finally visualized using a fluorescence microscope system.4.14. Toxicology profile
For toxicology profile analysis of PSDs, the mice blood was collected from each treatment group 24 h post-injection. Whole blood was collected in an EDTA tube, and serum was separated by centrifugation and analyzed for ALT (alanine aminotransferase), ALP (alkaline phosphatase), AST (aspartate aminotransferase), ALB (albumin), TP (total protein), UREA (urea), CREA (creatinine), UA (uric acid), TG (triglyceride), and TC (total cholesterol).4.15. Statistical analysis
Experimental data were expressed as mean ± SD data. GraphPad Prism 8 and Microsoft Excel software were used to conduct the statistical analysis. The significance of results was evaluated using analysis of variance (ANOVA) particularly for comparing the different groups. The difference of p < 0.05 was considered statically significant.Author contributions
Sadaf Hameed and Pravin Bhattarai conceived the project and performed all experiments and data analysis. All authors participated in the interpretation of data, manuscript writing and the revisions. All authors approved the final version of the manuscript.Conflicts of interest
There are no conflicts to declare.Acknowledgements
This work was supported by grants from National Project for Research and Development of Major Scientific Instruments (No. 81727803), National Natural Science Foundation of China (No. 82071980), Projects of International Cooperation and Exchanges NSFC-PSF (No. 31961143003) and State Key Program of National Natural Science of China (No. 81930047).Notes and references
- A. Urruticoechea, R. Alemany, J. Balart, A. Villanueva, F. Vinals and G. Capella, Curr. Pharm. Des., 2010, 16, 3–10 CrossRef CAS PubMed.
- S. Gai, G. Yang, P. Yang, F. He, J. Lin, D. Jin and B. Xing, Nano Today, 2018, 19, 146–187 CrossRef CAS.
- H. Chen and Z. Dai, J. Bio-X Res., 2021, 4, 77–86 Search PubMed.
- I. Brigger, C. Dubernet and P. Couvreur, Adv. Drug Delivery Rev., 2012, 64, 24–36 CrossRef.
- A. Farzin, S. A. Etesami, J. Quint, A. Memic and A. Tamayol, Adv. Healthcare Mater., 2020, 9, 1901058 CrossRef CAS PubMed.
- M. Adeel, F. Duzagac, V. Canzonieri and F. Rizzolio, ACS Appl. Nano Mater., 2020, 3, 4962–4971 CrossRef CAS.
- C. Gao, P. Bhattarai, M. Chen, N. Zhang, S. Hameed, X. Yue and Z. Dai, Bioconjugate Chem., 2018, 29, 3967–3981 CrossRef CAS PubMed.
- H. Y. Yoon, S. Jeon, D. G. You, J. H. Park, I. C. Kwon, H. Koo and K. Kim, Bioconjugate Chem., 2017, 28, 124–134 CrossRef CAS PubMed.
- Q. Zhang, K. G. Neoh, L. Xu, S. Lu, E. T. Kang, R. Mahendran and E. Chiong, Langmuir, 2014, 30, 6151–6161 CrossRef CAS PubMed.
- P. Dong, J. Hu, S. Yu, Y. Zhou, T. Shi, Y. Zhao, X. Wang and X. Liu, Small Methods, 2021, 5, 2100581 CrossRef CAS PubMed.
- P.-C. Lo, M. S. Rodríguez-Morgade, R. K. Pandey, D. K. Ng, T. Torres and F. Dumoulin, Chem. Soc. Rev., 2020, 49, 1041–1056 RSC.
- X. Yao, Z. Tian, J. Liu, Y. Zhu and N. Hanagata, Langmuir, 2017, 33, 591–599 CrossRef CAS PubMed.
- X. Ma, Q. Qu and Y. Zhao, ACS Appl. Mater. Interfaces, 2015, 7, 10671–10676 CrossRef CAS PubMed.
- J. Xiao, J. Weng, F. Wen and J. Ye, ACS Omega, 2020, 5, 32861–32867 CrossRef CAS PubMed.
- R. Liu, Y. Xu, K. Xu and Z. Dai, Aggregate, 2021, 2, e23 Search PubMed.
- T. Y. Ohulchanskyy, I. Roy, L. N. Goswami, Y. Chen, E. J. Bergey, R. K. Pandey, A. R. Oseroff and P. N. Prasad, Nano Lett., 2007, 7, 2835–2842 CrossRef CAS PubMed.
- C. Xu, J. Nam, H. Hong, Y. Xu and J. J. Moon, ACS Nano, 2019, 13, 12148–12161 CrossRef CAS PubMed.
- D. Chen, Z. Wang, H. Dai, X. Lv, Q. Ma, D.-P. Yang, J. Shao, Z. Xu and X. Dong, Small Methods, 2020, 4, 2000013 CrossRef CAS.
- C. E. Ashley, E. C. Carnes, G. K. Phillips, D. Padilla, P. N. Durfee, P. A. Brown, T. N. Hanna, J. Liu, B. Phillips, M. B. Carter, N. J. Carroll, X. Jiang, D. R. Dunphy, C. L. Willman, D. N. Petsev, D. G. Evans, A. N. Parikh, B. Chackerian, W. Wharton, D. S. Peabody and C. J. Brinker, Nat. Mater., 2011, 10, 389–397 CrossRef CAS PubMed.
- J. Kim, H. R. Cho, H. Jeon, D. Kim, C. Song, N. Lee, S. H. Choi and T. Hyeon, J. Am. Chem. Soc., 2017, 139, 10992–10995 CrossRef CAS PubMed.
- F. Chen, K. Ma, M. Benezra, L. Zhang, S. M. Cheal, E. Phillips, B. Yoo, M. Pauliah, M. Overholtzer, P. Zanzonico, S. Sequeira, M. Gonen, T. Quinn, U. Wiesner and M. S. Bradbury, Chem. Mater., 2017, 29, 8766–8779 CrossRef CAS PubMed.
- F. Chen, X. Zhang, K. Ma, B. Madajewski, M. Benezra, L. Zhang, E. Phillips, M. Z. Turker, F. Gallazzi, O. Penate-Medina, M. Overholtzer, M. Pauliah, M. Gonen, P. Zanzonico, U. Wiesner, M. S. Bradbury and T. P. Quinn, ACS Appl. Mater. Interfaces, 2018, 10, 36584 CrossRef CAS.
- D. R. Larson, H. Ow, H. D. Vishwasrao, A. A. Heikal, U. Wiesner and W. W. Webb, Chem. Mater., 2008, 20, 2677–2684 CrossRef CAS.
- E. Blanco, H. Shen and M. Ferrari, Nat. Biotechnol., 2015, 33, 941–951 CrossRef CAS PubMed.
- X. Gao, Q. Feng, J. Wang and X. Zhao, Cancer Biol. Med., 2022, 19, 1290–1300 CrossRef PubMed.
- M. Lan, S. Zhao, W. Liu, C. S. Lee, W. Zhang and P. Wang, Adv. Healthcare Mater., 2019, 8, 1900132 CrossRef PubMed.
- J. Chen, T. Fan, Z. Xie, Q. Zeng, P. Xue, T. Zheng, Y. Chen, X. Luo and H. Zhang, Biomaterials, 2020, 237, 119827 CrossRef CAS PubMed.
- X. Liang, X. Li, L. Jing, X. Yue and Z. Dai, Biomaterials, 2014, 35, 6379–6388 CrossRef CAS PubMed.
- L. Jing, X. Liang, X. Li, Y. Yang and Z. Dai, Acta Biomater., 2013, 9, 9434–9441 CrossRef CAS PubMed.
- K. Ma, C. Mendoza, M. Hanson, U. Werner-Zwanziger, J. Zwanziger and U. Wiesner, Chem. Mater., 2015, 27, 4119–4133 CrossRef CAS.
- T. Holm, H. Johansson, P. Lundberg, M. Pooga, M. Lindgren and Ü. Langel, Nat. Protoc., 2006, 1, 1001 CrossRef CAS.
- K. Kano, T. Sato, S. Yamada and T. Ogawa, J. Phys. Chem., 1983, 87, 566–569 CrossRef CAS.
- D. E. Dolmans, D. Fukumura and R. K. Jain, Nat. Rev. Cancer, 2003, 3, 380–387 CrossRef CAS PubMed.
- P. R. Silva, L. L. R. Vono, B. P. Espósito, M. S. Baptista and L. M. Rossi, Phys. Chem. Chem. Phys., 2011, 13, 14946–14952 RSC.
- C. Flors, M. J. Fryer, J. Waring, B. Reeder, U. Bechtold, P. M. Mullineaux, S. Nonell, M. T. Wilson and N. R. Baker, J. Exp. Bot., 2006, 57, 1725–1734 CrossRef CAS PubMed.
- C. Zhang, Z. Zhou, X. Zhi, Y. Ma, K. Wang, Y. Wang, Y. Zhang, H. Fu, W. Jin, F. Pan and D. Cui, Theranostics, 2015, 5, 134–149 CrossRef PubMed.
- S. Hameed, P. Bhattarai, X. Liang, N. Zhang, Y. Xu, M. Chen and Z. Dai, Theranostics, 2018, 8, 5501–5518 CrossRef CAS PubMed.
Footnote |
| † Electronic supplementary information (ESI) available. See DOI: https://doi.org/10.1039/d2na00704e |
| This journal is © The Royal Society of Chemistry 2023 |

