 Open Access Article
Effect of Sr and Ti substitutions on optical and photocatalytic properties of Bi1−xSrxFe1−xTixO3 nanomaterials†
Manal
Benyoussef
a,
Sébastien
Saitzek
 b,
Nitul S.
Rajput
 c,
Mimoun
El Marssi
a and
Mustapha
Jouiad
 *a
*a
aLaboratory of Physics of Condensed Matter (LPMC), University of Picardie Jules Verne, Scientific Pole, 33 Rue Saint-Leu, CEDEX 1, 80039 Amiens, France. E-mail: mustapha.jouiad@u-picardie.fr
bUniversité d’Artois, CNRS, Centrale Lille, ENSCL, Université de Lille, UMR 8181, Unité de Catalyse et Chimie du Solide (UCCS), 62300 Lens, France
cAdvanced Materials Research Center, Technology Innovation Institute, Abu Dhabi P.O. Box 9639, United Arab Emirates
First published on 28th December 2022
Abstract
The potential use of down-sized BFO-xSTO systems (x ≤ 25%) as highly efficient photoanodes for photocatalytic water splitting is investigated. BFO-xSTO is prepared by a solid-state method and subsequently deposited by spray coating. The compounds possess rhombohedral symmetry for x ≤ 15% and phase coexistence for x > 15%, as demonstrated by Raman spectroscopy and transmission electron microscopy. Our findings revealed a drastic grain size decrease with increasing STO content, namely 260 nm for BFO to 50 nm for BFO with 25% STO. Moreover, BFO-xSTO, x > 10% exhibited high optical absorption (> 80%) in the full spectrum and interestingly a very promising band alignment with water redox potentials. Moreover, the photochemical measurements revealed a photocurrent density of ∼0.17 μA cm−2 achieved for x = 15% at 0 bias. Using DFT calculations, the substitution effects on the electronic, optical, and photocatalytic performances of the BFO system were investigated and quantified. Surprisingly, a high hydrogen yield (∼191 μmol g−1) was achieved by BFO-12.5%STO compared to 1 μmol g−1 and 57 μmol g−1 for BFO and STO, respectively. This result highlights the beneficial effects of both the downsizing and substitution of BFO on the photocatalytic water splitting and hydrogen production performances of Bi1−xSrxFe1−xTixO3 systems.
1. Introduction
The effective conversion of solar energy into clean fuel through photoelectrochemical (PEC) water splitting (WS) is a very promising technology to ensure sustainability in the energy supply chain.1,2 Great efforts have been recently deployed for the development of advanced oxide perovskite catalysts as potential photoanodes for solar-driven WS reactions. Increasing the yield of WS reactions constitutes the main challenge facing this technology. This requires an efficient generation of charge carriers, electron–hole (e–h) pairs necessary to enhance the WS reaction, and increase the hydrogen and oxygen production throughput via high catalytic water reduction and oxidization.The BiFeO3 (BFO) oxide perovskite system is considered an interesting photocatalyst for PEC WS owing to its outstanding properties, such as visible light absorption (Eg = 2.7 eV) and intrinsic ferroelectric properties (P ≈ 90 μC cm−2).3–7 In our previous work, we have demonstrated improved optical and photocatalytic performances in low dimensional BFO thin films due to their morphology, crystal structure, and high surface area.8 However, the band alignment of pristine BFO thin films needs to be adjusted with water redox potentials to efficiently produce hydrogen.7 This requires further development and search for appropriate element substitutions to avoid relying on a single compound. Indeed, using neat BFO limits possible solutions to engineer the desired photocatalyst possessing the required properties. Moreover, a single-compound catalyst displays several inherent limitations, namely rapid e–h pair recombination and active back-reactions, which strongly hamper the hydrogen production efficiency. In this regard, extensive research has been devoted to the development of photocatalysts using doping, solid solutions, and cocatalysts, in addition to Z-scheme and S-scheme heterojunctions.9–16 In particular, the development of solid-solution catalyst materials based on BFO and SrTiO3 (STO) systems was reported to be the most fortunate route to tune the electronic structure and improve photocatalytic performances of the overall system. Indeed, STO has proven to exhibit prominent photocatalytic properties for hydrogen evolution reaction (HER) owing to its appropriate valence and conduction band potentials that are larger than the redox potential of the WS reaction.17 Furthermore, STO is a catalyst with chemical stability, non-toxicity, and economical affordability.18 Regarding BFO doping by STO, previous works have mainly focused on the photocatalytic properties of BFO-xSTO solid solutions at high STO content (x ≥ 25). As an example, using the conventional solid state synthesis method, Bi1−xSrxFe1−xTixO3 (x ≥ 0.6) solid solution was found to exhibit high photocatalytic performances for x = 0.9.19 A similar investigation was conducted on epitaxial Bi1−xSrxFe1−xTixO3 (x ≥ 0.25) thin films fabricated by a pulsed laser deposition technique.20 This research attempted to provide a comprehensive investigation on the origin of the improved photocatalytic performances of the BFO-STO system (x = 0.5) using DFT calculations and local density approximation (LDA) implemented into the Vienna code.
Our present work aims to give insights into the optical and photocatalytic performances of low dimensional Bi1−xSrxFe1−xTixO3 (BFO-xSTO) thin films for several STO contents (x ≤ 0.25) via solid-state assisted high energy ball milling and deposited using spray coating. The improved photocatalytic performances and the ability to yield a higher HER are examined and quantified using DFT calculations.
2. Materials and methods
Stoichiometric bismuth oxide (Bi2O3, Sigma Aldrich, 99.99%), iron oxide (Fe2O3, Alfa Aesar, 99.998%), strontium carbonate (SrCO3, Sigma Aldrich, >99.9%), and titanium dioxide (TiO2, Sigma Aldrich, >99%) were weighed, mixed in ethanol, and subsequently processed by high energy ball milling (Emax Retsch). The dried powders were uniaxially pressed into pellets and placed into a muffle furnace (Carbolite) for calcination with a cooling/heating rate of 5 °C min−1. The phase purity of the resulting powder was investigated using X-ray diffraction (XRD, Bruker, CuKα = 1.54 Å). This was followed by leaching using glacial acetic acid (99%) performed on the calcined powders to remove the secondary phases (bismuth rich phase). The vibrational properties were investigated using a micro-Raman spectrometer (Renishaw) with green laser excitation at 532 nm. TEM analyses of BFO-xSTO nanoparticles were carried out using an image corrected TEM system (Thermofisher Scientific Titan G2) operating at 300 kV. Samples were sonicated for 3 min in isopropanol solution and subsequently drop casted on a TEM grid (ultra-thin carbon support film on lacey carbon) and dried at room temperature. The spray coating technique was used to subsequently deposit a precursor solution based on BFO-xSTO nanoparticles (C = 0.1 M) on glass and FTO substrates. The temperature of the substrate was kept at 400 °C during deposition. The duration and rate of the deposition were set to 1 h and 1 ml min−1, respectively. A UV-visible-near IR spectrophotometer (JASCO-60) operating in transmission mode was used to investigate the optical properties of BFO-xSTO thin films in the spectral range of 200–1000 nm. The photocurrents and Mott–Schottky plots were collected using an electrochemical device (Autolab PGSTAT204, Metrohm) coupled to a LED module (LED Driver kit, Metrohm). LEDs (450, 470, 505, 590, and 627 nm) with low spectral dispersion were used. Three electrodes were used for the measurements, including Ag/AgCl as the reference electrode, Pt wire as the counter electrode and BFO-xSTO films deposited on an FTO substrate as the working electrode. The electrolyte was a 0.1 M Na2SO4 aqueous solution. The Mott–Schottky curves were recorded at 1 kHz with an applied bias voltage of 0.6 V. DFT calculations were performed on bulk systems using the full-potential linearized augmented plane wave (FLAPW) method as implemented in the Wien2k code.21 The modified generalized gradient (GGA) approximation and Tran and Blaha modified Beck–Johnson potential (TB-mBJ) method were used to correct the exchange–correlation potential. Note that a rhombohedral (R3c) structure was considered for the BFO and BFO-STO systems and a cubic symmetry (Pm![[3 with combining macron]](https://www.rsc.org/images/entities/char_0033_0304.gif) m) was used to simulate the STO system. To investigate the substitution effect on BFO, we used a 2 × 2 × 2 matrix (80 atoms) where 1/8 Bi atom was substituted by one Sr atom and 1/8 Fe atom was substituted by one Ti atom, resulting in a substitution content of 12.5%. The atomic positions of the studied compounds were fully relaxed before calculations.
m) was used to simulate the STO system. To investigate the substitution effect on BFO, we used a 2 × 2 × 2 matrix (80 atoms) where 1/8 Bi atom was substituted by one Sr atom and 1/8 Fe atom was substituted by one Ti atom, resulting in a substitution content of 12.5%. The atomic positions of the studied compounds were fully relaxed before calculations.
To assess the amount of hydrogen produced in the BFO-xSTO systems, we evaluated several parameters, i.e., the effective masses of electrons  , the effective density of states Nc (cm−3), and the charge carrier density n (cm−3).
3. Results and discussion
3.1. Structural characterization
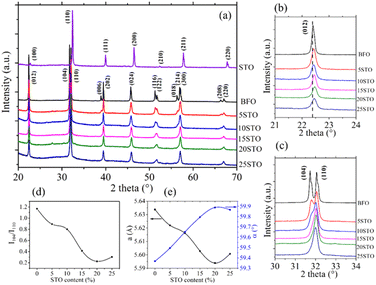
Fig. 1a shows the XRD diagrams of Bi1−xSrxFe1−xTixO3 powders for x = 0 to x = 1 with 2θ ranging between 20° and 70°. Pure perovskite phase spectra are observed for all considered solid solutions. As expected, the pristine BFO powder presents all reflections of the rhombohedral (R3c) symmetry, whereas a cubic (Pm![[3 with combining macron]](https://www.rsc.org/images/entities/char_0033_0304.gif) m) symmetry is observed for the neat STO system.
m) symmetry is observed for the neat STO system.
Fig. 1b and c show the zoomed-in XRD patterns centered at 22.5° and 32°, respectively, of the BFO-xSTO samples. A gradual 2θ upshift as a function of the increase in STO content from 0 to 20% can be observed in Fig. 1b. This indicates a decrease in the lattice parameters, as depicted in Fig. 1e. This behavior is mainly due to the substitution of Fe by Ti, exhibiting a lower ionic radius (rTi4+ = 0.0605 nm < rFe3+ = 0.0645 nm). Similarly, Fig. 1c shows a gradual decrease in the (104) reflection intensity with increasing STO content, resulting in one broad peak for the 25% STO system. To better examine the substitution effect on the structural properties, we show the intensity ratio (I104/I110) between the (104) and (110) reflection peaks in Fig. 1d. A clear gradual decrease in I104/I110 is noticed with increasing STO content to 20% with a slight increase for x = 25%. A similar trend is observed in the lattice parameter evolution versus the STO content, with a slight increase in a for the 25% STO composition. Note that previous studies on BFO-xSTO solid solution revealed a cubic symmetry for x = 0.5–1.19,22
Moreover, a rhombohedral structure was reported in a BFO-20% STO system synthesized using the sol–gel modified Pechini method.23 In addition, Smirnova et al. reported a symmetry change from non-centrosymmetric (R3c) to centrosymmetric (Pm![[3 with combining macron]](https://www.rsc.org/images/entities/char_0033_0304.gif) m) for x ≥ 0.3.24 Therefore, the increased I104/I110 ratio and lattice parameters for x = 0.25 in our case are likely to be ascribed to a structural change from rhombohedral to phase coexistence between rhombohedral and cubic symmetries (R3c + Pm
m) for x ≥ 0.3.24 Therefore, the increased I104/I110 ratio and lattice parameters for x = 0.25 in our case are likely to be ascribed to a structural change from rhombohedral to phase coexistence between rhombohedral and cubic symmetries (R3c + Pm![[3 with combining macron]](https://www.rsc.org/images/entities/char_0033_0304.gif) m). To support this statement, we performed Raman spectroscopy on BFO-xSTO systems for all values of STO content (x = 0–0.25). The results are depicted in Fig. 2a, showing the deconvoluted Raman spectra of the solid solution collected at room temperature in the 35–800 cm−1 frequency range. Note that the Raman spectrum of the pristine rhombohedral BFO system is in good agreement with reported literature.25–27 We recall that the irreducible representation of the R3c space group can be expressed by: Γ = 4A1 + 5A2 + 9E, where the A2 modes are silent and the A1 modes (z-direction) and the doubly degenerate E modes (x-y plane) are both Raman and IR active. This results in 13 Raman active modes for the R3c space group; however, it should be mentioned that each vibrational mode can be divided into two distinct vibrational types, i.e., longitudinal optical (LO) and transverse optical (TO) modes, resulting in 26 Raman active modes.27
m). To support this statement, we performed Raman spectroscopy on BFO-xSTO systems for all values of STO content (x = 0–0.25). The results are depicted in Fig. 2a, showing the deconvoluted Raman spectra of the solid solution collected at room temperature in the 35–800 cm−1 frequency range. Note that the Raman spectrum of the pristine rhombohedral BFO system is in good agreement with reported literature.25–27 We recall that the irreducible representation of the R3c space group can be expressed by: Γ = 4A1 + 5A2 + 9E, where the A2 modes are silent and the A1 modes (z-direction) and the doubly degenerate E modes (x-y plane) are both Raman and IR active. This results in 13 Raman active modes for the R3c space group; however, it should be mentioned that each vibrational mode can be divided into two distinct vibrational types, i.e., longitudinal optical (LO) and transverse optical (TO) modes, resulting in 26 Raman active modes.27
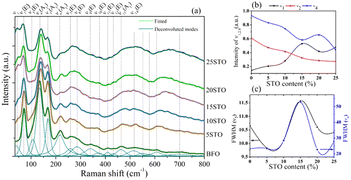 | ||
| Fig. 2 a) Deconvoluted Raman spectra of BFO-xSTO samples (x = 0–25%), (b) intensities of ν1,2,4 and (c) FWHM of ν5 and ν6 as a function of STO content. | ||
From the Raman spectrum of neat BFO, we note three relevant frequency regions, i.e., the low-frequency region (<167 cm−1) mainly involving Bi atom vibrations, the middle frequency region (152 < ν < 261 cm−1) implying Fe atoms, and the high-frequency region (ν > 262 cm−1) mainly involving oxygen motion. Interestingly, the introduction of STO in the system induced several changes to the Raman response, as observed in Fig. 2. First, at 5% STO, we observe the emergence of a new Raman mode ν1 at ∼40 cm−1, probably attributed to strontium vibrations, which is observed to increase with STO content increasing. On the other hand, a gradual decrease of ν2 and ν4 intensities (Bi vibrations) is observed in Fig. 2b due to the substitution of the stereochemically active Bi lone pair by Sr atom, inducing a weakening of the stereochemical activity of Bi–O covalent bonds.
The middle- and high-frequency regions are also sensitive to STO introduction and we observe a gradual increase in the intensities of the ν7, ν8, ν13 and ν14 modes. Moreover, the full-width at half maximum (FWHM) of the mode centered at 613 cm−1 (5% STO) is greatly enhanced, with a shift toward higher frequencies. We surmise that this behavior is the consequence of the Fe/TiO6 octahedral distortions through the Jahn–Teller effect, as previously demonstrated in Mn-doped BFO systems.28 A broadening of the Raman modes was also observed with the substitution, which indicates the increased disorder in the BFO system endowed by the introduction of STO. Interestingly, the FWHM of the Raman vibrational modes related to Fe atoms (ν5 and ν6) showed a maximum increase in 15% STO followed by a drastic decrease up to x = 25% (Fig. 2c). This behavior is similar to the evolution of the lattice parameters as a function of STO content obtained from the XRD investigations (Fig. 1e) and might reveal a structural evolution to the coexistence of rhombohedral and cubic phases with a probable predominant rhombohedral phase.
3.2. Microstructure analysis
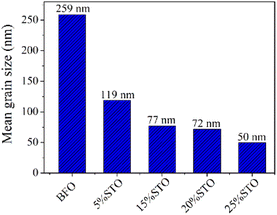
To investigate the effects of the substitution on the particle size and local structure of the BFO system, we performed TEM investigations on the BFO-xSTO systems. The tops of Fig. 3a–e depict the bright-field TEM images of a set of BFO-xSTO particles with x ≤ 25%. These TEM micrographs show a gradual decrease in the particle size as STO content increases, highlighted in Fig. 4. The mean grain size decreases from ∼260 nm for BFO to ∼50 nm for the 25% STO system. Note that achieving a well-crystalline small particle size is of great interest for the enhancement of optical and photocatalytic performances. For instance, it was previously reported that a compound made of BFO-0.9STO exhibiting grain sizes of only a few hundred nanometers achieved high hydrogen production yield compared to its bulk counterpart.19 In other regards, the HRTEM images of the fabricated samples depicted at the bottoms of Fig. 3a–e show an interplanar distance of 0.28 nm which corresponds to the (104) plane of BFO crystal of the rhombohedral R3c phase. This result is in accordance with our earlier reported structural and vibrational investigations.8 Hence, we assume here the presence of rhombohedral symmetry for compositions at low STO contents (x ≤ 15%), emphasizing the predominant rhombohedral phase for the higher substitution contents.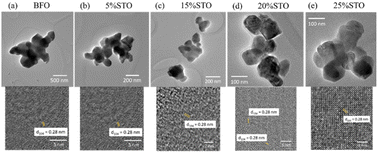 | ||
| Fig. 3 Bright field TEM images (top) of set particles and the corresponding HRTEM images (bottom) of BFO-xSTO: (a) x = 0, (b) x = 5%, (c) x = 15%, (d) x = 20% and (e) x = 25%. | ||
From the TEM images, the mean grain sizes of all samples are computed and given in Fig. 4. The grain size in BFO-xSTO nanomaterials decreases with increasing STO content, reaching 50 nm at x = 25% STO content.
3.3. Optical properties
To further investigate the optical properties, the spray coating technique was utilized to deposit BFO-xSTO nanoparticles on a glass substrate, using the same deposition conditions for all compounds. Fig. 5a shows the absorption spectra of BFO-xSTO films, including the neat BFO and STO phases. The BFO system presents a high transmittance (>50%) in the visible and near infra-red regions (Fig. S1a†), accompanied by low absorptions of ∼39% and ∼5% around 400 nm and above 600 nm, respectively (Fig. 5a).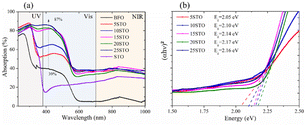 | ||
| Fig. 5 Optical properties of BFO-xSTO films using as-synthesized powders: (a) absorption and (b) Tauc plots of BFO-xSTO films. | ||
It should be noted that at low wavelengths (<400 nm), the BFO absorption is mainly attributed to the ligand to metal charge-transfer transitions, whereas at intermediate wavelengths (400 < λ < 600 nm), it is a result of contributions of both 6A1 → 4E, 4A1 (4G) ligand field transitions and the charge-transfer band tail.29 For higher wavelengths (>600 nm), it is mainly assigned to the 6A1 → 4T2 (4G) and 6A1 → 4T1 (4G) transitions. Furthermore, a higher absorption intensity is noticed for wavelengths <600 nm compared to the highest ones, indicating a stronger absorption from the charge-transfer transitions than from the ligand field transitions, owing to the selection rules.29
High transmittance and maximum reflectance values are also recorded for the neat STO system at 400 nm, whereas the BFO system presents a maximum reflectance at 600 nm (Fig. S1†). Interestingly, as the substitution content increases from 5% to 25%, the transmittance values decrease significantly, leading to a dramatic increase in the light absorption, reaching 87% in the 400–500 nm wavelength range for the highest STO content (25% STO). We surmise that the low obtained transmittance as a function of STO content is closely related to the substitution that led to low grain size (Fig. 4). This could be due to a decline in light scattering from the grain boundaries.30 Moreover, the BFO-xSTO exhibits significant increase in absorption, up to 36%, in the visible and near infra-red regions (>600 nm) (Fig. 5a) in contrast to the pristine BFO phase (only 5%). This indicates that STO substitution enhanced the absorption from both the charge-transfer transitions and ligand field transitions.
Fig. 5b presents the Tauc plots of the studied samples with the extracted corresponding band gap energies. Note that the band gap energies (Eg) of the neat BFO and STO phases were found to be 2.20 eV and 3.32 eV, respectively (Fig. S2†).8 Our results show a decrease of Eg to 2.05 eV for x = 5%, followed by a gradual increase with STO content up to x = 20%, i.e., Eg = 2.17 eV. This trend is no longer valid for x = 25% as a slight decrease to 2.16 eV is obtained, mostly ascribed to the structural change from rhombohedral (R3c) to phase coexistence (R3c + Pm![[3 with combining macron]](https://www.rsc.org/images/entities/char_0033_0304.gif) m) as demonstrated above by the XRD and Raman results.
m) as demonstrated above by the XRD and Raman results.
As we previously demonstrated,8 a dramatic enhancement of optical properties is expected for down-sized BFO thin films. Therefore, a second high energy milling at 1000 rpm for 8 hours was carried out on the synthesized powders before the final deposition as thin films. Fig. S3† presents an example of the size distribution and bright field TEM image (inset) of aggregate obtained BFO-5%STO nanoparticles showing a very low mean grain size, implying a dominant size in the range of 10–14 nm in diameter.
Similarly, the optical properties of all highly milled samples were analyzed. Fig. 6a presents the absorption of BFO-xSTO films with an initial nanopowder of ∼13 nm. Surprisingly, a plateau-like absorption is obtained in the 200–500 nm wavelength range for all BFO-xSTO films, with a maximum of 90% achieved at 25% STO content. Moreover, a significant optical absorption increase is recorded for wavelengths > 600 nm, reaching 43% for x = 25%.
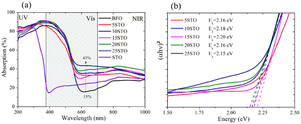 | ||
| Fig. 6 Optical properties of BFO-xSTO films with twice-milled powders of tens of nanometers: (a) absorption and (b) corresponding Tauc plots. | ||
The maximum reflectance peak exhibits a gradual downshift from low to high STO content, reaching 560 nm at x = 25% (Fig. S4†), which leads to higher absorption for wavelengths > 600 nm.
To further comprehend the effects of both substitutions and the low dimensionality of processed samples, the extracted band gap energies from the corresponding Tauc plots are reported in Fig. 6b. The Tauc plots of pristine phases with twice-milled initial powders are shown in Fig. S5.† For the sake of comparison, Table 1 details the band gap energies of BFO-xSTO films obtained from as-prepared powders and from twice-milled ones. For both initial powders, we note a decrease in Eg for x = 5%, an increase to maximum for the middle STO contents, and a decreasing trend for the higher substitution contents. This behavior can be related to the symmetrical change observed above in the BFO-xSTO solid solution. Indeed, at higher STO content, the initial rhombohedral (R3c) symmetry evolves to a coexistence of rhombohedral and cubic symmetries, inducing a decrease in Eg. It is interesting that the Eg of pristine BFO and STO phases for both highly milled and non-milled initial powders remain unchanged. Near equal Eg values for both bulk and nanoparticle BFO systems have been reported.31 For the substituted compounds, an important increase in Eg for the highly milled initial powder is noted, especially for x = 5–15%. Nonetheless, the Eg values of the substituted compounds remain lower than that of the pristine BFO sample. This decrease might be related to the induced hybridization between Fe and Ti atoms at the bottom of the conduction band. This phenomenon is investigated in more detail in the DFT calculations discussed below.
| STO content | 0 | 5% | 10% | 15% | 20% | 25% | 100% |
|---|---|---|---|---|---|---|---|
| E g (eV) as-prepared | 2.20 | 2.05 | 2.10 | 2.14 | 2.17 | 2.16 | 3.32 |
| E g (eV) ball-milled | 2.20 | 2.16 | 2.18 | 2.20 | 2.16 | 2.15 | 3.28 |
3.4. Photocurrent measurements
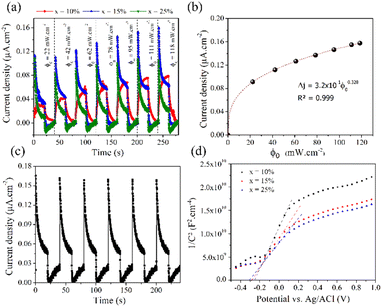
The transient photocurrent response was determined using a three-electrode cell consisting of Ag/AgCl as the reference electrode, Pt wire as the counter electrode and BFO-xSTO films grown on FTO substrate as the working electrode. An electrolyte solution of sodium sulfate (0.1 M) was employed. The chronoamperometry results achieved on BFO-xSTO films are shown in Fig. 7a (in particular by plotting the variation of the current density between illumination and dark, Δj = jlight − jdark) for various power densities under 450 nm excitation with no applied bias potential.Our results indicate the formation of a system generating a photocurrent without applied potential where a maximum current density is obtained for the BFO-15%STO system (Fig. S6†). A modification of behavior was observed on the evolution of the transient current density between x = 10% and 15%. Indeed, for x = 10%, the kinetics are relatively slow with an exponential type growth. This behavior is due to the trapping of electrons by defects, resulting in slow growth. For x > 15%, a current spike appears, followed by a decrease towards a stationary state. The initial photocurrent spike is caused by a large number of photogenerated carriers, resulting in a rapid increase in the current under light illumination.32 The following decay of the photocurrent means that recombination processes have occurred. Instead of capturing electrons from the electrolyte, the holes reach the surface of the semiconductor, accumulate on the surface and recombine with the photogenerated electrons. A maximum current density of ∼0.16 μA cm−2 was obtained for the BFO-15%STO system. These low experimental values were obtained without applied bias potential for films produced by the spray coating technique with a thickness around hundreds of nanometers. The thickness of the films can also influence the photocurrents generated, with a notable decrease with increasing thickness.33 Similar photocurrent density values were also reported in BFO-g-C3N4 composite (∼0.4 μA cm−2) under an applied potential of 0.3 V.34
Further, under 450 nm excitation, the photocurrent generated in BFO-15%STO increases with the power density of the light (ϕ0) according to the classical power law (Fig. 7b). The generated photocurrent increases from 0.09 to 0.16 μA cm−2 for 22 to 121 mW cm−2, respectively. The power law fitting suggests a curve going through the origin satisfying the following equation.
| Δj = 3.29 × 10⁻¹ϕ0.328 | (1) |
The value of the exponent of eqn (1) provides information on the traps present in the sample. For an ideal trap-free system, the exponent is equal to 1 and the photocurrent scales linearly with the illumination power. However, the exponent becomes smaller than 1 for trap states (for high powers, most traps are already filled and further illumination power cannot effectively increase the photocurrent).35 Additionally, the transient photocurrent response under solar illumination (150 W xenon lamp with AM 1.5G filter, 100 mW cm−2) was measured by carrying out on/off cycles (Fig. 7c) with no potential applied. We observe the achievement of a photocurrent density of 0.17 μA cm−2 within BFO-15%STO film and a stable response between the on/off cycles with a slight decrease, which may be related to the photocorrosion phenomenon.
The photostability was quantified and shows a decrease of 6% h−1 in the current density. This decrease is linked to the photocorrosion of BiFeO3 already well known in the literature.36
The semi-conductor capacitance is described by the Mott–Schottky (MS) equation37
It should be noted that, depending on the synthesis conditions, different properties can be obtained. For instance, using the sol–gel method, Shah et al. demonstrated p-type behavior for BFO and Mn-doped BFO nanoparticles,7 whereas Radmilovic et al. revealed an n-type characteristic for BFO films created through electrodeposition.38
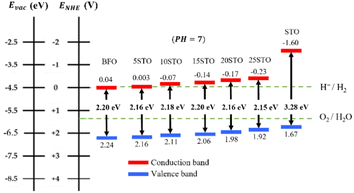
Based on our results, the potential of BFO-xSTO films for use as photoanodes for photocatalytic applications is investigated to examine the effects of the substitution. We evaluated the energies of the conduction band minimum (ECB) and valence band maximum (EVB) for all BFO-xSTO compositions using equations reported previously.39,40 In these equations, the Mulliken electronegativities (χ), the band gap energies, and ECB and EVB are linked by the following expressions
 | (2) |
 | (3) |
 | (4) |
From Fig. 8, the pristine BFO system appears to exhibit good alignment with the oxidation potential of water which would efficiently drive the oxygen evolution reaction (OER). However, the minimum of its ECB is not at the appropriate energy level of the hydrogen evolution reaction (HER) and needs to be adjusted to a lower energy than EH+/H2 to enable HER. In contrast, the neat STO presents a good band alignment with the water redox potentials. However, STO has a major drawback related to its high band gap energy of 3.28 eV, which only allows UV light absorption (less than ∼4% of total solar irradiation). Therefore, a moderate band gap energy in the visible region (∼55% of total solar irradiation) in addition to good band alignment with water redox potentials is greatly desired. It is interesting to note that the best band alignment is achieved by BFO-xSTO with intermediate compositions. Indeed, when STO content is increased from 5% to 25%, the ECB decreases lower than EH+/H2, allowing a remarkably enhanced HER. Note that this change in the ECB can be corroborated with the decrease in the flat-band potential observed experimentally. Indeed, the flat band potential reflects the position of the Fermi level.41 For n-type semi-conductors, the Fermi level lies close to the conduction band (CB).
Hence, our low dimensional BFO-xSTO films at intermediate STO contents could be very promising photoanode nanomaterials for photocatalytic WS applications owing to their good band alignment, moderate Eg allowing good absorption in the visible region and high surface area.
3.5. DFT calculations
To probe the mechanisms underlying the good photocatalytic performances in BFO substituted by STO, we performed DFT calculations on three selected compounds, i.e., BFO, STO, and BFO-12.5%STO to simulate intermediate STO contents. Considering our experimental results, we considered a rhombohedral (R3c) structure for the BFO and 12.5%STO systems and a cubic (Pm![[3 with combining macron]](https://www.rsc.org/images/entities/char_0033_0304.gif) m) symmetry for the STO system. To avoid artifacts that may be induced by low dimensional structures, we considered the bulk form of the BFO-xSTO system.
m) symmetry for the STO system. To avoid artifacts that may be induced by low dimensional structures, we considered the bulk form of the BFO-xSTO system.
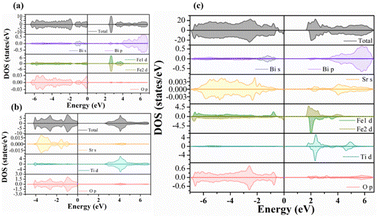
Fig. 9a–c present the total and partial density of electronic states (DOS) of the three compositions considered here. The DOS plot of the BFO system (Fig. 9a) shows that the VB is mainly constituted of O 2p orbitals with a small contribution from Bi 6s orbitals, whereas the CB mainly involves Fe 3d orbitals with a contribution from Bi 6p orbitals for energies over 4 eV. Note that, in our calculations, we considered the antiferromagnetic (AFM) ordering in the BFO system, which explains the obtained zero magnetic moment (equal spin up/dn channels). Regarding the STO system, we also note equal spin up/dn channels in the DOS plot (Fig. 9b) owing to the non-magnetic behavior of the cubic (Pm![[3 with combining macron]](https://www.rsc.org/images/entities/char_0033_0304.gif) m) structure considered in the system. Proportionally to BFO, the CB of the STO system is principally constituted of Ti 3d orbitals, while the VB involves O 2p with a contribution of Sr 5s orbitals. Fig. 9b shows a strong covalent hybridization between the O 2p and Ti 3d orbitals.
m) structure considered in the system. Proportionally to BFO, the CB of the STO system is principally constituted of Ti 3d orbitals, while the VB involves O 2p with a contribution of Sr 5s orbitals. Fig. 9b shows a strong covalent hybridization between the O 2p and Ti 3d orbitals.
The effect of STO insertion on the electronic properties of the BFO system is shown in Fig. 9c. First, the substitution of Fe by Ti appears to disturb the AFM behavior of BFO, resulting in a small magnetization generation in the substituted compound (unbalanced spin up/dn channels). Fig. 9c shows a clear reduction of the electronic band gap energy to 1.90 eV for the intermediate substitution content (BFO-12.5%STO) compared to the obtained values for BFO (2.40 eV) and STO (2.60 eV) phases. Our result does not correlate with the higher band gap energy previously reported on BFO-50%STO using LDA approximation.20 We believe that this difference is due to the mBJ approximation used in our work, which is known to estimate more accurately the exchange and correlation energies. On the other hand, the band gap reduction can also be related to the induced intermediate Ti 3d states in the CB, resulting in a strong hybridization between the Fe 3d and Ti 3d orbitals.
These last additional states are expected to act as trap states and are likely to result in a reduction of the e–h recombination in the substituted system compared to the neat phases.20
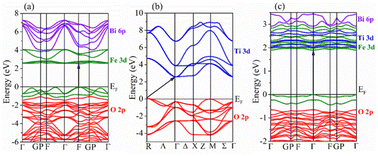
Fig. 10a–c show the band structures of the three considered compositions, where the top of the VB is set to zero. The computed band structures revealed a direct band gap nature for BFO (F–F) and an indirect band gap (R–Γ) for the STO system. It is interesting to note that BFO-12.5%STO exhibits a direct band gap (Γ–Γ). In addition, the band structure of BFO-12.5%STO highlights the intermixing of the Ti 3d (blue) and Fe 3d (green) orbitals in the CB.
In the following, we used the computed electronic properties to evaluate the optical properties of the three considered systems.
Fig. 11a presents the absorption of the systems in the energy range from 0 to 5 eV. The STO composition is observed to present strong absorption in the UV region with negligible absorption for energies less than 3 eV, which is in good agreement with previously reported values.42 For the BFO system, a first absorption edge is observed near 2.9 eV (∼430 nm), originating from the transition from O 2p (VB) to Fe 3d (CB) orbitals, which further increases in the UV region. Note that the substituted composition presents the highest absorption in the visible light region (1.77–3.26 eV) compared to BFO and STO, which corroborates our experimental results (Fig. 5c). Hence, considering the absorption coefficient (α) and the nature of the band gap (n = 2 for direct and n = 1/2 for indirect), we used the Tauc plot (Fig. 11b) to evaluate the band gap energies.
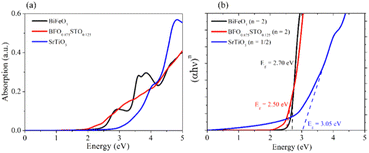 | ||
| Fig. 11 a) Optical absorption of the 3 considered samples and (b) corresponding Tauc plots of BFO-xSTO systems. | ||
The optical band gaps obtained for the bulk BFO, BFO-12.5%STO, and STO systems are 2.70 eV, 2.50 eV, and 3.05 eV, respectively. Note that the Eg values for the neat bulk structures are in good agreement with reported values.43,44 For the substituted composition, a decrease of Eg to 2.50 eV is obtained, consistent with our experimental findings, due to the induced intermediate Ti 3d states in the system highlighted in Fig. 10c. These additional states are also responsible for the enhanced absorption in the visible region. Moreover, charge transfers between different Fe3+ and Ti4+ species might also take part in the improved visible light absorption.19
It should be mentioned that the active sites taking part in the HER/OER can also be investigated using DFT calculations and we invite readers to refer to recent interesting related articles.7,16
In this work, to assess the quantity of hydrogen that could be produced by our compounds, we first investigated the band alignment with the water redox potentials using eqn (2)–(4). The computed values of ECB, EVBvs. NHE at pH = 7, Eg, Fermi energy (EF), the effective masses of electrons  , the effective densities of states Nc (cm−3), and the charge carrier densities (n) of BFO-xSTO systems and FTO compound are listed in Table 2. Recall that the FTO substrate was used in our experiment as a transparent conductive oxide (TCO). From the data in Table 2, we can deduce a type-I heterostructure between our active material and the FTO substrate.
 , the effective density of states Nc (cm−3), and the charge carrier density n (cm−3) of the BFO-xSTO solid solutions and FTO compound
| BFO | BFO-12.5%STO | STO | FTO45 | |
|---|---|---|---|---|
| E g (eV) | 2.70 | 2.50 | 3.05 | 4.01 |
| E CB (eV) | −0.21 | −0.26 | −1.49 | −0.553 |
| E VB (eV) | 2.48 | 2.23 | 1.55 | 3.4569 |
| E F (eV) | −0.061 | −0.20 | −1.44 | −0.3431 |

|
21.68 | 78.46 | 5.46 | — |
| N c (cm−3) | 2.52 × 10²¹ | 1.73 × 10²² | 3.18 × 10²⁰ | — |
| n (cm−3) | 9.69 × 10¹⁸ | 1.97 × 10²¹ | 5.061 × 10¹⁹ | 1.70 × 10²⁰ |
The findings in Table 2 indicate an improved band alignment with the water redox potentials for the substituted compound while exhibiting an appropriate Eg consistent with good absorption in the visible region. Table 2 also provides the computed effective relative masses of electrons for the BFO-xSTO system. Note that  was extracted from the band structure by fitting the CB minimum with a paraboloid. The
  (Γ-point) value for the STO system agrees with previously reported values.46 The effective mass of the BFO system at the F-point is found to be 21.68. Interestingly, the BFO-12.5%STO system was observed to present a more important curvature of the CB edge at the Γ-point (Fig. 10c), resulting in a considerable increase of the effective relative mass of electrons up to 78.46. Using these parameters, the effective density of states Nc (cm−3) as well as the charge carrier density n (cm−3) were computed. The charge carrier densities obtained for the pristine BFO (n ≈ 9 × 1018 cm−3) and STO (n ≈ 5 × 1019 cm−3) phases are comparable to reported values.38,47 Interestingly, an important increase of the electron density of ∼2 × 1021 cm−3 is noticed in the substituted compound, exceeding the values obtained for both the BFO and STO systems. Considering the HER, we evaluated the hydrogen production yield (H2 yield) generated in the three considered systems (Fig. 12). It is worth noting that the theoretical values are the ultimate thresholds obtained considering ideal cases. This means that they are unlikely to be reached in experimental conditions due to the inherent defects that could be present in the sample. These defects could be sites for leakage current and/or could induce electron/hole recombination not accounted for in our calculations. For instance, Ibarra-Rodriguez et al. revealed that LaMnO3 samples prepared using the sol–gel method presented higher generated hydrogen (103 μmol g−1 h−1) than the same compound elaborated using solid state method (23 μmol g−1 h−1).48
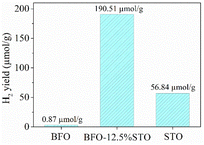 | ||
| Fig. 12 H2 production yield as computed for the considered BFO-xSTO (x = 0%, 12.5% and 100%) systems. | ||
The BFO presents a low H2 yield of ∼0.87 μmol g−1, similar to reported values obtained in neat BFO systems.49 On the other hand, the STO system appears to yield an HER of ∼57 μmol g−1, which is in line with values reported elsewhere.19,50 Interestingly, the highest electron density achieved in the BFO-xSTO (x = 12.5%) resulted in a considerable increase in the H2 yield to about 191 μmol g−1. Therefore, the substitution of the BFO system by STO material appears to be the right development for high performance photocatalytic WS devices.
Other solid-solutions based on STO have been reported in the literature: (SrTiO3)1−x·(LaTiO2N)x was found to present a hydrogen generation of ∼67 μmol g−1 h−1,51 whereas a higher H2 was reported for Cr-doped SrTiO3 nanoparticles.52 In the literature, some interesting results on BFO-based compositions were also reported. For instance, Arif et al. reported H2 generation of ∼89 μmol g−1 h−1 for BiFeO3-g-C3N4 composite.34 The addition of LaFeO3 to that system was found to drastically increase the H2 generation to ∼378 μmol g−1 h−1.34
Conclusions
BFO-xSTO (x ≤ 25%) nanoparticles were successfully created by solid-state assisted high energy ball milling and subsequently deposited by spray coating. The resulting Bi1−xSrxFe1−xTixO3 system exhibited a rhombohedral symmetry for compositions with x ≤ 15%, a coexistence of rhombohedral and cubic phases for x > 15%, and a decrease of grain size from 260 nm (x = 0%) to 50 nm (x = 25%). The obtained films showed very promising visible light absorption, with plateau-like absorptions of 70% to 90% (<500 nm) for all compositions. The BFO-xSTO has also shown its ability to convert absorbed light to photocurrent density, reaching 0.17 μA cm−2 for BFO-15%STO without an applied bias. In addition, as STO content is increased, an improved band alignment with water redox potentials is achieved, suggesting high potential as an efficient photoanode for the water splitting reaction. The DFT calculations allowed identification of the effects of the substitution on the electronic properties of the BFO system. In particular, the origin of the improved photocatalytic performances in the solid solution was quantified and explained. Interestingly, a considerable hydrogen amount was produced (191 μmol g−1) in the BFO-12.5%STO system owing to the enhanced electron density achieved in the composition. These results provide insights regarding the beneficial effects of down-sizing and substitution of the BFO system in improving photocatalytic water splitting reactions.Author contributions
M. B. and M. J. conceived the study; M. B., S. S. and N. S. R. carried out the experimental study; M. B. performed the modeling. M. B., S. S., M. E. and M. J. analyzed the data. All authors contributed equally on writing, editing, and reviewing the manuscript.Conflicts of interest
There are no conflicts to declare.Acknowledgements
Authors thanks the French Region Haut De France (HDF) for the financial support.Notes and references
- X. Xu, C. Randorn, P. Efstathiou and J. T. S. Irvine, Nat. Mater., 2012, 11, 595–598 CrossRef.
- Z. Zou, J. Ye, K. Sayama and H. Arakawa, Nature, 2001, 414, 625–627 CrossRef PubMed.
- F. Gao, X. Y. Chen, K. B. Yin, S. Dong, Z. F. Ren, F. Yuan, T. Yu, Z. G. Zou and J.-M. Liu, Adv. Mater., 2007, 19, 2889–2892 CrossRef.
- S. Li, Y.-H. Lin, B.-P. Zhang, Y. Wang and C.-W. Nan, J. Phys. Chem. C, 2010, 114, 2903–2908 CrossRef.
- X. Bai, J. Wei, B. Tian, Y. Liu, T. Reiss, N. Guiblin, P. Gemeiner, B. Dkhil and I. C. Infante, J. Phys. Chem. C, 2016, 120, 3595–3601 CrossRef.
- T. Gao, Z. Chen, Y. Zhu, F. Niu, Q. Huang, L. Qin, X. Sun and Y. Huang, Mater. Res. Bull., 2014, 59, 6–12 CrossRef.
- J. H. Shah, A. S. Malik, A. M. Idris, S. Rasheed, H. Han and C. Li, Chin. J. Catal., 2021, 42, 945–952 CrossRef CAS.
- M. Benyoussef, S. Saitzek, N. S. Rajput, M. Courty, M. El Marssi and M. Jouiad, Catalysts, 2022, 12(2), 1–18 CrossRef.
- O. V Nkwachukwu, C. Muzenda, B. O. Ojo, B. N. Zwane, B. A. Koiki, B. O. Orimolade, D. Nkosi, N. Mabuba and O. A. Arotiba, Catalysts, 2021, 11(1069), 1–16 Search PubMed.
- O. V Almjasheva, V. I. Popkov, O. V Proskurina and V. V Gusarov, Nanosyst.: Phys., Chem., Math., 2022, 13, 164–180 Search PubMed.
- S. Lan, C. Yu, F. Sun, Y. Chen, D. Chen, W. Mai and M. Zhu, Nano Energy, 2022, 93, 106792 CrossRef CAS.
- F. Niu, D. Chen, L. Qin, N. Zhang, J. Wang, Z. Chen and Y. Huang, ChemCatChem, 2015, 7, 3279–3289 CrossRef CAS.
- L. Zhou, Y. Li, Y. Zhang, L. Qiu and Y. Xing, Wuli Huaxue Xuebao, 2022, 38, 2112020–2112027 Search PubMed.
- S. Li, M. Cai, Y. Liu, J. Zhang, C. Wang, S. Zang, Y. Li, P. Zhang and X. Li, Inorg. Chem. Front., 2022, 9, 2479–2497 RSC.
- L. Wang, Y. Li, C. Wu, X. Li, G. Shao and P. Zhang, Chin. J. Catal., 2022, 43, 507–518 CrossRef CAS.
- X. Zhang, Z. Li, T. Liu, M. Li, C. Zeng, H. Matsumoto and H. Han, Chin. J. Catal., 2022, 43, 2223–2230 CrossRef CAS.
- S. Ni, D. Zhao, Y. Sun and J. E, Int. J. Hydrogen Energy, 2019, 44, 7692–7705 CrossRef CAS.
- M. S. Wrighton, A. B. Ellis, P. T. Wolczanski, D. L. Morse, H. B. Abrahamson and D. S. Ginley, J. Am. Chem. Soc., 1976, 98, 2774–2779 CrossRef CAS.
- L. Lu, M. Lv, G. Liu and X. Xu, Appl. Surf. Sci., 2017, 391, 535–541 CrossRef CAS.
- W. Li, K. Jiang, Z. Li, S. Gong, R. L. Z. Hoye, Z. Hu, Y. Song, C. Tian, J. Kim, K. H. L. Zhang and others, Adv. Energy Mater., 2018, 8, 1801972 CrossRef.
- K. Schwarz, P. Blaha and G. K. H. Madsen, Comput. Phys. Commun., 2002, 147, 71–76 CrossRef.
- L. Lu, M. Lv, D. Wang, G. Liu and X. Xu, Appl. Catal., B, 2017, 200, 412–419 CrossRef CAS.
- G. Qian, C. Zhu, C. Yin, L. Wang, Y. Wang, C. Li and S. Yuan, J. Electroceram., 2018, 40, 190–196 CrossRef CAS.
- E. P. Smirnova, A. V Sotnikov, N. V Zaitseva, H. Schmidt and M. Weihnacht, Phys. Solid State, 2014, 56, 996–1001 CrossRef CAS.
- P. Hermet, M. Goffinet, J. Kreisel and P. Ghosez, Phys. Rev. B: Condens. Matter Mater. Phys., 2007, 75, 220102 CrossRef.
- J. Bielecki, P. Svedlindh, D. T. Tibebu, S. Cai, S.-G. Eriksson, L. Börjesson and C. S. Knee, Phys. Rev. B, 2012, 86, 184422 CrossRef.
- J. Hlinka, J. Pokorny, S. Karimi and I. M. Reaney, Phys. Rev. B: Condens. Matter Mater. Phys., 2011, 83, 20101 CrossRef.
- L. Chen, L. Zheng, Y. He, J. Zhang, Z. Mao and X. Chen, J. Alloys Compd., 2015, 633, 216–219 CrossRef.
- Y. P. He, Y. M. Miao, C. R. Li, S. Q. Wang, L. Cao, S. S. Xie, G. Z. Yang, B. S. Zou and C. Burda, Phys. Rev. B, 2005, 71, 125411 CrossRef.
- S. Logothetidis, J. Appl. Phys., 1989, 65, 2416–2426 CrossRef.
- M. A. Basith, N. Yesmin and R. Hossain, RSC Adv., 2018, 8, 29613–29627 RSC.
- Z. Zhao, W. Wang, X. Zhou, L. Ni, K. Kang, T. Lee, H. Han, H. Yuan, C. Guo, M. Wang, M. J. Ko, Y. Li and D. Xiang, Nano Lett., 2020, 20, 8640–8646 CrossRef PubMed.
- S. Kossar, R. Amiruddin and A. Rasool, Micro Nano Syst. Lett., 2021, 9, 1 CrossRef.
- N. Arif, Y. Ma, M. A. Iqbal, M. N. Zafar, H. Liang, Q. Zhang and Y.-J. Zeng, Fuel, 2022, 126832 Search PubMed.
- Q. Zhao, W. Wang, F. Carrascoso-Plana, W. Jie, T. Wang, A. Castellanos-Gomez and R. Frisenda, Mater. Horiz., 2020, 7, 252–262 RSC.
- C. Hengky, X. Moya, N. D. Mathur and S. Dunn, RSC Adv., 2012, 2, 11843–11849 RSC.
- K. Gelderman, L. Lee and S. W. Donne, J. Chem. Educ., 2007, 84, 685 CrossRef CAS.
- A. Radmilovic, T. J. Smart, Y. Ping and K.-S. Choi, Chem. Mater., 2020, 32, 3262–3270 CrossRef CAS.
- M. A. Butler and D. S. Ginley, J. Electrochem. Soc., 1978, 125, 228 CrossRef CAS.
- C. Zhang, N. Jiang, S. Xu, Z. Li, X. Liu, T. Cheng, A. Han, H. Lv, W. Sun and Y. Hou, RSC Adv., 2017, 7, 16282–16289 RSC.
- X. G. Zhang, Electrochem. Silicon Its Oxide, Springer US, Boston, MA, 2001, pp. 1–43 Search PubMed.
- M. S. Bandaru and S. Choudhary, SN Appl. Sci., 2020, 2, 2071 CrossRef CAS.
- T. Hasegawa, M. Shirai and K. Tanaka, J. Lumin., 2000, 87–89, 1217–1219 CrossRef CAS.
- L. Qiao, S. Zhang, H. Y. Xiao, D. J. Singh, K. H. L. Zhang, Z. J. Liu, X. T. Zu and S. Li, J. Mater. Chem. C, 2018, 6, 1239–1247 RSC.
- E. Ching-Prado, A. Watson and H. Miranda, J. Mater. Sci.: Mater. Electron., 2018, 29, 15299–15306 CrossRef CAS.
- W. Zhiming, Z. Zhicheng, H. Xianfeng, G. Stefan, S. Bernhard, S. Michael, S.-B. Jaime, V. Andrei, F. Cesare, H. Karsten and D. Ulrike, Proc. Natl. Acad. Sci. U. S. A., 2014, 111, 3933–3937 CrossRef PubMed.
- T. Okuda, K. Nakanishi, S. Miyasaka and Y. Tokura, Phys. Rev. B: Condens. Matter Mater. Phys., 2001, 63, 113104 CrossRef.
- L. I. Ibarra-Rodriguez, A. M. Huerta-Flores, J. M. Mora-Hernandez and L. M. Torres-Martínez, J. Phys. Chem. Solids, 2020, 136, 109189 CrossRef CAS.
- A. Kolivand and S. Sharifnia, Int. J. Energy Res., 2021, 45, 2739–2752 CrossRef CAS.
- X. Xu, M. Lv, X. Sun and G. Liu, J. Mater. Sci., 2016, 51, 6464–6473 CrossRef.
- W. Luo, Z. Li, X. Jiang, T. Yu, L. Liu, X. Chen, J. Ye and Z. Zou, Phys. Chem. Chem. Phys., 2008, 10, 6717–6723 RSC.
- H. Yu, S. Ouyang, S. Yan, Z. Li, T. Yu and Z. Zou, J. Mater. Chem., 2011, 21, 11347–11351 RSC.
Footnote |
| † Electronic supplementary information (ESI) available. See DOI: https://doi.org/10.1039/d2na00755j |
| This journal is © The Royal Society of Chemistry 2023 |

